Chartbook #19: Health Insurance Coverage in America: 2002 to 2012
William A. Carroll, MA and
Jeffery A. Rhoades, PhD
The estimates in this report are based on the most recent data available from MEPS at the time the
report was written. However, selected elements of MEPS data may be revised on the basis of additional analyses, which could result in slightly different estimates from those shown here. Please check the MEPS Web site (http://www.meps.ahrq.gov) for the most current file releases.
The mission of AHRQ is to improve the quality, safety, efficiency, and effectiveness of health care for all Americans by:
- Using evidence to improve health care
- Improving health care outcomes through research
- Transforming research into practice.
Executive Summary
Foreward
Introduction
Source of Data
Section 1. Population Overview
Section 2. Health Insurance Status for Adults by Selected Demographic Characteristics
Section 2.1. Health insurance status by age, adults 18 to 64
Section 2.2. Health insurance status by sex, adults ages 18 to 64
Section 2.3. Health insurance status by race/ethnicity, adults ages 18 to 64
Section 2.4. Health insurance status by income, adults ages 18 to 64
Section 2.5. Health insurance status by region, adults ages 18 to 64
Section 3. Health insurance status for children by selected demographic characteristics
Section 3.1. Health insurance status by age, children ages 0 to 17
Section 3.2. Health insurance status by sex, children ages 0 to 17
Section 3.3. Health insurance status by race/ethnicity, children ages 0 to 17
Section 3.4. Health insurance status by income, children ages 0 to 17
Section 3.5. Health insurance status by region, children ages 0 to 17
References
Definition of Terms
Executive Summary
Population Overview
- From 2002 to 2012 the population increased by 15 million non-elderly adults and by 1 million children.
- The percentage of uninsured non-elderly adults increased from 15.7 percent in 2002 to 18.5 percent in 2012 which corresponds to an increase of 8 million.
- From 2002 to 2012 the percentage of uninsured children decreased from 7.7 percent to 5.0 percent which corresponds to a decrease of 2 million.
Health insurance status for adults by selected demographic characteristics
- From 2002 to 2012 the population of non-elderly adults increased by 15 million, from 179 million in 2002 to 194 million in 2012.
- The percentage uninsured adults increased by 4.9 percentage points for adults ages 26 to 44, increasing from 16.2 percent in 2002 to 21.1 percent in 2012 and by 3.2 percentage points for those ages 45 to 64, from 11.7 percent to 14.9 percent.
- The percentage of uninsured men increased by 3.3 percentage points, from 17.8 percent in 2002 to 21.1 percent in 2012 and the percentage of uninsured women increased by 2.4 percentage points, from 13.6 percent to 16.0 percent.
- White adults had an increase in the percentage uninsured of 1.7 percentage points, from 11.5 percent in 2002 to 13.2 percent in 2012, blacks had an increase of 3.0 percentage points, from 18.2 percent to 21.2 percent and multiple race adults had a decrease of 7.7 percentage points, from 18.3 percent to 10.6 percent.
- The percentage of middle income adults that were uninsured increased 2.5 percentage points, from 15.4 percent in 2002 to 17.9 percent in 2012 and high income adults increased by 1.2 percentage points, from 5.4 percent to 6.6 percent.
- The percentage uninsured increased 3.7 percentage points in the South, from 19.2 percent in 2002 to 22.9 percent in 2012 and 3.3 percentage points in the West, from 17.3 percent to 20.6 percent.
Health insurance status for children by selected demographic characteristics
- From 2002 to 2012 the population of children increased by 1 million, from 73 million in 2002 to 74 million in 2012.
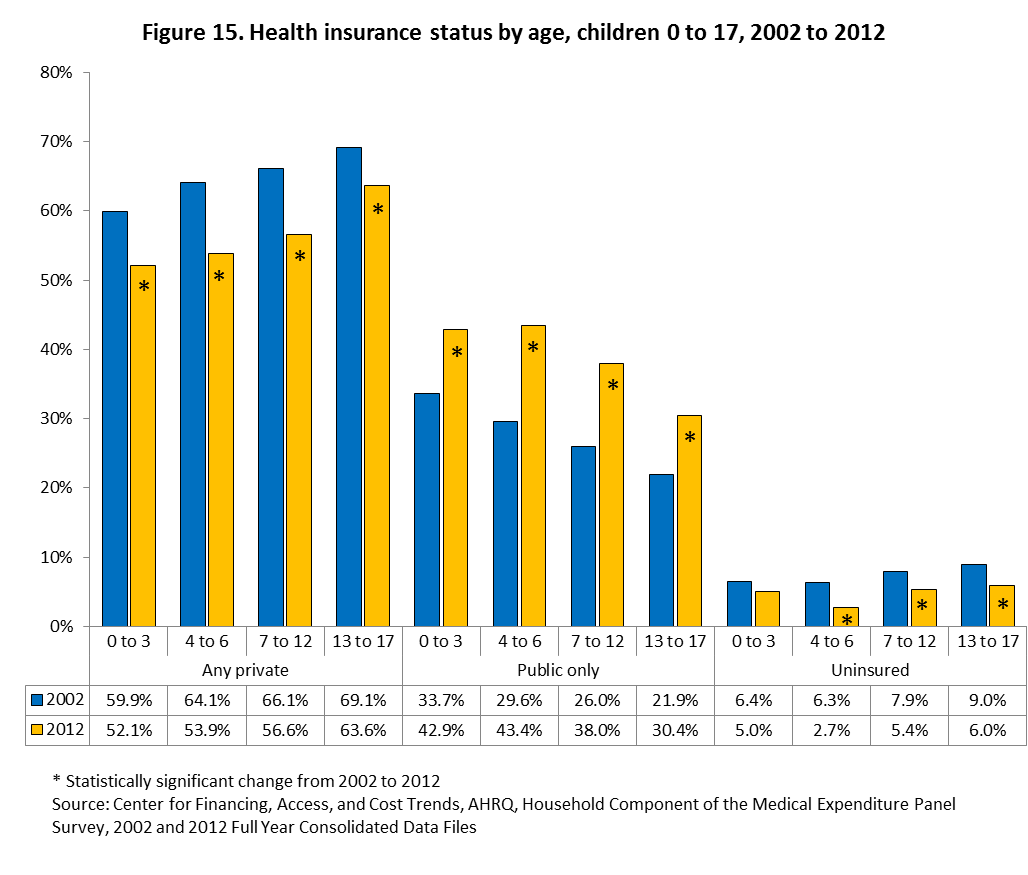
- The percentage uninsured decreased by 3.6 percentage points for children ages 4 to 6, from 6.3 percent in 2002 to 2.7 percent in 2012, by 2.5 percentage points for those 7 to 12, from 7.9 percent to 5.4 percent, and by 3.0 percentage points for those 13 to 17, from 9.0 percent to 6.0 percent.
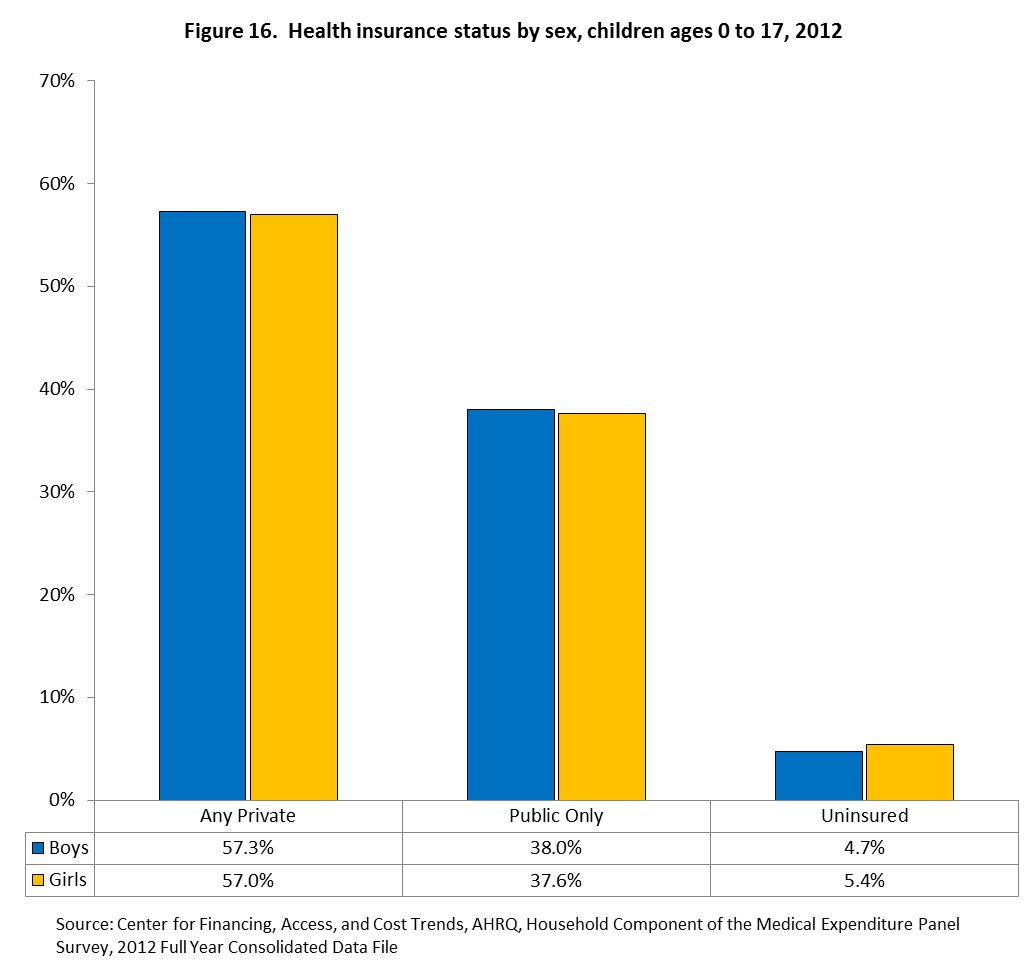
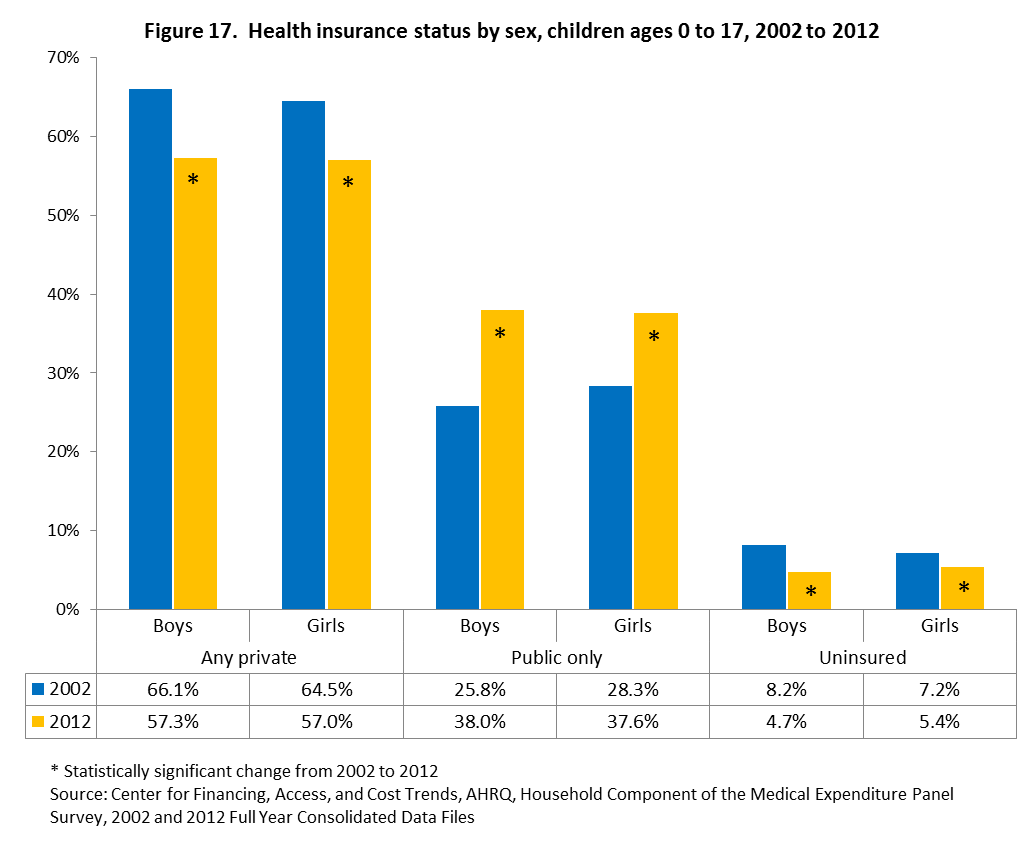
- The percentage of uninsured boys decreased by 3.5 percentage points, from 8.2 percent in 2002 to 4.7 percent in 2012 and the percentage of uninsured girls decreased by 1.8 percentage points, from 7.2 percent to 5.4 percent.
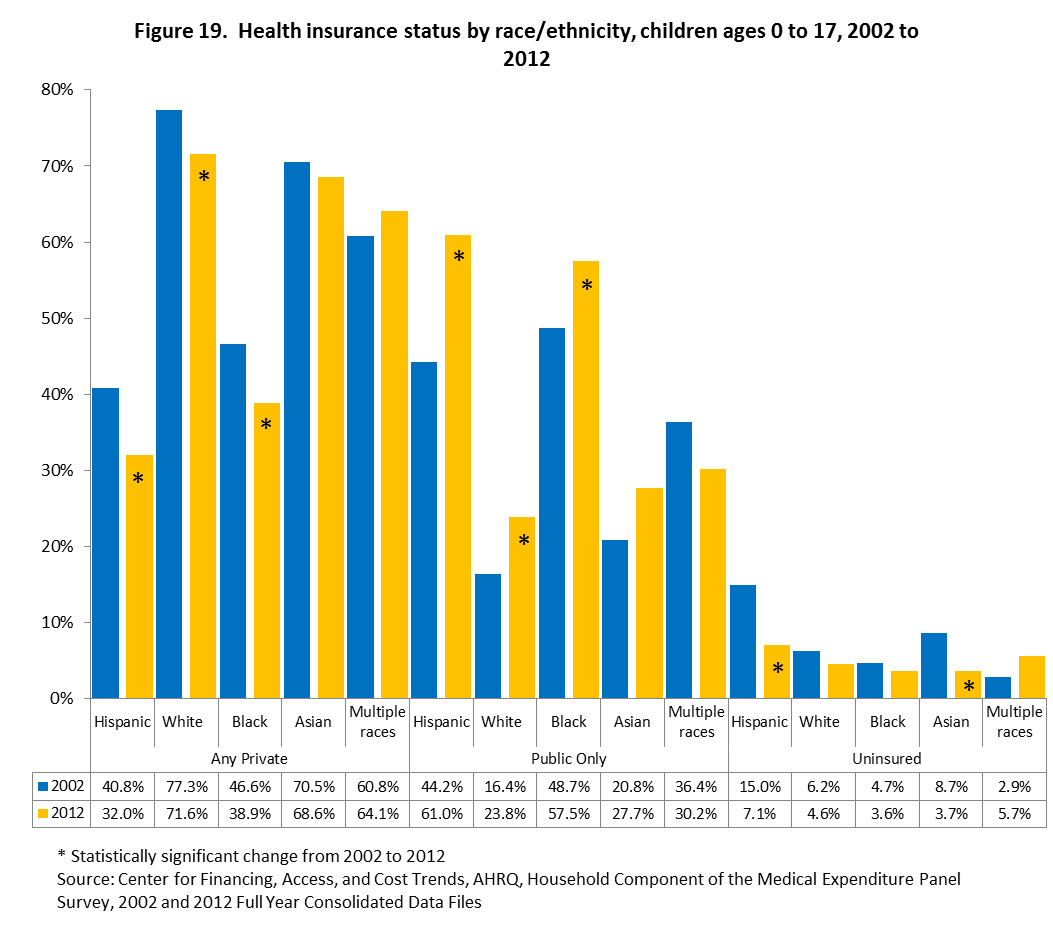
- Hispanic children had a decrease in the percentage uninsured of 7.9 percentage points, from 15.0 percent in 2002 to 7.1 percent in 2012 and Asians had a decrease of 5.0 percentage points, from 8.7 percent to 3.7 percent.
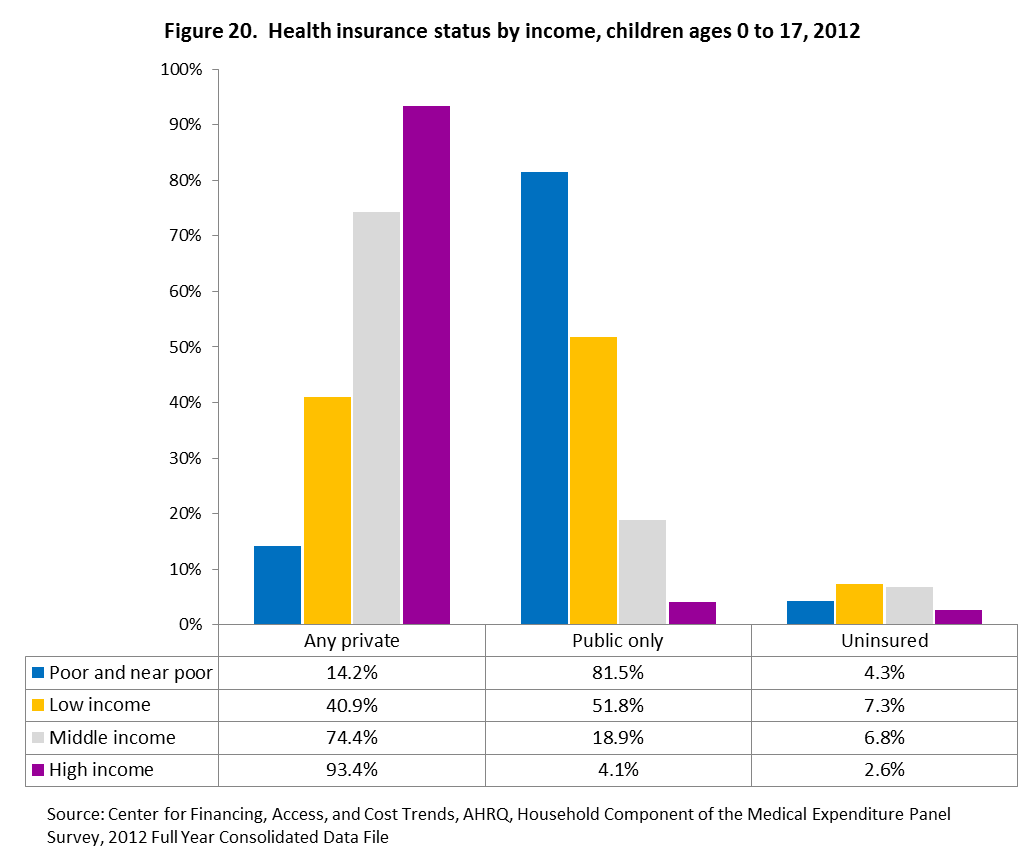
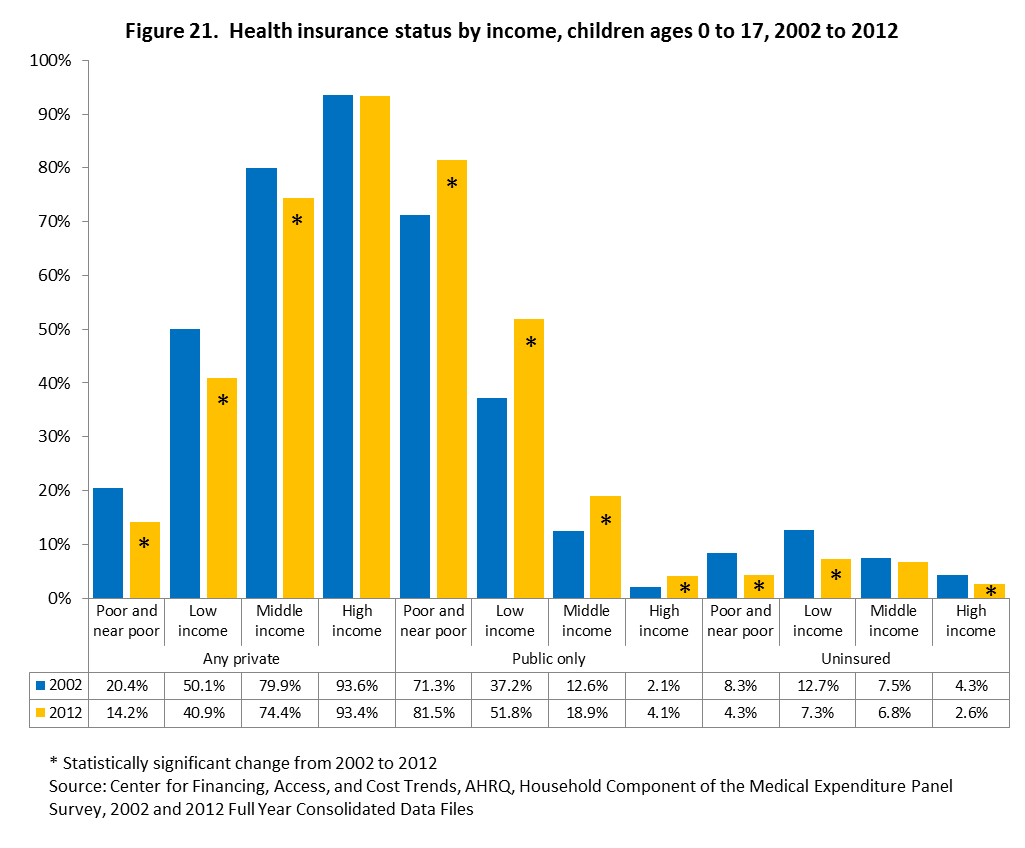
- The percentage of poor and near poor children that were uninsured decreased 4.0 percentage points, from 8.3 percent in 2002 to 4.3 percent in 2012, low household income children decreased 5.4 percentage points from 12.7 percent to 7.3 percent, and high household income children decreased by 1.7 percentage points, from 4.3 percent to 2.6 percent.
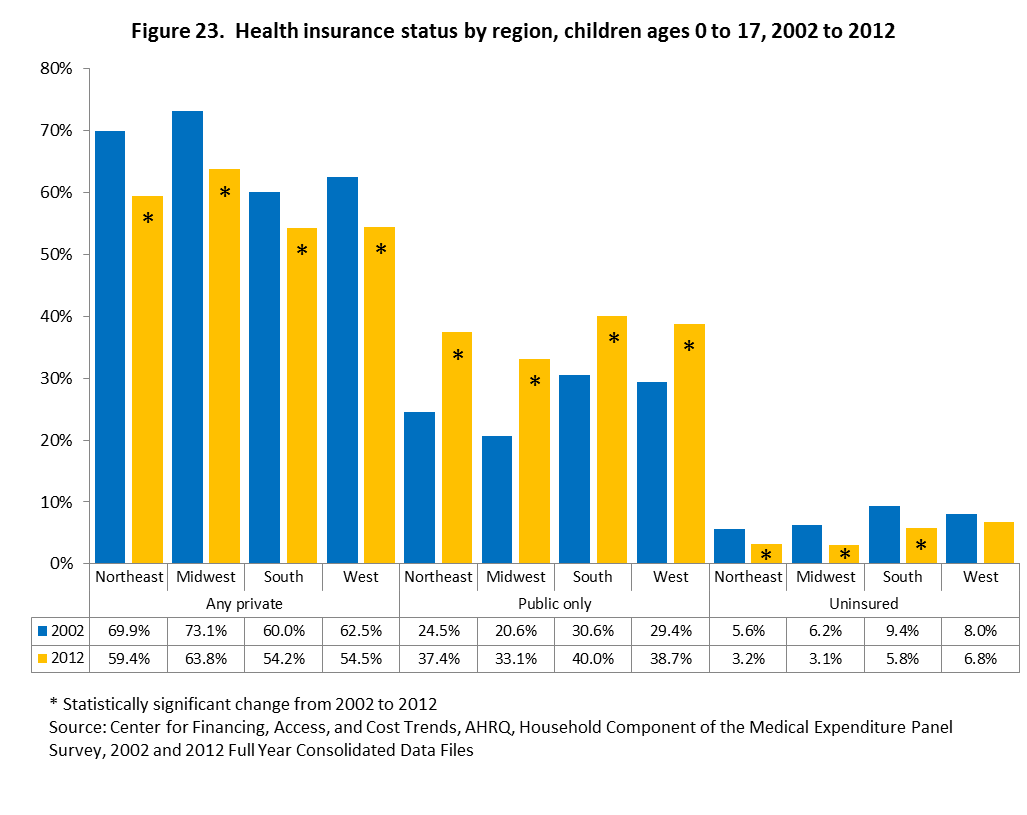
- The percentage uninsured decreased 3.6 percentage points in the South, from 9.4 percent in 2002 to 5.8 percent in 2012, by 3.1 percentage points in the Midwest, from 6.2 percent to 3.1 percent and by 2.4 percentage points in the West, from 5.6 percent to 3.2 percent.
Foreward
The mission of the Agency for Healthcare Research and Quality (AHRQ) is to improve the quality, safety, efficiency, and effectiveness of health care for all Americans. The Medical Expenditure Panel Survey (MEPS) helps AHRQ fulfill its mission by providing information on health care use and expenses, health insurance, health status, and a variety of demographic, social, and economic characteristics. MEPS is a set of large-scale surveys of families and individuals, their medical providers, and employers across the United States.
MEPS provides various ways of accessing the data so that it can be most useful to you. The MEPS Web site (http://www.meps.ahrq.gov) has:
- Online publications to read or download.
- MEPS public use data files that you can review and download.
- MEPSnet, which allows analysis of MEPS data using online statistical tools.
- Tables showing MEPS data displayed by some of the most frequently used characteristics.
AHRQ welcomes questions and comments from readers of this publication who are interested in obtaining more information about access, cost, use, financing, and quality of health care in the United States. We also invite you to tell us how you are using this Chartbook and other MEPS data and tools and to share suggestions on how MEPS products might be enhanced to further meet your needs.
Please email us at MEPSProjectDirector@ahrq.hhs.gov or send a letter to the address below:
Steven B. Cohen, PhD, Director
Center for Financing, Access, and Cost Trends
Agency for Healthcare Research and Quality
Rockville, MD 20850
1.0 Introduction
This Chartbook presents data from the 2002 to 2012 Medical Expenditure Panel Survey (MEPS), which is sponsored by the Agency for Healthcare Research and Quality (AHRQ), on health insurance coverage for the U.S. civilian noninstitutionalized population under the age of 65. The Chartbook is organized into three sections with sections 2 and 3 each containing five sub-sections. Section 1 presents data for the overall population less than 65 years old, section 2 restricts the presentation to adults ages 18 to 64 years old, and section 3 restricts the presentation to children ages 0 to 17 years old. Sections 2 and 3 will present the three health insurance categories (any private, public only, and uninsured) by age, sex, race/ethnicity, income and region. Sub-group estimates and differences between sub-groups in 2012 are presented first, followed by the change in estimates from 2002 to 2012. See the Definitions of Terms section for information and definitions of the categories used throughout the Chartbook.
Return
to Table of Contents
Source of Data
The Medical Expenditure Panel Survey (MEPS) provides nationally representative estimates of health care use, expenditures, sources of payment, and health insurance coverage for the U.S. civilian noninstitutionalized population. The MEPS Household Component (HC) also provides estimates of respondents� health status, demographic and socio-economic characteristics, employment, access to care, and satisfaction with health care. Estimates can be produced for individuals, families, and selected population subgroups. The panel design of the survey, which includes five rounds of interviews covering two full calendar years, provides data for examining person level changes in selected variables such as expenditures, health insurance coverage, and health status. Using computer assisted personal interviewing (CAPI) technology, information about each household member is collected, and the survey builds on this information from interview to interview. All data for a sampled household are reported by a single household respondent. The uninsured category includes all persons who did not have private or public insurance coverage at any time in the calendar year.
The estimates shown in this Chartbook are drawn from analyses of the following public use files: 2002 and 2012 full year consolidated data files, available on the MEPS Web site.
Only differences that are statistically significant at the 0.05 level are discussed in the text. In some cases, totals may not add precisely to 100 percent because of rounding.
Section 1. Population Overview
This section provides an overview of the health insurance status of children and non-elderly adults in the U.S. civilian noninstitutionalized population for 2012.
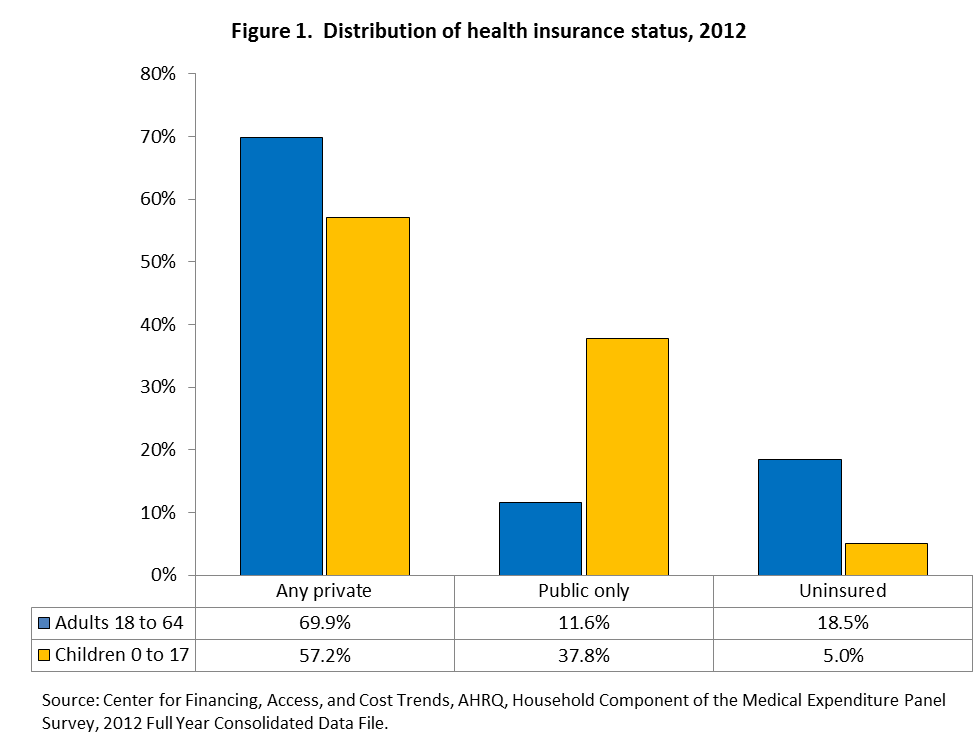
What was the total population of children and non-elderly adults in the U.S. and how were they distributed across health insurance categories in 2012?
- There were approximately 194 million non-elderly adults and 74 million children living in the U.S. in 2012 (data not shown).
- 69.9 percent of adults (136 million) had private health insurance, compared to 57.2 percent of children (42 million).
- 11.6 percent of adults (23 million) had only public health insurance, compared to 37.8 percent of children (28 million).
- 18.5 percent of adults (36 million) were uninsured, compared to 5.0 percent of children (4 million).
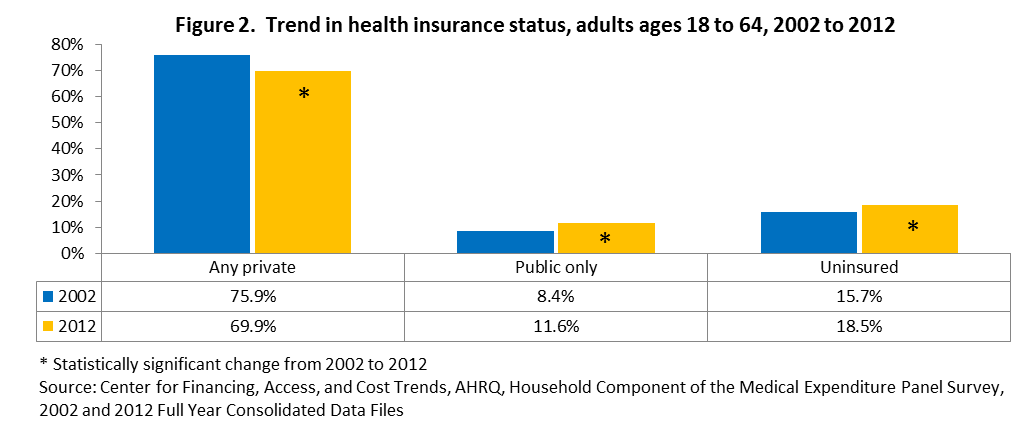
How has the population of non-elderly adults and children and their distribution across health insurance categories changed from 2002 to 2012?
- From 2002 to 2012 the population increased by 15 million non-elderly adults and by 1 million children (data not shown).
- The percentage of adults with private health insurance decreased by 6.0 percentage points, from 75.9 percent in 2002 to 69.9 percent in 2012, however, the number of adults with private insurance remained constant at 136 million (data not shown). Adults with public only coverage increased from 8.4 percent to 11.6 percent, which corresponds to an increase of 8 million and the percentage uninsured increased from 15.7 percent to 18.5 percent, which corresponds to an increase of 8 million.
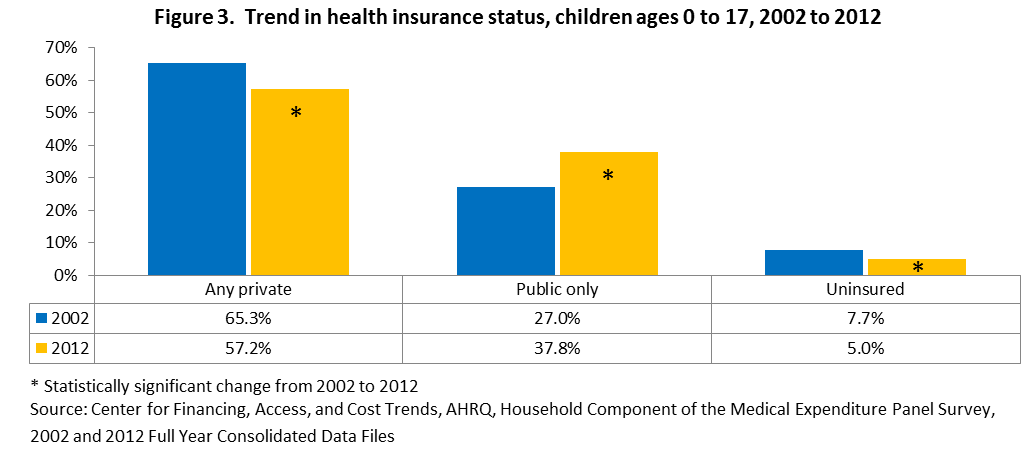
- For children, the percentage with private health insurance decreased by 8.1 percentage points, from 65.3 percent in 2002 to 57.2 percent in 2012 which corresponds to a decrease of 5 million. Children with public only health insurance increased by more than 10 percentage points, from 27.0 percent to 37.8 percent which corresponds to an increase of 8 million while the percentage uninsured decreased from 7.7 percent to 5.0 percent, which corresponds to a decrease of 2 million.
Return
to Table of Contents
Section 2. Health Insurance Status for Adults by Selected Demographic Characteristics
This section presents the health insurance status for adults ages 18 to 64 years old by age, sex, race/ethnicity, income and region. Subgroup differences for 2012 are presented first, followed by the change in health insurance status for subgroups from 2002 to 2012.
Section 2.1. Health insurance status by age, adults ages 18 to 64
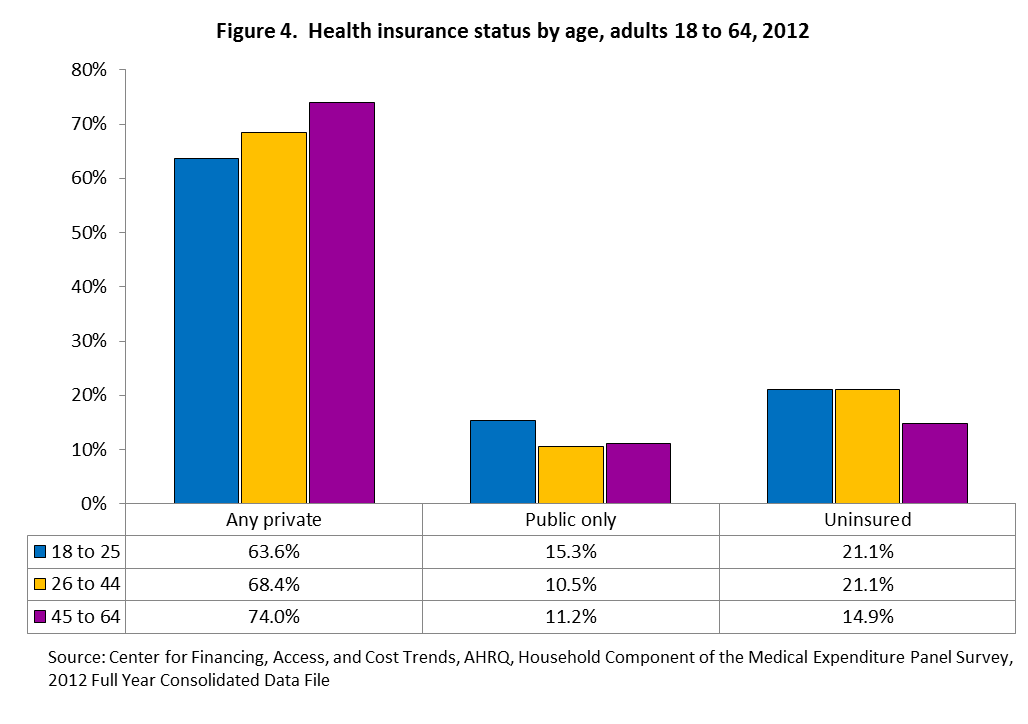
Were there any differences in health insurance status between adult age groups in 2012?
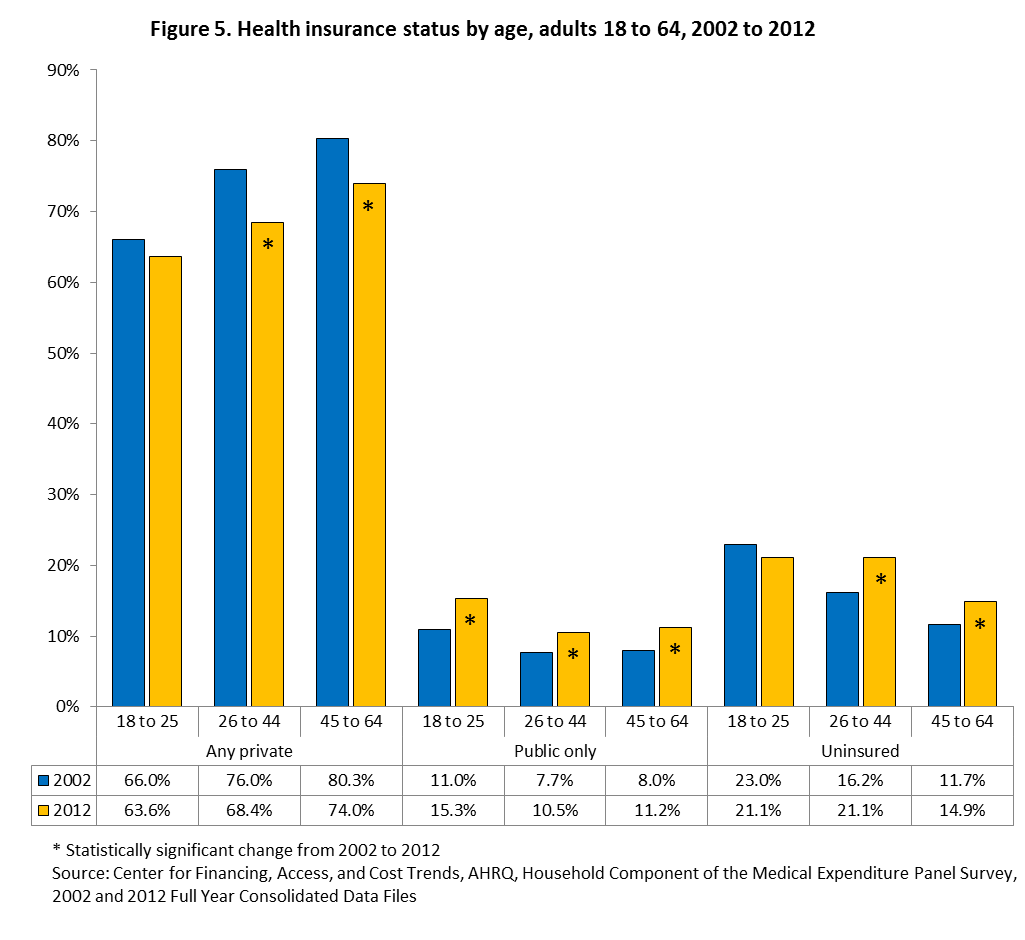
- The percentage of adults with private health insurance increased with age; 63.6 percent for adults 18 to 25, 68.4 percent for adults 26 to 44 and 74.0 percent for adults 45 to 64.
- Adults 18 to 25 were more likely than those 26 to 44 or 45 to 64 to have public only coverage (15.3 percent versus 10.5 and 11.2 percent, respectively).
- Adults 45 to 64 were less likely to be uninsured than those 18 to 25 or 26 to 44 (14.9 percent versus 21.1 and 21.1 percent, respectively).
How has the health insurance status of adults ages 18 to 64 years old changed since 2002?
- From 2002 to 2012, adults ages 26 to 44 had a 7.6 percentage point decline in private health insurance, declining from 76.0 percent in 2002 to 68.4 percent in 2012; adults ages 45 to 64 declined by 6.3 percentage points, from 80.3 percent to 74.0 percent.
- Public only health insurance increased across all non-elderly adult age categories, from 11.0 percent to 15.3 percent for those 18 to 25 years old, 7.7 percent to 10.5 percent for those 26 to 44 years old and from 8.0 percent to 11.2 percent for those 45 to 64 years old.
- The percentage uninsured increased by 4.9 percentage points for adults ages 26 to 44, increasing from 16.2 percent in 2002 to 21.1 percent in 2012 and by 3.2 percentage points for those 45 to 64, from 11.7 percent to 14.9 percent.
Section 2.2. Health insurance status by sex, adults ages 18 to 64
Were there any differences in health insurance status between men and women in 2012?
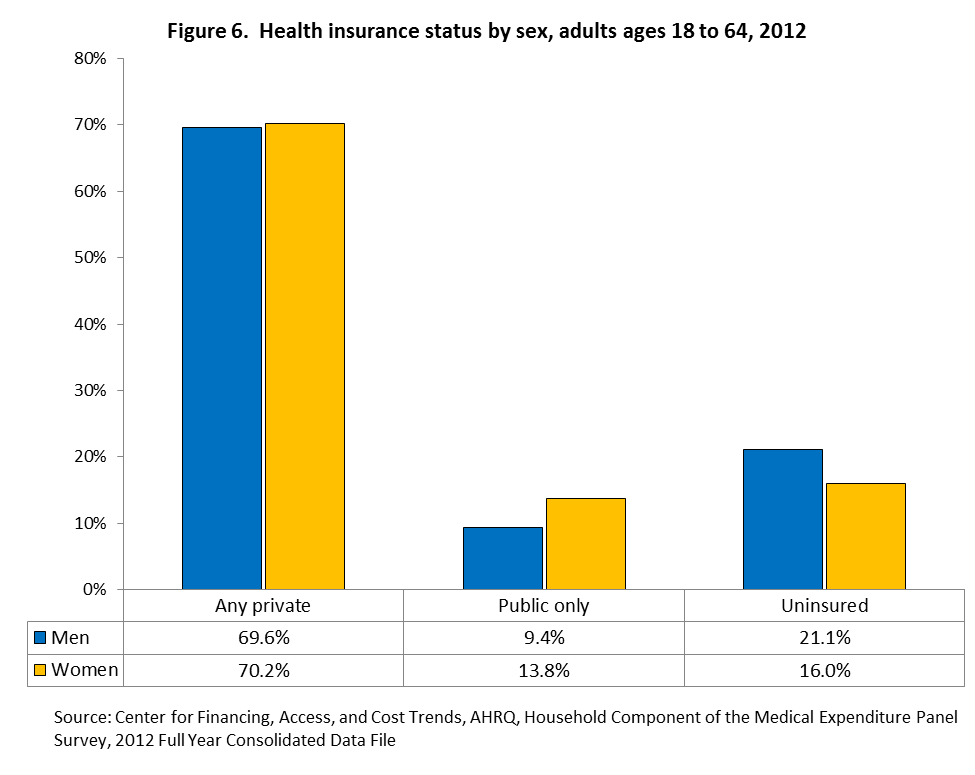
- In 2012, women were more likely than men to have public only health insurance (13.8 percent versus 9.4 percent, respectively).
- The percentage of men that were uninsured was 5.1 percentage points higher than the percentage of uninsured women (21.1 percent versus 16.0 percent, respectively).
How has the health insurance status of men and women changed since 2002?
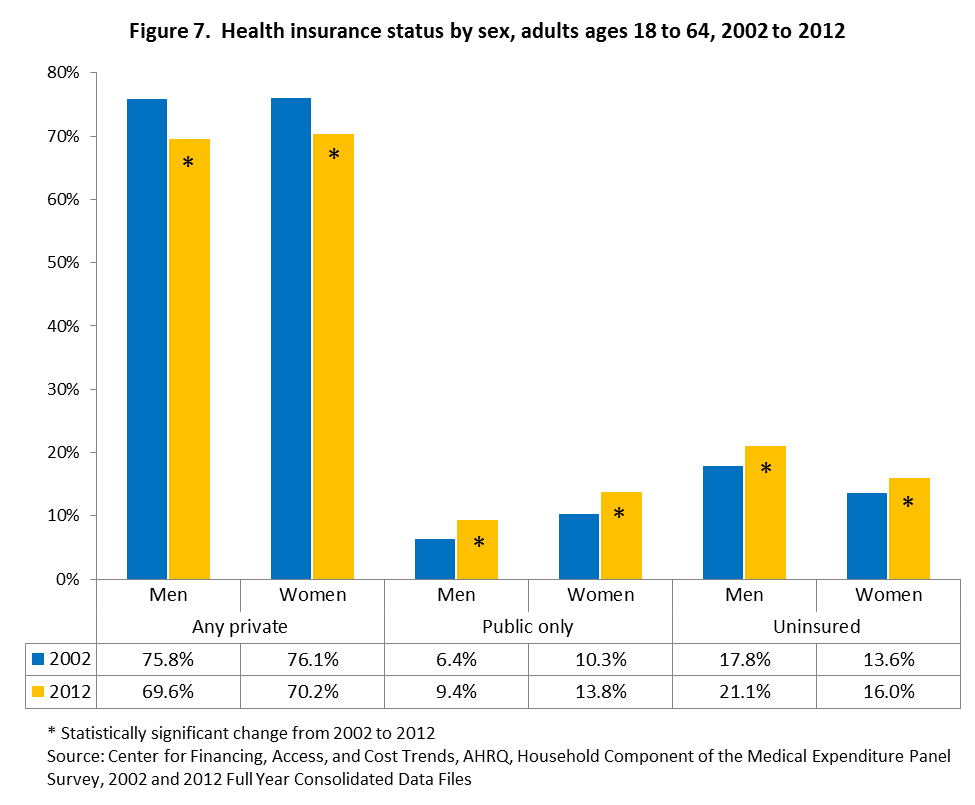
- Both men and women had a substantial decrease in the percentage with private health insurance from 2002 to 2012. Men decreased by 6.2 percentage points, from 75.8 percent in 2002 to 69.6 percent in 2012, while women had a similar decrease of 5.9 percentage points, from 76.1 percent in 2002 to 70.2 percent in 2012.
- The percentage with public only insurance increased for both sexes, from 6.4 percent in 2002 to 9.4 percent in 2012 for men and from 10.3 percent to 13.8 percent for women.
- The percentage of uninsured men increased by 3.3 percentage points, from 17.8 percent in 2002 to 21.1 percent in 2012 and the percentage of uninsured women increased by 2.4 percentage points, from 13.6 percent to 16.0 percent.
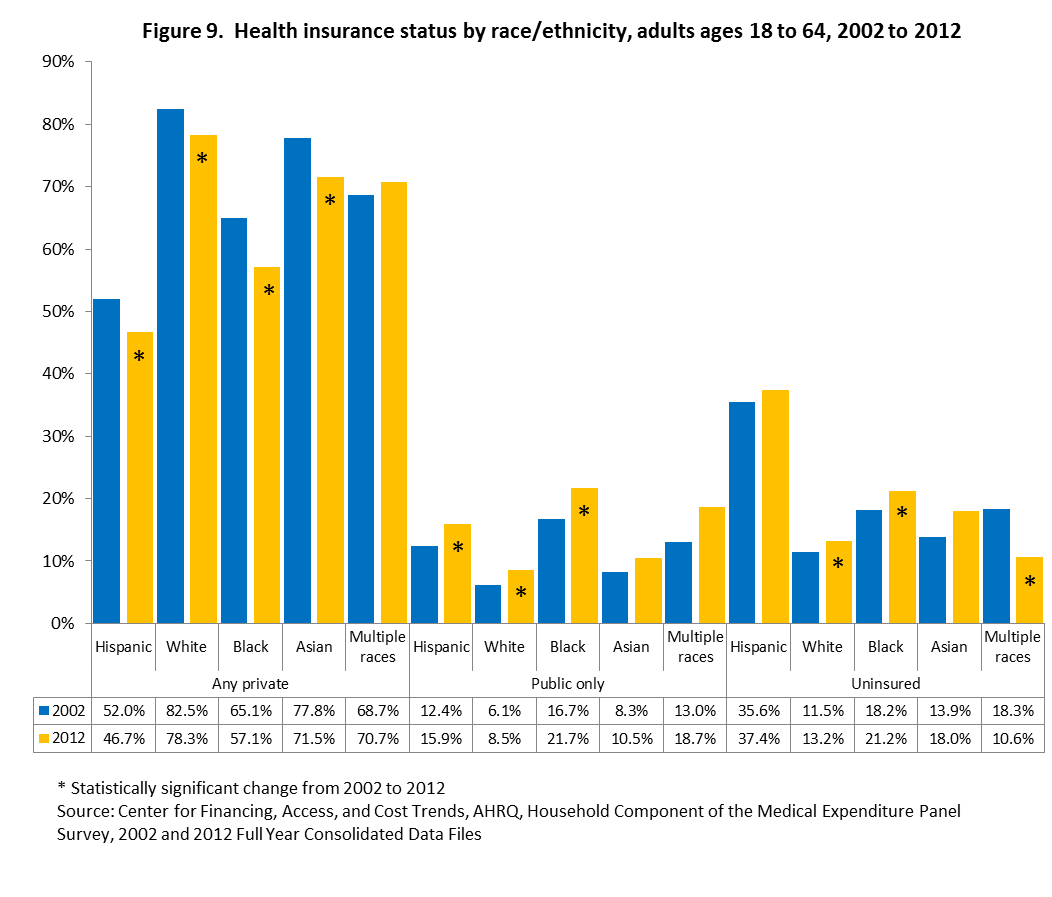
Section 2.3. Health insurance status by race/ethnicity, adults ages 18 to 64
Were there any differences in health insurance status between racial/ethnic groups in 2012?
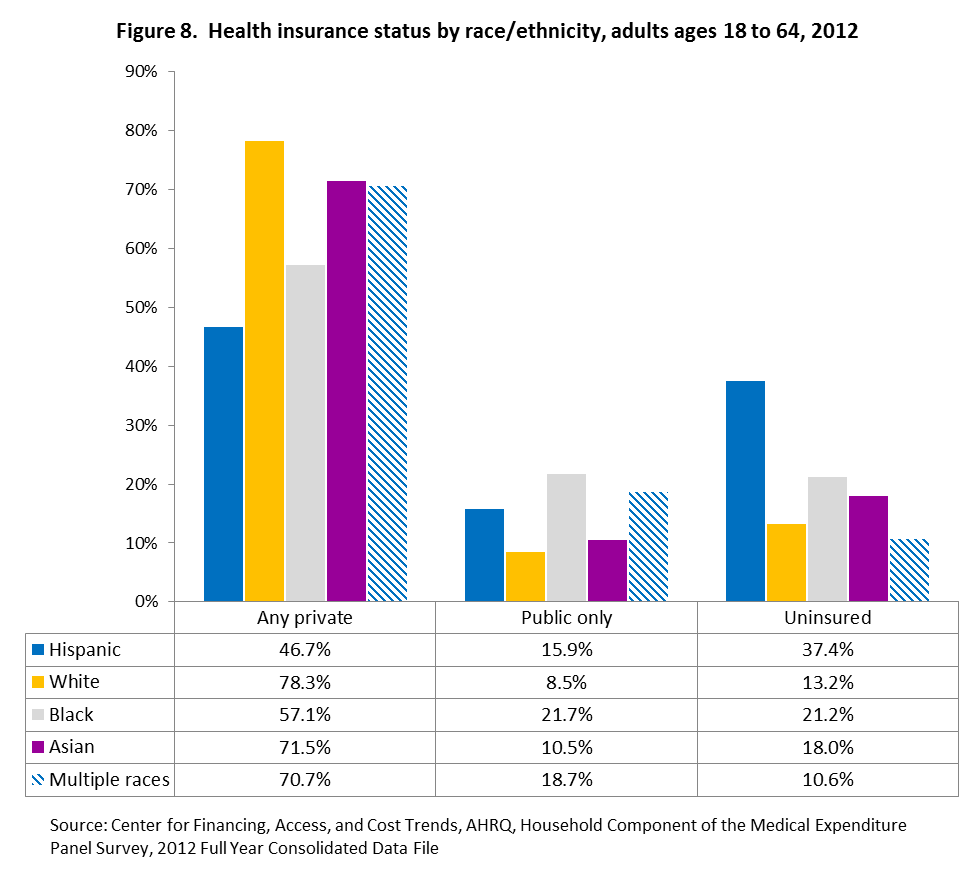
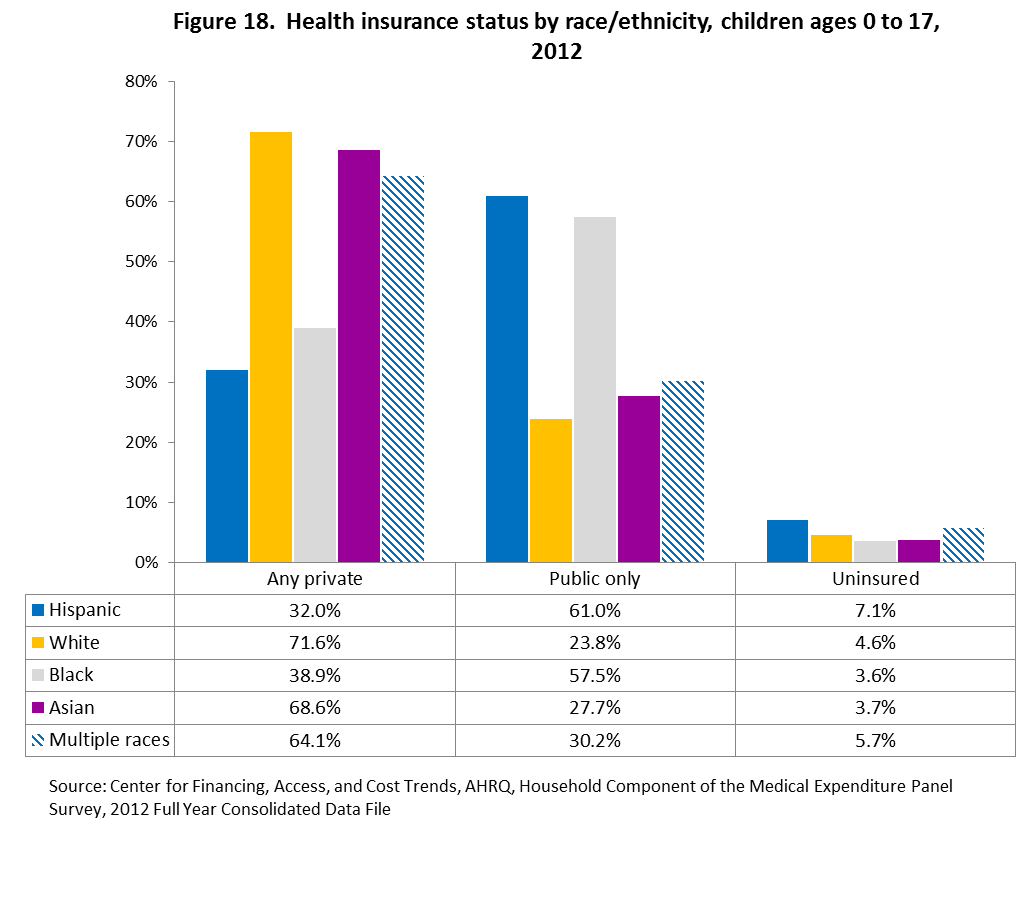
- In 2012 less than half (46.7 percent) of Hispanic adults had private insurance, compared to 78.3 percent for whites, 57.1 percent for blacks, 71.5 percent for Asians, and 70.7 percent for multiple races.
- Whites (8.5 percent) and Asians (10.5 percent) were the least likely to have public only insurance, compared to Hispanics (15.9 percent), blacks (21.7 percent), and multiple races (18.7 percent).
- Hispanic adults were most likely to be uninsured (37.4 percent), compared to 13.2 percent of whites, 21.2 percent of blacks, 18.0 percent of Asians, and 10.6 percent of multiple race adults.
How has the health insurance status of racial/ethnic groups changed since 2002?
- The percentage with private health insurance declined for Hispanic adults, from 52.0 percent in 2002 to 46.7 percent in 2012, for whites, from 82.5 percent to 78.3 percent, for blacks, from 65.1 percent to 57.1 percent, and for Asians, from 77.8 percent to 71.5 percent.
- The percentage with public only insurance increased for Hispanics, from 12.4 percent in 2002 to 15.9 percent in 2012, for whites, from 6.1 percent to 8.5 percent and for blacks, from 16.7 percent to 21.7 percent.
- White adults had an increase in the percentage uninsured of 1.7 percentage points, from 11.5 percent in 2002 to 13.2 percent in 2012, blacks had an increase of 3.0 percentage points, from 18.2 percent to 21.2 percent and multiple race adults had a decrease of 7.7 percentage points, from 18.3 percent to 10.6 percent.
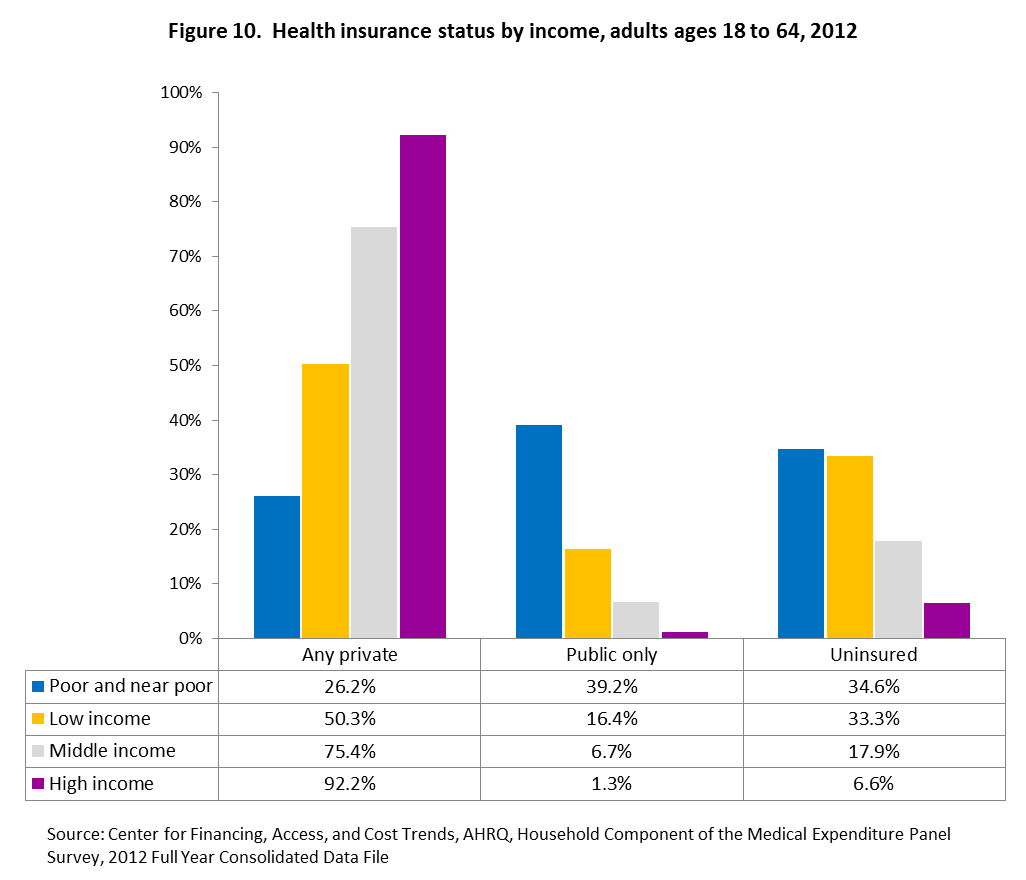
Section 2.4. Health insurance status by income, adults ages 18 to 64
Were there any differences in health insurance status between income groups in 2012?
- The percentage with private health insurance increased with income in 2012, with 26.2 percent of poor and near poor adults having private insurance, increasing to 92.2 percent for high income adults.
- The percentage with public only insurance decreased with income, with 39.2 percent of poor and near poor adults having public only insurance, decreasing to 1.3 percent for high income adults.
- High income adults were the least likely to be uninsured in 2012 (6.6 percent) and middle income adults (17.9 percent) were less likely to be uninsured than either low income adults (33.3 percent) or poor and near poor adults (34.6 percent).
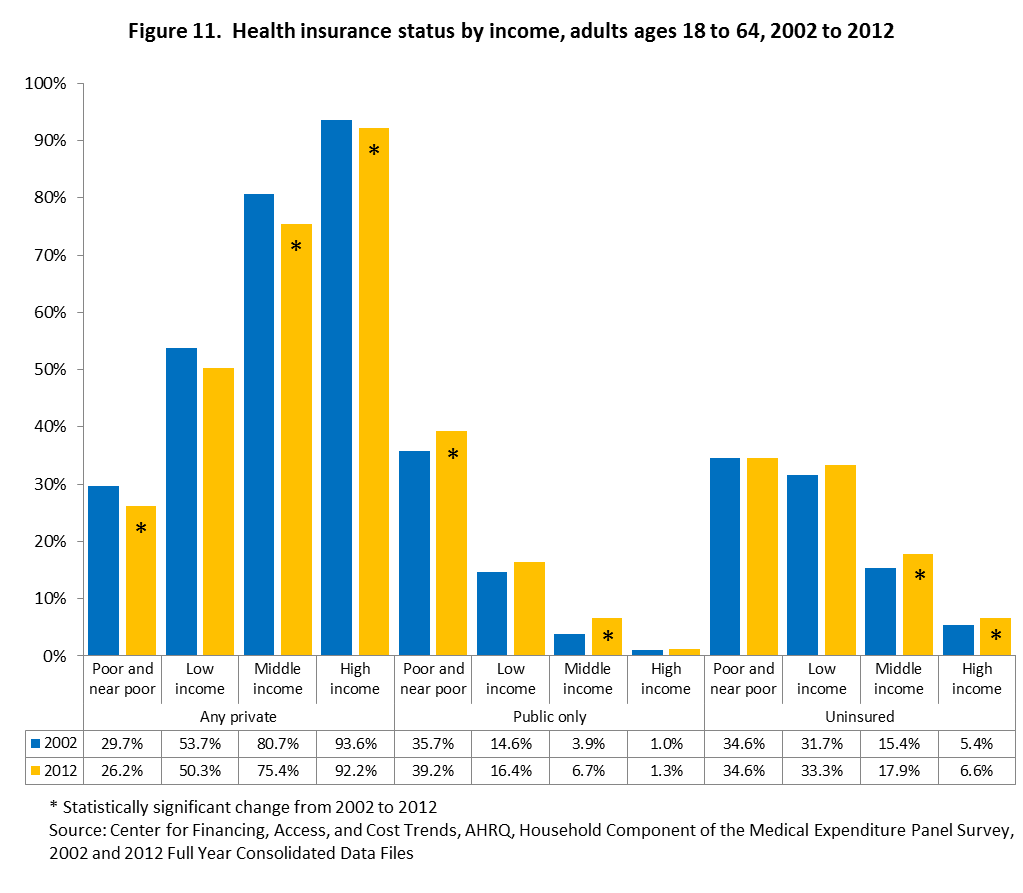
How has the health insurance status of income groups changed since 2002?
- Private health insurance declined for poor and near poor adults from 29.7 percent in 2002 to 26.2 percent in 2012, from 80.7 percent to 75.4 percent for middle income adults, and from 93.6 percent to 92.2 percent for high income adults.
- The percentage with public only health insurance increased for poor and near poor adults from 35.7 percent in 2002 to 39.2 percent in 2012, and from 3.9 percent to 6.7 percent for middle income adults.
- The percentage of middle income adults that were uninsured increased 2.5 percentage points, from 15.4 percent in 2002 to 17.9 percent in 2012 and high income adults increased by 1.2 percentage points, from 5.4 percent to 6.6 percent.
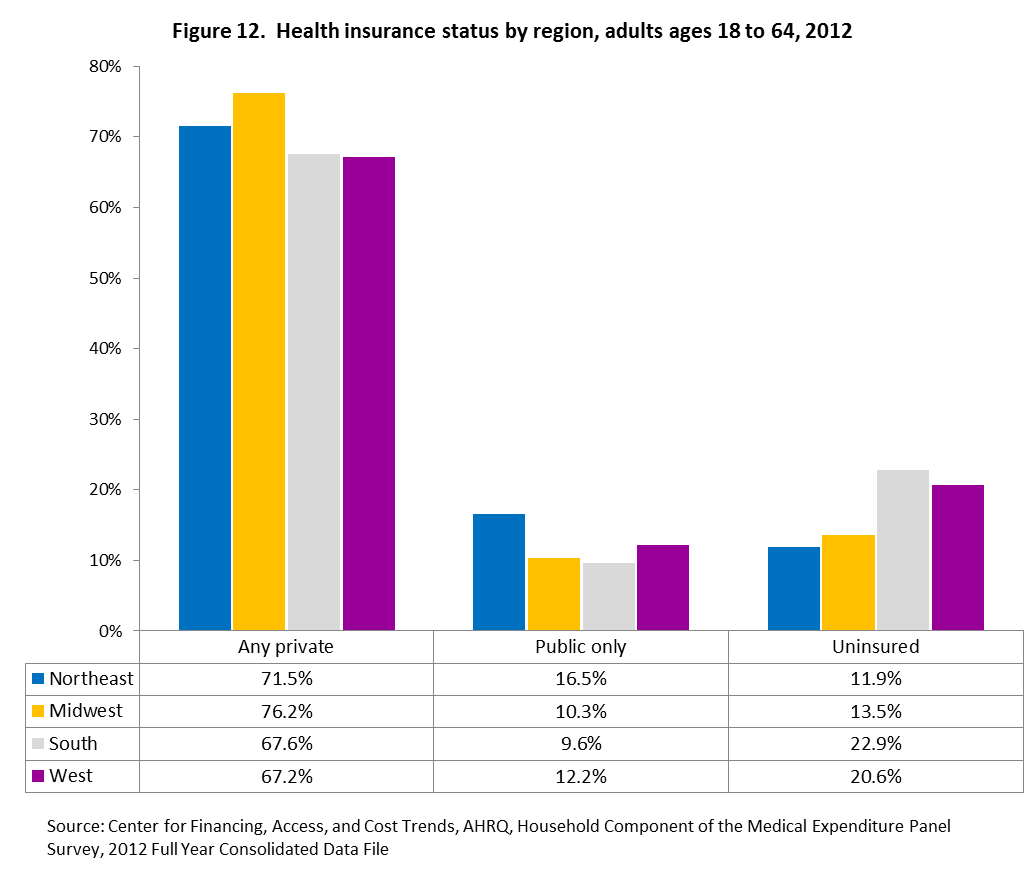
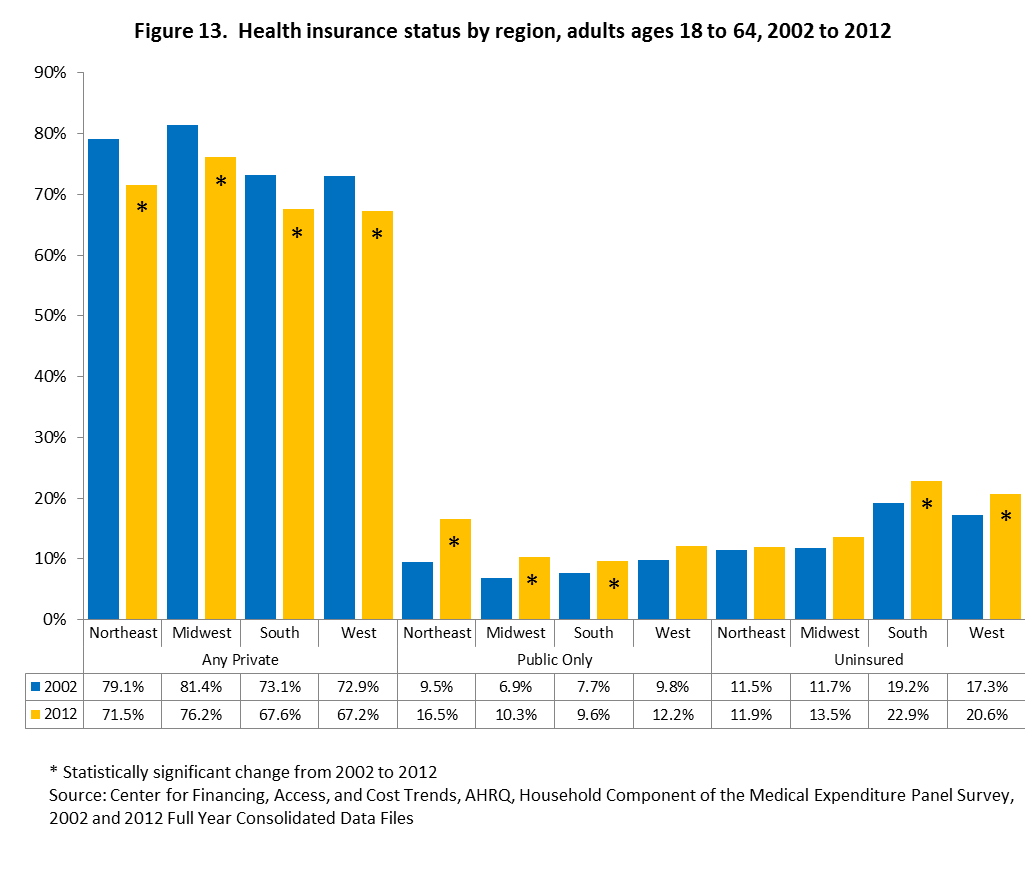
Section 2.5. Health insurance status by region, adults ages 18 to 64
Were there any differences in health insurance status between different regions in 2012?
- Adults living in the South or West had the lowest percentage with private health insurance and adults living in the Midwest had the highest percentage (67.6 percent, 67.2 percent and 76.2 percent, respectively).
- For public only health insurance, the Northeast had the highest percentage (16.5 percent), compared to 10.3 percent in the Midwest, 9.6 percent in the South, and 12.2 percent in the West.
- Adults living in the Northeast or Midwest were less likely to be uninsured than adults living in either the South or West (11.9 percent and 13.5 percent versus 22.9 percent and 20.6 percent, respectively).
How has the health insurance status of the regions changed since 2002?
- The percentage with private health insurance declined for all regions from 2002 to 2012. The Northeast declined 7.6 percentage points, from 79.1 percent in 2002 to 71.5 percent in 2012; the Midwest declined 5.2 percentage points, from 81.4 percent to 76.2 percent; the South declined 5.5 percentage points, from 73.1 percent to 67.6 percent; the West declined 5.7 percentage points, from 72.9 percent to 67.2 percent.
- For public only health insurance, the Northeast increased from 9.5 percent in 2002 to 16.5 percent in 2012, the Midwest increased from 6.9 percent to 10.3 percent and the South increased from 7.7 percent to 9.6 percent.
- The percentage uninsured increased 3.7 percentage points in the South, from 19.2 percent in 2002 to 22.9 percent in 2012 and 3.3 percentage points in the West, from 17.3 percent to 20.6 percent.
Section 3. Health insurance status for children by selected demographic characteristics
This section presents the health insurance status for children ages 0 to 17 years by age, sex, race/ethnicity, income and region. Subgroup differences for 2012 are presented first, followed by the change in health insurance status for subgroups from 2002 to 2012.
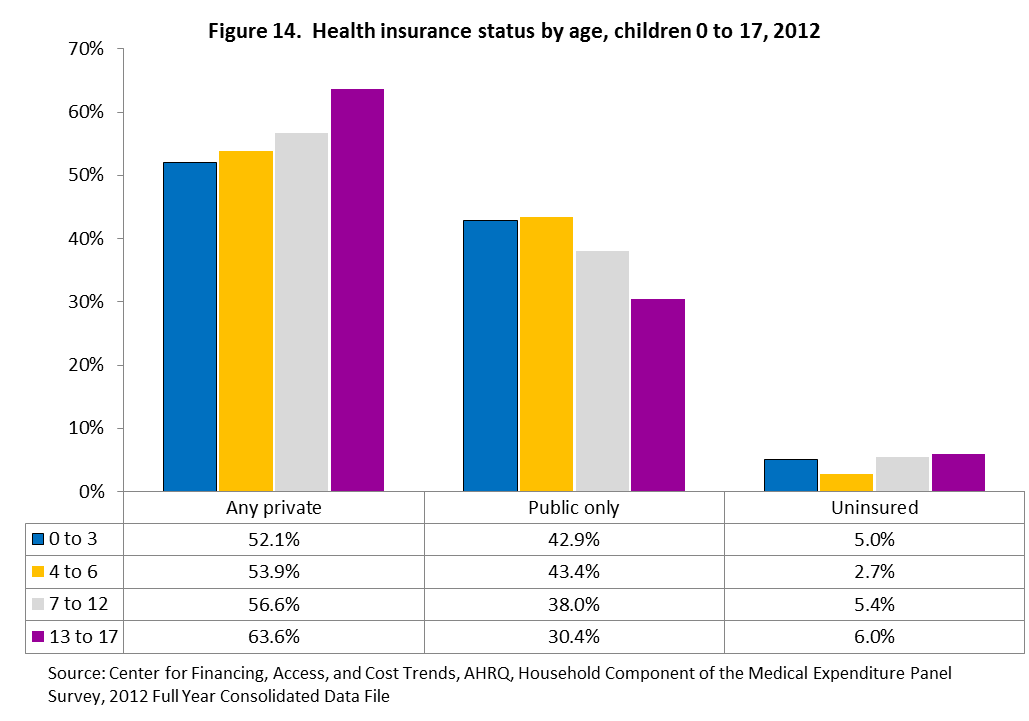
Section 3.1. Health insurance status by age, children ages 0 to 17
Were there any differences in health insurance status between children�s age groups in 2012?
- Children aged 13 to 17 were the most likely to have private health insurance (63.6 percent) compared to children aged 0 to 3 (52.1 percent), 4 to 6 (53.9 percent), and 7 to 12 (56.6 percent).
- Conversely, children ages 13 to 17 were the least likely to have public only health insurance (30.4 percent) compared to children ages 0 to 3 (42.9 percent), 4 to 6 (43.4 percent), and 7 to 12 (38.0 percent).
- Children ages 4 to 6 were the least likely to be uninsured (2.7 percent) compared to children ages 0 to 3 (5.0 percent), 7 to 12 (5.4 percent), and 13 to 17 (6.0).
Section 3.2. Health insurance status by sex, children ages 0 to 17
Section 3.3. Health insurance status by race/ethnicity, children ages 0 to 17
Section 3.4. Health insurance status by income, children ages 0 to 17
Section 3.5. Health insurance status by region, children ages 0 to 17
References
Definition of Terms
Return
to Table of Contents
| Type of Public Use File (PUF) |
Variable Name in
PUF 2 |
| Person-Level |
Family-Level |
| PIT |
WGTSP13 |
WGTRU13 |
| FY Preliminary |
PERWTyyP |
— |
| SAQ Supplement |
SAQWTyyP |
— |
| DCS Supplement |
DIABWyyP |
— |
| FY Final Consolidated |
PERWTyyF |
FAMWTyyF, FAMWTyyC |
| SAQ Supplement |
SAQWTyyF |
— |
| DCS Supplement |
DIABWyyF |
— |
| Longitudinal |
LONGWT |
— |
Return
to Table of Contents
Return
to Table of Contents
Return to Table
of Contents
7.0 References
Botman S.L., Moore T.F., Moriarity C.L.,
Parsons V.L. Design and Estimation for the National Health Interview Survey,
1995–2004. National Center for Health Statistics. Vital Health Stat 2(130).
2000.
Ezzati-Rice, T.M., Rohde, F., Greenblatt,
J., (2008). Sample Design of the Medical Expenditure Panel Survey Household
Component, 1998–2007.
Methodology Report No. 22. March 2008. Agency for Healthcare Research and Quality,
Rockville,
MD. http://www.meps.ahrq.gov/mepsweb/data_files/publications/mr22/mr22.pdf
Kass. G. V. (1980). “An Exploratory Technique for Investigating Large
Quantities of Categorical Data.” Journal of Applied Statistics, Vol.
29, No. 2 (1980), pp. 119–127.
Korn E. and Graubard B. (1999). Analysis of Health Surveys. John Wiley and
Sons Inc. New York.
Shao, J. (1996). “Resampling Methods in Sample Surveys (with discussion).” Statistics,
27, 203–254.
Wolter, K.M. (2007). Introduction to Variance Estimation. 2nd Edition.
New York: Springer-Verlag.
Return to Table
of Contents
Appendix A. Distribution of Weights at Different Stages of Weighting for 2007
MEPS
| Panel/Year |
Weight |
PUF Variable |
Number of Records |
Sum of Weights |
Minimum Weight |
Median Weight |
Average Weight |
Maximum Weight |
CV Weights (%) |
| Panel 12, 2007 |
DU Final Weight |
- |
5,525 |
116,942,394 |
4,406 |
20,345 |
21,166 |
116,377 |
48.6 |
| Round 1 Family Weight |
- |
5,736 |
129,215,974 |
4,266 |
20,491 |
22,527 |
104,048 |
54.0 |
| Round 1 Person Weight |
- |
14,819 |
296,056,836 |
3,152 |
17,823 |
19,978 |
106,987 |
58.9 |
| Panel 11, 2007 |
Round 3 Person Weight |
- |
17,008 |
296,056,836 |
679 |
15,183 |
17,407 |
118,825 |
69.1 |
| Round 3 Family Weight |
- |
6,680 |
129,215,974 |
1,036 |
17,208 |
19,344 |
109,389 |
66.2 |
| Panels 11 & 12 Combined, 2007 |
PIT Person Weight |
WGTSP13 |
31,827 |
296,056,836 |
329 |
8,170 |
9,302 |
63,811 |
65.3 |
| PIT Family Weight |
WGTRU13 |
12,416 |
129,215,974 |
417 |
9,296 |
10,407 |
57,102 |
62.2 |
| Panel 12, 2007 |
FY Person Weight* |
- |
13,015 |
301,170,737 |
2,338 |
20,447 |
23,140 |
131,419 |
60.5 |
| Panel 11, 2007 |
FY Person Weight* |
- |
16,355 |
300,972,329 |
1,154 |
16,032 |
18,402 |
120,178 |
68.8 |
| Panels 11 & 12 Combined, 2007 |
FY Person Weight (Preliminary) |
PERWT07P |
29,370 |
301,309,149 |
651 |
8,994 |
10,259 |
67,646 |
65.4 |
| FY Person Weight (Final) |
PERWT07F |
29,370 |
301,309,149 |
550 |
8,902 |
10,259 |
67,154 |
67.7 |
| FY Family Weight (CPS) |
FAMWT07C |
11,873 |
130,346,831 |
540 |
9,644 |
10,978 |
61,163 |
65.1 |
| FY Family Weight (MEPS) |
FAMWT07F |
11,615 |
127,885,890 |
540 |
9,682 |
11,010 |
61,163 |
64.9 |
| Panel 11, 2006-07 |
Longitudinal Weight |
LONGWT |
16,533 |
304,831,607 |
958 |
15,908 |
18,438 |
120,341 |
71.0 |
| *The weight distributions for these
weights do not reflect the special weight adjustments applied to persons
not in-scope on December 31 (i.e., for decedents and nursing home entrants). |
Return
to Table of Contents
Return to Table
of Contents
Appendix C. Glossary of Selected Terms
Return to Table
of Contents
---------------------------
Return to Table of Contents
Suggested Citation:
Machlin S.R., Chowdhury S.R., Ezzati-Rice T., DiGaetano R., Goksel H.,
Wun L.-M., Yu W., Kashihara D. Estimation Procedures for the Medical
Expenditure Panel Survey Household Component. Methodology Report #24.
September 2010. Agency for Healthcare Research and Quality, Rockville,
MD. http://www.meps.ahrq.gov/mepsweb/data_files/publications/mr24/mr24.shtml
|