
|
|
|
Font Size:
|
||||
|
|
|
|
||||
Chartbook #26: MEPS Insurance Component Presentation 2021
Source: Medical Expenditure Panel Survey-Insurance Component, private-sector establishments, 2009-2021.
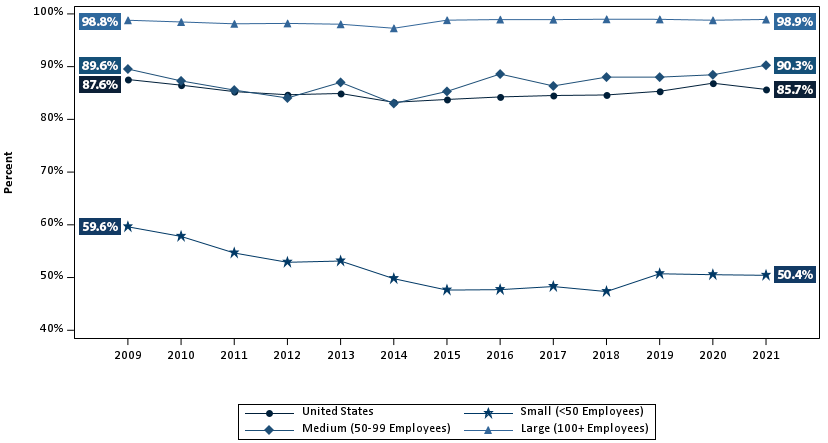
Exhibit ES.1: Percentage (standard error) of private-sector employees in establishments that offer health insurance, by firm size, 2009-2021
TABLE SUMMARY
| Number of Employees | 2009 | 2010 | 2011 | 2012 | 2013 | 2014 | 2015 | 2016 | 2017 | 2018 | 2019 | 2020 | 2021 |
|---|---|---|---|---|---|---|---|---|---|---|---|---|---|
| U.S. | 87.6% | 86.5% | 85.3% | 84.7% | 84.9% | 83.2% | 83.8% | 84.3% | 84.5% | 84.6% | 85.3% | 86.9% | 85.7% |
| (Standard Error) | (0.2%) | (0.2%) | (0.2%) | (0.3%) | (0.3%) | (0.3%) | (0.2%) | (0.2%) | (0.2%) | (0.2%) | (0.2%) | (0.2%) | (0.3%) |
| <50 | 59.6% | 57.8% | 54.7% | 52.9% | 53.1% | 49.8% | 47.6% | 47.7% | 48.3% | 47.3% | 50.7% | 50.5% | 50.4% |
| (Standard Error) | (0.5%) | (0.5%) | (0.4%) | (0.6%) | (0.7%) | (0.6%) | (0.6%) | (0.6%) | (0.6%) | (0.6%) | (0.7%) | (0.7%) | (0.7%) |
| 50–99 | 89.6% | 87.3% | 85.6% | 84.1% | 87.0% | 83.0% | 85.3% | 88.6% | 86.3% | 88.0% | 88.0% | 88.5% | 90.3% |
| (Standard Error) | (1.3%) | (0.9%) | (1.0%) | (1.4%) | (1.0%) | (1.3%) | (1.2%) | (1.0%) | (1.2%) | (1.1%) | (1.1%) | (1.2%) | (1.2%) |
| 100+ | 98.8% | 98.5% | 98.1% | 98.2% | 98.0% | 97.3% | 98.8% | 98.9% | 98.9% | 99.0% | 99.0% | 98.8% | 98.9% |
| (Standard Error) | (0.1%) | (0.2%) | (0.2%) | (0.2%) | (0.2%) | (0.2%) | (0.2%) | (0.1%) | (0.2%) | (0.2%) | (0.1%) | (0.2%) | (0.2%) |
Source: Medical Expenditure Panel Survey-Insurance Component, private-sector establishments, 2009-2021.
Source: Medical Expenditure Panel Survey-Insurance Component, private-sector establishments, 2019-2021.
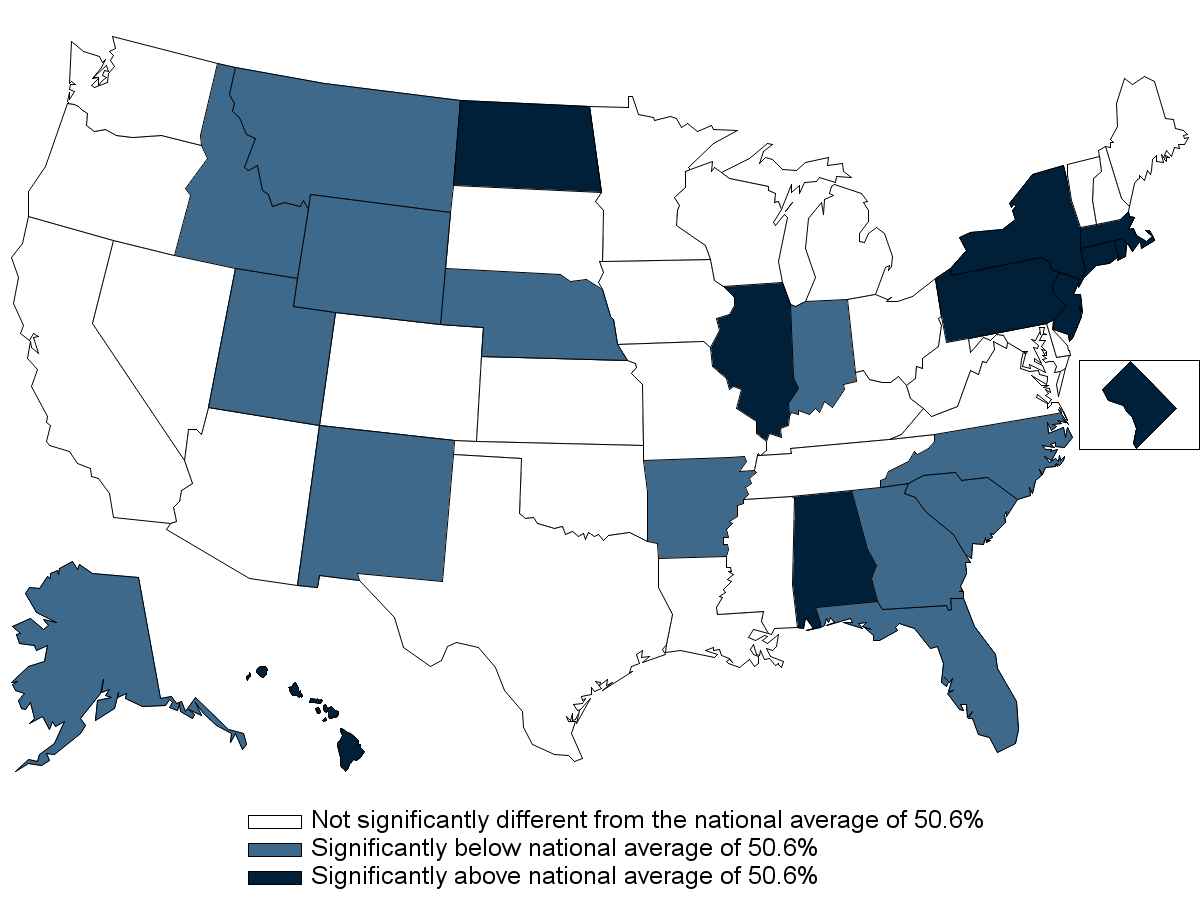
Note: * Statistically different from the national average of 50.6 percent at p < 0.05. Note that the standard error on the national estimate of 50.6 percent is 0.41 percent.
Exhibit ES.2: Percentage (standard error) of private-sector employees in establishments that offer health insurance, by State, firm size <50 employees, 3-year average, 2019-2021
TABLE SUMMARY
| Alabama | 56.5%* | Kentucky | 47.8% | North Dakota | 56.7%* |
| (Standard Error) | (2.5%) | (Standard Error) | (2.8%) | (Standard Error) | (2.3%) |
| Alaska | 33.7%* | Louisiana | 47.1% | Ohio | 51.5% |
| (Standard Error) | (2.4%) | (Standard Error) | (2.9%) | (Standard Error) | (2.6%) |
| Arizona | 45.4% | Maine | 47.1% | Oklahoma | 55.4% |
| (Standard Error) | (2.9%) | (Standard Error) | (2.3%) | (Standard Error) | (2.4%) |
| Arkansas | 40.3%* | Maryland | 55.6% | Oregon | 48.7% |
| (Standard Error) | (2.7%) | (Standard Error) | (2.6%) | (Standard Error) | (2.2%) |
| California | 52.4% | Massachusetts | 62.3%* | Pennsylvania | 57.2%* |
| (Standard Error) | (1.6%) | (Standard Error) | (2.6%) | (Standard Error) | (2.1%) |
| Colorado | 49.5% | Michigan | 49.8% | Rhode Island | 59.1%* |
| (Standard Error) | (2.5%) | (Standard Error) | (2.4%) | (Standard Error) | (2.7%) |
| Connecticut | 58.6%* | Minnesota | 48.7% | South Carolina | 41.7%* |
| (Standard Error) | (2.5%) | (Standard Error) | (2.5%) | (Standard Error) | (2.7%) |
| Delaware | 49.9% | Mississippi | 49.6% | South Dakota | 49.1% |
| (Standard Error) | (2.9%) | (Standard Error) | (2.7%) | (Standard Error) | (2.2%) |
| District of Columbia | 73.1%* | Missouri | 52.0% | Tennessee | 46.9% |
| (Standard Error) | (2.6%) | (Standard Error) | (2.4%) | (Standard Error) | (2.6%) |
| Florida | 41.4%* | Montana | 41.6%* | Texas | 47.6% |
| (Standard Error) | (2.2%) | (Standard Error) | (2.2%) | (Standard Error) | (1.7%) |
| Georgia | 42.9%* | Nebraska | 45.2%* | Utah | 42.6%* |
| (Standard Error) | (2.8%) | (Standard Error) | (2.5%) | (Standard Error) | (2.5%) |
| Hawaii | 90.6%* | Nevada | 51.4% | Vermont | 49.8% |
| (Standard Error) | (1.3%) | (Standard Error) | (2.9%) | (Standard Error) | (2.1%) |
| Idaho | 41.3%* | New Hampshire | 53.7% | Virginia | 53.1% |
| (Standard Error) | (2.4%) | (Standard Error) | (2.6%) | (Standard Error) | (2.6%) |
| Illinois | 57.1%* | New Jersey | 59.4%* | Washington | 50.6% |
| (Standard Error) | (1.8%) | (Standard Error) | (2.5%) | (Standard Error) | (2.4%) |
| Indiana | 42.7%* | New Mexico | 42.2%* | West Virginia | 46.1% |
| (Standard Error) | (2.5%) | (Standard Error) | (2.5%) | (Standard Error) | (2.8%) |
| Iowa | 52.3% | New York | 55.7%* | Wisconsin | 47.3% |
| (Standard Error) | (2.3%) | (Standard Error) | (1.6%) | (Standard Error) | (2.4%) |
| Kansas | 55.2% | North Carolina | 42.5%* | Wyoming | 38.6%* |
| (Standard Error) | (2.4%) | (Standard Error) | (2.5%) | (Standard Error) | (2.2%) |
Source: Medical Expenditure Panel Survey-Insurance Component, private-sector establishments, 2019-2021.
Note: * Statistically different from the national average of 50.6 percent at p < 0.05. Note that the standard error on the national estimate of 50.6 percent is 0.41 percent.
Source: Medical Expenditure Panel Survey-Insurance Component, private-sector establishments, 2009-2021.
Denominator: Within each category, all employees in establishments that offer health insurance.
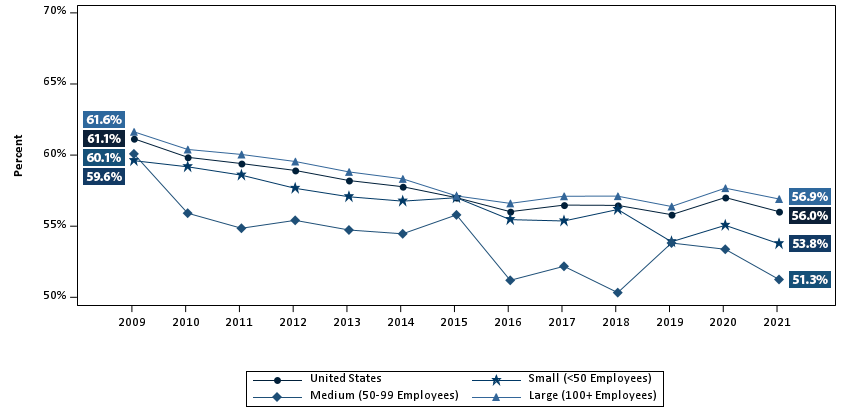
Exhibit ES.3: Coverage Rate Percentage (standard error) of private-sector employees who are enrolled in health insurance at establishments that offer health insurance, overall and by firm size, 2009-2021
TABLE SUMMARY
| Number of Employees | 2009 | 2010 | 2011 | 2012 | 2013 | 2014 | 2015 | 2016 | 2017 | 2018 | 2019 | 2020 | 2021 |
|---|---|---|---|---|---|---|---|---|---|---|---|---|---|
| U.S. | 61.1% | 59.8% | 59.4% | 58.9% | 58.2% | 57.8% | 57.0% | 56.0% | 56.5% | 56.5% | 55.8% | 57.0% | 56.0% |
| (Standard Error) | (0.4%) | (0.5%) | (0.2%) | (0.4%) | (0.3%) | (0.4%) | (0.4%) | (0.4%) | (0.4%) | (0.4%) | (0.5%) | (0.4%) | (0.4%) |
| <50 | 59.6% | 59.2% | 58.6% | 57.7% | 57.1% | 56.8% | 57.0% | 55.5% | 55.4% | 56.2% | 53.9% | 55.1% | 53.8% |
| (Standard Error) | (0.4%) | (0.6%) | (0.5%) | (0.5%) | (0.5%) | (0.6%) | (0.6%) | (0.6%) | (0.6%) | (0.6%) | (0.6%) | (0.7%) | (0.7%) |
| 50–99 | 60.1% | 55.9% | 54.9% | 55.4% | 54.7% | 54.5% | 55.8% | 51.2% | 52.2% | 50.3% | 53.8% | 53.4% | 51.3% |
| (Standard Error) | (1.0%) | (0.8%) | (1.0%) | (1.2%) | (0.8%) | (1.3%) | (1.2%) | (1.2%) | (1.2%) | (1.2%) | (1.2%) | (1.3%) | (1.3%) |
| 100+ | 61.6% | 60.4% | 60.0% | 59.5% | 58.8% | 58.3% | 57.1% | 56.6% | 57.1% | 57.1% | 56.4% | 57.7% | 56.9% |
| (Standard Error) | (0.6%) | (0.6%) | (0.3%) | (0.4%) | (0.3%) | (0.5%) | (0.5%) | (0.5%) | (0.5%) | (0.5%) | (0.6%) | (0.5%) | (0.5%) |
Source: Medical Expenditure Panel Survey-Insurance Component, private-sector establishments, 2009-2021.
Note: Within each category, all employees in establishments that offer health insurance.
Source: Medical Expenditure Panel Survey-Insurance Component, private-sector establishments, 2009-2021.
Denominator: Within each category, all employees in establishments that offer health insurance.
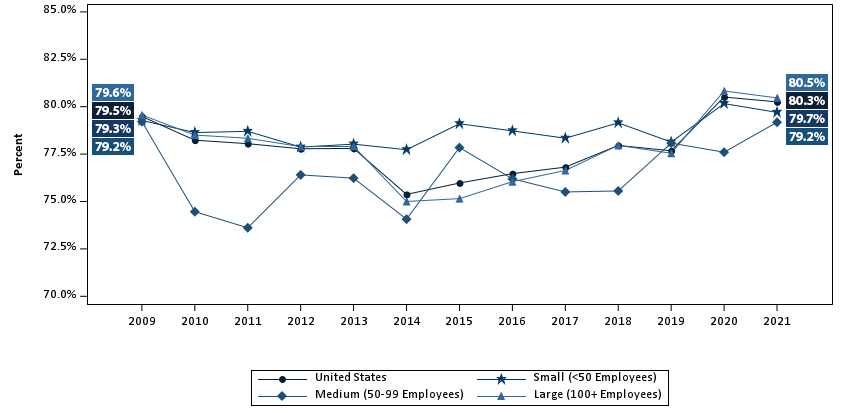
Exhibit ES.4: Eligibility Rate Percentage (standard error) of private-sector employees eligible for health insurance at establishments that offer health insurance, overall and by firm size, 2009-2021
TABLE SUMMARY
| Number of Employees | 2009 | 2010 | 2011 | 2012 | 2013 | 2014 | 2015 | 2016 | 2017 | 2018 | 2019 | 2020 | 2021 |
|---|---|---|---|---|---|---|---|---|---|---|---|---|---|
| U.S. | 79.5% | 78.2% | 78.0% | 77.8% | 77.8% | 75.4% | 76.0% | 76.5% | 76.8% | 78.0% | 77.7% | 80.5% | 80.3% |
| (Standard Error) | (0.3%) | (0.5%) | (0.4%) | (0.3%) | (0.2%) | (0.4%) | (0.4%) | (0.4%) | (0.4%) | (0.4%) | (0.4%) | (0.4%) | (0.4%) |
| <50 | 79.3% | 78.6% | 78.7% | 77.9% | 78.0% | 77.7% | 79.1% | 78.7% | 78.3% | 79.1% | 78.1% | 80.2% | 79.7% |
| (Standard Error) | (0.5%) | (0.5%) | (0.6%) | (0.5%) | (0.4%) | (0.6%) | (0.6%) | (0.6%) | (0.6%) | (0.6%) | (0.6%) | (0.6%) | (0.6%) |
| 50–99 | 79.2% | 74.5% | 73.6% | 76.4% | 76.2% | 74.1% | 77.8% | 76.2% | 75.5% | 75.6% | 78.1% | 77.6% | 79.2% |
| (Standard Error) | (0.8%) | (0.6%) | (1.0%) | (1.2%) | (0.8%) | (1.4%) | (1.2%) | (1.2%) | (1.2%) | (1.2%) | (1.2%) | (1.4%) | (1.3%) |
| 100+ | 79.6% | 78.5% | 78.3% | 77.9% | 77.9% | 75.0% | 75.2% | 76.0% | 76.6% | 78.0% | 77.5% | 80.8% | 80.5% |
| (Standard Error) | (0.5%) | (0.6%) | (0.4%) | (0.3%) | (0.3%) | (0.5%) | (0.5%) | (0.4%) | (0.5%) | (0.5%) | (0.5%) | (0.5%) | (0.4%) |
Source: Medical Expenditure Panel Survey-Insurance Component, private-sector establishments, 2009-2021.
Denominator: Within each category, all employees in establishments that offer health insurance.
Source: Medical Expenditure Panel Survey-Insurance Component, private-sector establishments, 2009-2021.
Denominator: Within each category, all employees in establishments that offer health insurance.
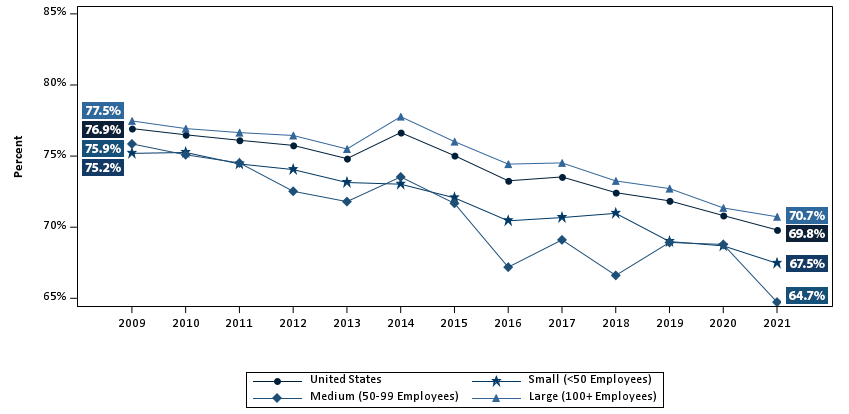
Exhibit ES.5: Take-Up Rate Percentage (standard error) of eligible private-sector employees who are enrolled in health insurance at establishments that offer health insurance, overall and by firm size, 2009-2021
TABLE SUMMARY
| Number of Employees | 2009 | 2010 | 2011 | 2012 | 2013 | 2014 | 2015 | 2016 | 2017 | 2018 | 2019 | 2020 | 2021 |
|---|---|---|---|---|---|---|---|---|---|---|---|---|---|
| U.S. | 76.9% | 76.5% | 76.1% | 75.8% | 74.8% | 76.7% | 75.0% | 73.3% | 73.5% | 72.4% | 71.9% | 70.8% | 69.8% |
| (Standard Error) | (0.3%) | (0.2%) | (0.3%) | (0.3%) | (0.2%) | (0.3%) | (0.3%) | (0.3%) | (0.3%) | (0.4%) | (0.4%) | (0.4%) | (0.4%) |
| <50 | 75.2% | 75.3% | 74.4% | 74.1% | 73.1% | 73.0% | 72.1% | 70.4% | 70.7% | 71.0% | 69.0% | 68.7% | 67.5% |
| (Standard Error) | (0.3%) | (0.6%) | (0.4%) | (0.4%) | (0.6%) | (0.5%) | (0.5%) | (0.5%) | (0.6%) | (0.6%) | (0.6%) | (0.6%) | (0.7%) |
| 50–99 | 75.9% | 75.1% | 74.5% | 72.5% | 71.8% | 73.5% | 71.7% | 67.2% | 69.1% | 66.6% | 68.9% | 68.8% | 64.7% |
| (Standard Error) | (0.9%) | (0.7%) | (0.6%) | (0.8%) | (1.0%) | (1.0%) | (1.1%) | (1.2%) | (1.1%) | (1.1%) | (1.0%) | (1.0%) | (1.2%) |
| 100+ | 77.5% | 76.9% | 76.7% | 76.4% | 75.5% | 77.8% | 76.0% | 74.4% | 74.5% | 73.3% | 72.7% | 71.4% | 70.7% |
| (Standard Error) | (0.5%) | (0.3%) | (0.3%) | (0.4%) | (0.3%) | (0.3%) | (0.3%) | (0.4%) | (0.4%) | (0.4%) | (0.5%) | (0.4%) | (0.5%) |
Source: Medical Expenditure Panel Survey-Insurance Component, private-sector establishments, 2009-2021.
Denominator: Within each category, all employees in establishments that offer health insurance.
Source: Medical Expenditure Panel Survey-Insurance Component, private-sector establishments, 2009-2021.
Denominator: Within each category, all employees in establishments that offer health insurance.
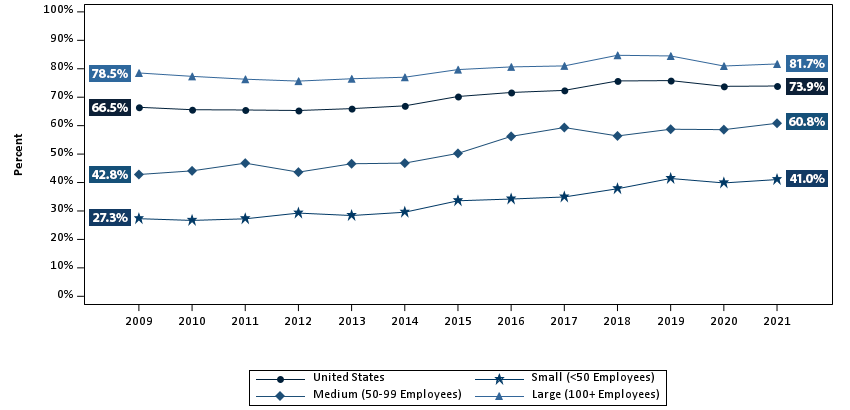
Exhibit ES.6: Percentage (standard error) of private-sector employees working in establishments that offer two or more health insurance plans, overall and by firm size, 2009-2021
TABLE SUMMARY
| Number of Employees | 2009 | 2010 | 2011 | 2012 | 2013 | 2014 | 2015 | 2016 | 2017 | 2018 | 2019 | 2020 | 2021 |
|---|---|---|---|---|---|---|---|---|---|---|---|---|---|
| U.S. | 66.5% | 65.6% | 65.5% | 65.3% | 66.0% | 67.0% | 70.2% | 71.7% | 72.4% | 75.7% | 75.8% | 73.8% | 73.9% |
| (Standard Error) | (0.7%) | (0.8%) | (0.5%) | (0.7%) | (0.6%) | (0.6%) | (0.5%) | (0.5%) | (0.5%) | (0.5%) | (0.5%) | (0.6%) | (0.6%) |
| <50 | 27.3% | 26.7% | 27.2% | 29.3% | 28.4% | 29.6% | 33.6% | 34.2% | 34.9% | 37.8% | 41.4% | 39.9% | 41.0% |
| (Standard Error) | (0.9%) | (0.8%) | (0.9%) | (0.8%) | (1.0%) | (0.9%) | (1.1%) | (1.0%) | (1.0%) | (1.0%) | (1.1%) | (1.1%) | (1.1%) |
| 50–99 | 42.8% | 44.1% | 46.8% | 43.7% | 46.6% | 46.8% | 50.2% | 56.2% | 59.3% | 56.4% | 58.7% | 58.6% | 60.8% |
| (Standard Error) | (2.0%) | (1.9%) | (2.2%) | (1.7%) | (2.2%) | (2.1%) | (2.2%) | (2.0%) | (1.9%) | (1.9%) | (2.0%) | (2.1%) | (2.2%) |
| 100+ | 78.5% | 77.3% | 76.3% | 75.7% | 76.5% | 77.0% | 79.7% | 80.7% | 81.0% | 84.7% | 84.5% | 81.0% | 81.7% |
| (Standard Error) | (0.7%) | (1.0%) | (0.7%) | (0.7%) | (0.7%) | (0.6%) | (0.6%) | (0.6%) | (0.6%) | (0.5%) | (0.6%) | (0.6%) | (0.6%) |
Source: Medical Expenditure Panel Survey-Insurance Component, private-sector establishments, 2009-2021.
Denominator: Within each category, all employees in establishments that offer health insurance.
Source: Medical Expenditure Panel Survey-Insurance Component, private-sector establishments, 2009-2021.
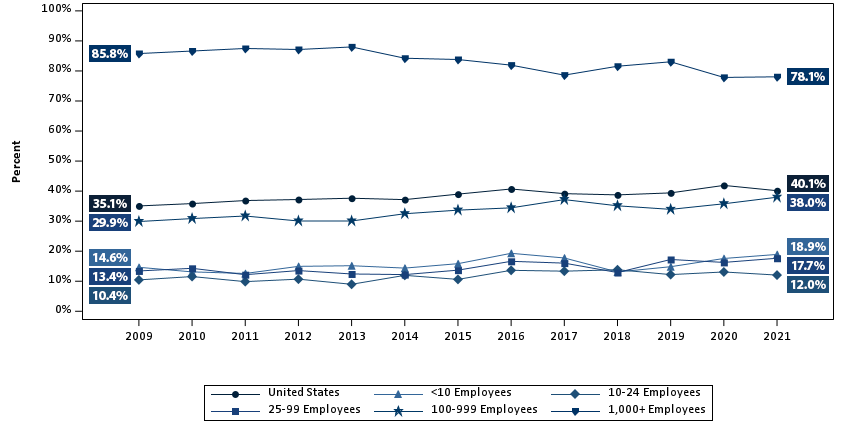
Exhibit ES.7: Percentage (standard error) of private-sector establishments that offer health insurance that self-insure at least one plan, overall and by detailed firm size, 2009-2021
TABLE SUMMARY
| Number of Employees | 2009 | 2010 | 2011 | 2012 | 2013 | 2014 | 2015 | 2016 | 2017 | 2018 | 2019 | 2020 | 2021 |
|---|---|---|---|---|---|---|---|---|---|---|---|---|---|
| U.S. | 35.1% | 35.8% | 36.9% | 37.2% | 37.6% | 37.2% | 39.0% | 40.7% | 39.2% | 38.7% | 39.4% | 41.9% | 40.1% |
| (Standard Error) | (0.4%) | (0.5%) | (0.5%) | (0.5%) | (0.5%) | (0.5%) | (0.5%) | (0.6%) | (0.6%) | (0.6%) | (0.6%) | (0.7%) | (0.7%) |
| <10 | 14.6% | 13.1% | 12.6% | 14.9% | 15.2% | 14.4% | 15.8% | 19.3% | 17.7% | 13.1% | 14.8% | 17.6% | 18.9% |
| (Standard Error) | (0.7%) | (0.5%) | (0.8%) | (0.9%) | (0.4%) | (0.8%) | (1.0%) | (1.4%) | (1.4%) | (1.1%) | (1.3%) | (1.7%) | (1.7%) |
| 10–24 | 10.4% | 11.6% | 9.9% | 10.7% | 9.0% | 12.0% | 10.6% | 13.6% | 13.3% | 13.8% | 12.2% | 13.1% | 12.0% |
| (Standard Error) | (0.4%) | (0.8%) | (0.7%) | (0.7%) | (0.7%) | (1.0%) | (1.0%) | (1.1%) | (1.2%) | (1.2%) | (1.1%) | (1.2%) | (1.0%) |
| 25–99 | 13.4% | 14.3% | 12.2% | 13.5% | 12.4% | 12.2% | 13.7% | 16.6% | 16.0% | 12.9% | 17.2% | 16.3% | 17.7% |
| (Standard Error) | (0.7%) | (0.7%) | (0.7%) | (0.7%) | (0.7%) | (0.8%) | (0.9%) | (0.9%) | (0.9%) | (0.8%) | (0.9%) | (0.9%) | (1.0%) |
| 100–999 | 29.9% | 30.9% | 31.7% | 30.1% | 30.1% | 32.5% | 33.7% | 34.4% | 37.2% | 35.1% | 33.9% | 35.8% | 38.0% |
| (Standard Error) | (0.7%) | (0.9%) | (1.1%) | (0.8%) | (1.0%) | (1.2%) | (1.2%) | (1.2%) | (1.3%) | (1.2%) | (1.1%) | (1.2%) | (1.3%) |
| 1,000+ | 85.8% | 86.6% | 87.5% | 87.1% | 88.0% | 84.2% | 83.8% | 81.9% | 78.6% | 81.6% | 83.1% | 77.8% | 78.1% |
| (Standard Error) | (0.4%) | (0.6%) | (0.5%) | (0.7%) | (0.5%) | (0.8%) | (0.8%) | (0.8%) | (0.8%) | (0.8%) | (0.8%) | (0.9%) | (0.9%) |
Source: Medical Expenditure Panel Survey-Insurance Component, private-sector establishments, 2009-2021.
Source: Medical Expenditure Panel Survey-Insurance Component, private-sector establishments, 2009-2021.
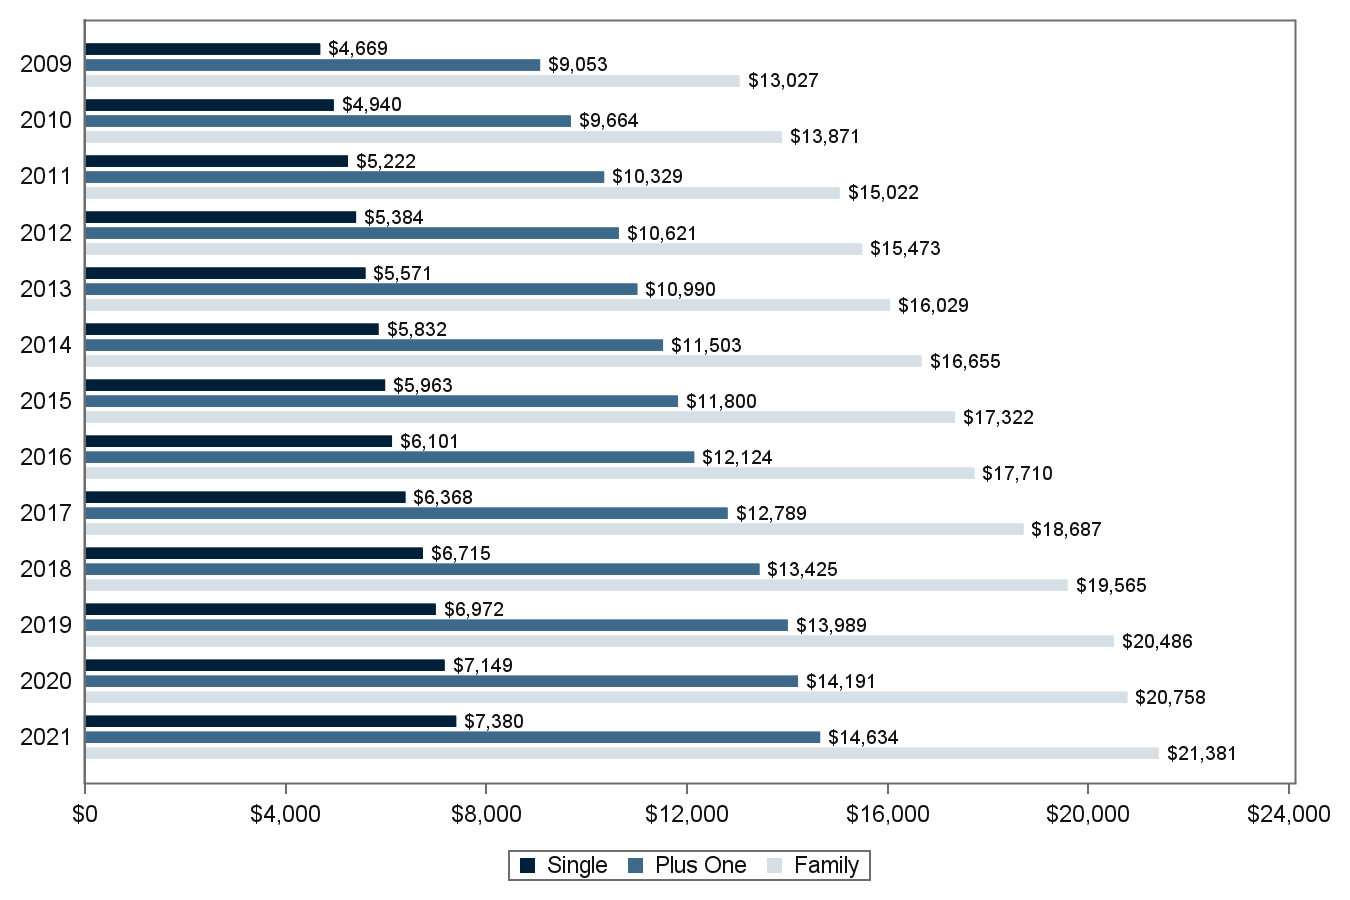
Exhibit ES.8: Average total premiums (standard error) per enrolled employee for single, employee-plus-one and family coverage, 2009-2021
TABLE SUMMARY
| Coverage | 2009 | 2010 | 2011 | 2012 | 2013 | 2014 | 2015 | 2016 | 2017 | 2018 | 2019 | 2020 | 2021 |
|---|---|---|---|---|---|---|---|---|---|---|---|---|---|
| Single | $4,669 | $4,940 | $5,222 | $5,384 | $5,571 | $5,832 | $5,963 | $6,101 | $6,368 | $6,715 | $6,972 | $7,149 | $7,380 |
| (Standard Error) | ($21) | ($22) | ($26) | ($28) | ($23) | ($25) | ($26) | ($27) | ($28) | ($31) | ($35) | ($35) | ($37) |
| Plus One | $9,053 | $9,664 | $10,329 | $10,621 | $10,990 | $11,503 | $11,800 | $12,124 | $12,789 | $13,425 | $13,989 | $14,191 | $14,634 |
| (Standard Error) | ($34) | ($60) | ($105) | ($56) | ($54) | ($60) | ($58) | ($60) | ($70) | ($70) | ($83) | ($93) | ($84) |
| Family | $13,027 | $13,871 | $15,022 | $15,473 | $16,029 | $16,655 | $17,322 | $17,710 | $18,687 | $19,565 | $20,486 | $20,758 | $21,381 |
| (Standard Error) | ($25) | ($75) | ($98) | ($95) | ($61) | ($79) | ($95) | ($84) | ($105) | ($104) | ($125) | ($124) | ($111) |
Source: Medical Expenditure Panel Survey-Insurance Component, private-sector establishments, 2009-2021.
Source: Medical Expenditure Panel Survey-Insurance Component, private-sector establishments, 2009-2021.
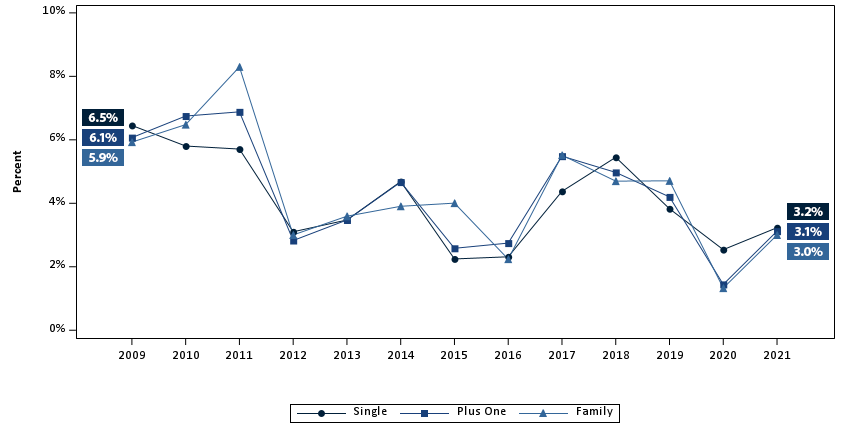
Exhibit ES.9: Percentage change (standard error) in total premiums from previous year per enrolled employee for single, employee-plus-one, and family coverage, 2009-2021
TABLE SUMMARY
| Year | Single | Employee-Plus-One | Family |
|---|---|---|---|
| 2009 | 6.5% | 6.1% | 5.9% |
| (Standard Error) | (0.6%) | (0.7%) | (0.7%) |
| 2010 | 5.8% | 6.7% | 6.5% |
| (Standard Error) | (0.7%) | (0.8%) | (0.6%) |
| 2011 | 5.7% | 6.9% | 8.3% |
| (Standard Error) | (0.7%) | (1.3%) | (0.9%) |
| 2012 | 3.1% | 2.8% | 3.0% |
| (Standard Error) | (0.7%) | (1.2%) | (0.9%) |
| 2013 | 3.5% | 3.5% | 3.6% |
| (Standard Error) | (0.7%) | (0.7%) | (0.7%) |
| 2014 | 4.7% | 4.7% | 3.9% |
| (Standard Error) | (0.6%) | (0.7%) | (0.6%) |
| 2015 | 2.2% | 2.6% | 4.0% |
| (Standard Error) | (0.6%) | (0.7%) | (0.8%) |
| 2016 | 2.3% | 2.7% | 2.2% |
| (Standard Error) | (0.6%) | (0.7%) | (0.7%) |
| 2017 | 4.4% | 5.5% | 5.5% |
| (Standard Error) | (0.7%) | (0.8%) | (0.8%) |
| 2018 | 5.4% | 5.0% | 4.7% |
| (Standard Error) | (0.7%) | (0.8%) | (0.8%) |
| 2019 | 3.8% | 4.2% | 4.7% |
| (Standard Error) | (0.7%) | (0.8%) | (0.8%) |
| 2020 | 2.5% | 1.4% | 1.3% |
| (Standard Error) | (0.7%) | (0.9%) | (0.9%) |
| 2021 | 3.2% | 3.1% | 3.0% |
| (Standard Error) | (0.7%) | (0.9%) | (0.8%) |
Source: Medical Expenditure Panel Survey-Insurance Component, private-sector establishments, 2009-2021.
Source: Medical Expenditure Panel Survey-Insurance Component, private-sector establishments, 2009-2021.
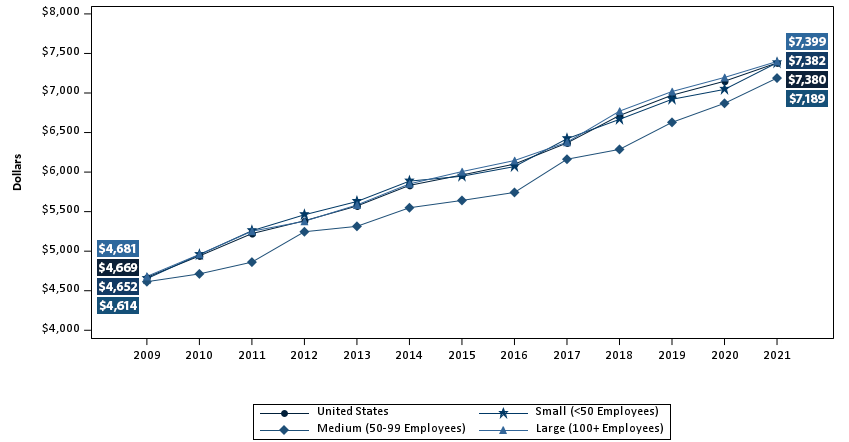
Exhibit ES.10: Average total single premium (standard error) per enrolled employee, by firm size, 2009-2021
TABLE SUMMARY
| Number of Employees | 2009 | 2010 | 2011 | 2012 | 2013 | 2014 | 2015 | 2016 | 2017 | 2018 | 2019 | 2020 | 2021 |
|---|---|---|---|---|---|---|---|---|---|---|---|---|---|
| U.S. | $4,669 | $4,940 | $5,222 | $5,384 | $5,571 | $5,832 | $5,963 | $6,101 | $6,368 | $6,715 | $6,972 | $7,149 | $7,380 |
| (Standard Error) | ($21) | ($22) | ($26) | ($28) | ($23) | ($25) | ($26) | ($27) | ($28) | ($31) | ($35) | ($35) | ($37) |
| <50 | $4,652 | $4,956 | $5,258 | $5,460 | $5,628 | $5,886 | $5,947 | $6,070 | $6,421 | $6,667 | $6,920 | $7,045 | $7,382 |
| (Standard Error) | ($31) | ($34) | ($39) | ($60) | ($39) | ($55) | ($55) | ($53) | ($61) | ($63) | ($73) | ($70) | ($84) |
| 50–99 | $4,614 | $4,713 | $4,861 | $5,246 | $5,314 | $5,549 | $5,642 | $5,743 | $6,163 | $6,287 | $6,629 | $6,870 | $7,189 |
| (Standard Error) | ($82) | ($52) | ($75) | ($39) | ($73) | ($82) | ($104) | ($96) | ($121) | ($111) | ($99) | ($129) | ($129) |
| 100+ | $4,681 | $4,959 | $5,252 | $5,378 | $5,584 | $5,851 | $6,006 | $6,146 | $6,377 | $6,770 | $7,019 | $7,197 | $7,399 |
| (Standard Error) | ($38) | ($23) | ($31) | ($28) | ($29) | ($30) | ($31) | ($32) | ($33) | ($37) | ($42) | ($41) | ($43) |
Source: Medical Expenditure Panel Survey-Insurance Component, private-sector establishments, 2009-2021.
Source: Medical Expenditure Panel Survey-Insurance Component, private-sector establishments, 2009-2021.
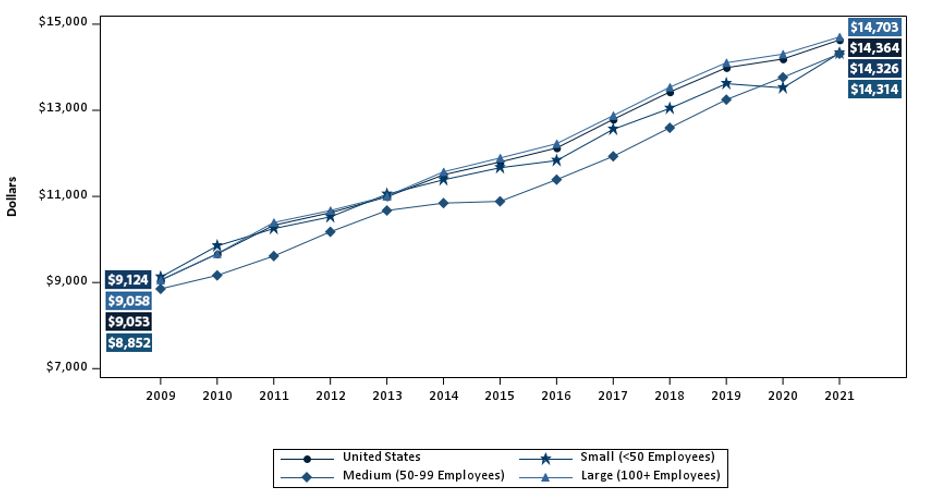
Exhibit ES.11: Average total employee-plus-one premium (standard error) per enrolled employee, by firm size, 2009-2021
TABLE SUMMARY
| Number of Employees | 2009 | 2010 | 2011 | 2012 | 2013 | 2014 | 2015 | 2016 | 2017 | 2018 | 2019 | 2020 | 2021 |
|---|---|---|---|---|---|---|---|---|---|---|---|---|---|
| U.S. | $9,053 | $9,664 | $10,329 | $10,621 | $10,990 | $11,503 | $11,800 | $12,124 | $12,789 | $13,425 | $13,989 | $14,191 | $14,634 |
| (Standard Error) | ($34) | ($60) | ($105) | ($56) | ($54) | ($60) | ($58) | ($60) | ($70) | ($70) | ($83) | ($93) | ($84) |
| <50 | $9,124 | $9,850 | $10,253 | $10,524 | $11,050 | $11,386 | $11,666 | $11,833 | $12,558 | $13,044 | $13,619 | $13,522 | $14,326 |
| (Standard Error) | ($119) | ($80) | ($104) | ($121) | ($92) | ($163) | ($158) | ($156) | ($170) | ($176) | ($248) | ($212) | ($262) |
| 50–99 | $8,852 | $9,166 | $9,615 | $10,178 | $10,673 | $10,845 | $10,885 | $11,389 | $11,931 | $12,593 | $13,248 | $13,766 | $14,314 |
| (Standard Error) | ($148) | ($124) | ($192) | ($185) | ($330) | ($187) | ($198) | ($227) | ($232) | ($236) | ($321) | ($246) | ($295) |
| 100+ | $9,058 | $9,669 | $10,394 | $10,672 | $11,006 | $11,571 | $11,892 | $12,225 | $12,878 | $13,537 | $14,105 | $14,304 | $14,703 |
| (Standard Error) | ($34) | ($62) | ($113) | ($70) | ($59) | ($68) | ($66) | ($68) | ($79) | ($79) | ($92) | ($106) | ($93) |
Source: Medical Expenditure Panel Survey-Insurance Component, private-sector establishments, 2009-2021.
Source: Medical Expenditure Panel Survey-Insurance Component, private-sector establishments, 2009-2021.
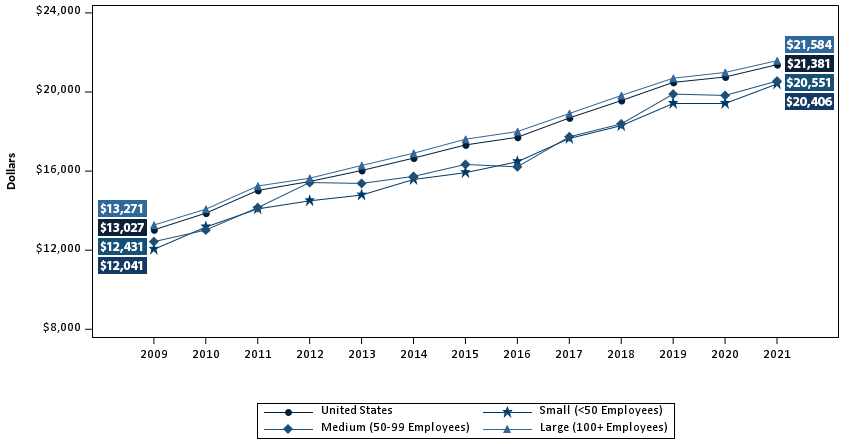
Exhibit ES.12: Average total family premium (standard error) per enrolled employee, by firm size, 2009-2021
TABLE SUMMARY
| Number of Employees | 2009 | 2010 | 2011 | 2012 | 2013 | 2014 | 2015 | 2016 | 2017 | 2018 | 2019 | 2020 | 2021 |
|---|---|---|---|---|---|---|---|---|---|---|---|---|---|
| U.S. | $13,027 | $13,871 | $15,022 | $15,473 | $16,029 | $16,655 | $17,322 | $17,710 | $18,687 | $19,565 | $20,486 | $20,758 | $21,381 |
| (Standard Error) | ($25) | ($75) | ($98) | ($95) | ($61) | ($79) | ($95) | ($84) | ($105) | ($104) | ($125) | ($124) | ($111) |
| <50 | $12,041 | $13,170 | $14,086 | $14,496 | $14,787 | $15,575 | $15,919 | $16,471 | $17,649 | $18,296 | $19,417 | $19,416 | $20,406 |
| (Standard Error) | ($129) | ($111) | ($145) | ($181) | ($89) | ($177) | ($212) | ($207) | ($192) | ($231) | ($303) | ($283) | ($320) |
| 50–99 | $12,431 | $13,019 | $14,151 | $15,421 | $15,376 | $15,732 | $16,336 | $16,214 | $17,735 | $18,386 | $19,893 | $19,827 | $20,551 |
| (Standard Error) | ($229) | ($153) | ($168) | ($273) | ($268) | ($274) | ($335) | ($348) | ($327) | ($473) | ($435) | ($422) | ($396) |
| 100+ | $13,271 | $14,074 | $15,245 | $15,641 | $16,284 | $16,903 | $17,612 | $18,000 | $18,911 | $19,824 | $20,697 | $20,990 | $21,584 |
| (Standard Error) | ($33) | ($85) | ($117) | ($114) | ($82) | ($91) | ($110) | ($95) | ($122) | ($118) | ($143) | ($139) | ($124) |
Source: Medical Expenditure Panel Survey-Insurance Component, private-sector establishments, 2009-2021.
Source: Medical Expenditure Panel Survey-Insurance Component, private-sector establishments, 2009-2021.
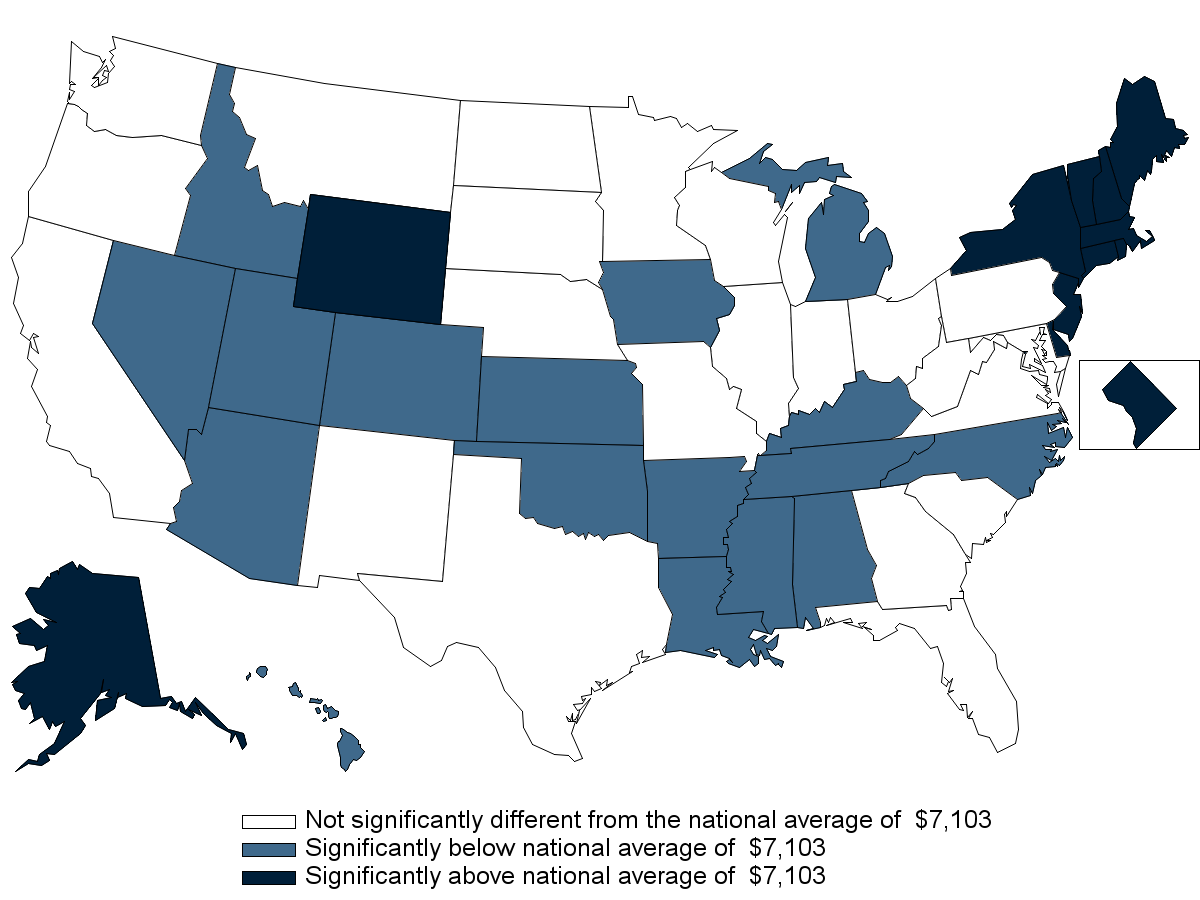
Note: Statistically different from national average of $7,103 at p < 0.05. Note that the standard error on the national estimate of $7,103 is $20.
Exhibit ES.13: Average total single premium (standard error) per enrolled employee, by State, 3-year average, 2019-2021
TABLE SUMMARY
| Alabama | $6,481* | Kentucky | $6,918* | North Dakota | $6,998* |
| (Standard Error) | ($101) | (Standard Error) | ($88) | (Standard Error) | ($86) |
| Alaska | $8,798* | Louisiana | $6,696* | Ohio | $7,030 |
| (Standard Error) | ($232) | (Standard Error) | ($98) | (Standard Error) | ($100) |
| Arizona | $6,559* | Maine | $7,467* | Oklahoma | $6,893* |
| (Standard Error) | ($92) | (Standard Error) | ($93) | (Standard Error) | ($104) |
| Arkansas | $6,220* | Maryland | $7,182 | Oregon | $6,929 |
| (Standard Error) | ($104) | (Standard Error) | ($116) | (Standard Error) | ($154) |
| California | $7,165 | Massachusetts | $7,623* | Pennsylvania | $7,218 |
| (Standard Error) | ($87) | (Standard Error) | ($101) | (Standard Error) | ($87) |
| Colorado | $6,819* | Michigan | $6,804* | Rhode Island | $7,485* |
| (Standard Error) | ($105) | (Standard Error) | ($116) | (Standard Error) | ($104) |
| Connecticut | $7,512* | Minnesota | $7,020 | South Carolina | $7,091 |
| (Standard Error) | ($113) | (Standard Error) | ($109) | (Standard Error) | ($99) |
| Delaware | $7,701* | Mississippi | $6,533* | South Dakota | $7,133 |
| (Standard Error) | ($162) | (Standard Error) | ($105) | (Standard Error) | ($80) |
| District of Columbia | $7,684* | Missouri | $7,007 | Tennessee | $6,564* |
| (Standard Error) | ($120) | (Standard Error) | ($107) | (Standard Error) | ($90) |
| Florida | $7,002 | Montana | $6,957 | Texas | $6,992 |
| (Standard Error) | ($116) | (Standard Error) | ($98) | (Standard Error) | ($74) |
| Georgia | $6,948 | Nebraska | $7,263 | Utah | $6,454* |
| (Standard Error) | ($131) | (Standard Error) | ($100) | (Standard Error) | ($103) |
| Hawaii | $6,715* | Nevada | $6,550* | Vermont | $7,676* |
| (Standard Error) | ($91) | (Standard Error) | ($122) | (Standard Error) | ($90) |
| Idaho | $6,549* | New Hampshire | $7,662* | Virginia | $6,948 |
| (Standard Error) | ($103) | (Standard Error) | ($103) | (Standard Error) | ($88) |
| Illinois | $7,244 | New Jersey | $7,531* | Washington | $7,232 |
| (Standard Error) | ($82) | (Standard Error) | ($129) | (Standard Error) | ($119) |
| Indiana | $7,238 | New Mexico | $7,165 | West Virginia | $7,287 |
| (Standard Error) | ($102) | (Standard Error) | ($105) | (Standard Error) | ($125) |
| Iowa | $6,798* | New York | $8,126* | Wisconsin | $7,107 |
| (Standard Error) | ($95) | (Standard Error) | ($93) | (Standard Error) | ($100) |
| Kansas | $6,563* | North Carolina | $6,922 | Wyoming | $7,550 |
| (Standard Error) | ($100) | (Standard Error) | ($85) | (Standard Error) | ($159) |
Source: Medical Expenditure Panel Survey-Insurance Component, private-sector establishments, 2009-2021.
Note: Statistically different from national average of $7,103 at p < 0.05. Note that the standard error on the national estimate of $7,103 is $20.
Source: Medical Expenditure Panel Survey-Insurance Component, private-sector establishments, 2009-2021.
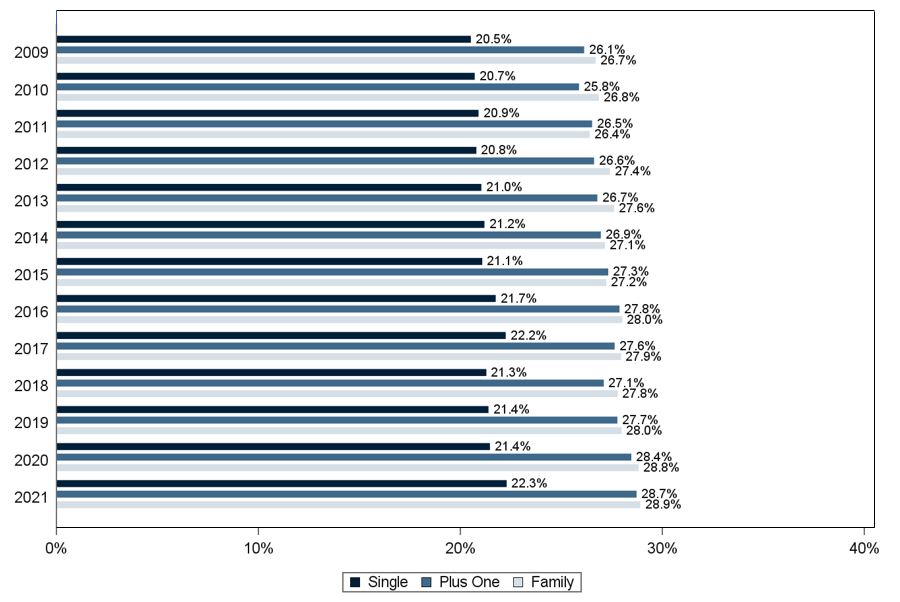
Exhibit ES.14: Average percentage (standard error) of premium contributed by employees for single, employee-plus-one, and family coverage, 2009-2021
TABLE SUMMARY
| Coverage | 2009 | 2010 | 2011 | 2012 | 2013 | 2014 | 2015 | 2016 | 2017 | 2018 | 2019 | 2020 | 2021 |
|---|---|---|---|---|---|---|---|---|---|---|---|---|---|
| Single | 20.5% | 20.7% | 20.9% | 20.8% | 21.0% | 21.2% | 21.1% | 21.7% | 22.2% | 21.3% | 21.4% | 21.4% | 22.3% |
| (Standard Error) | (0.3%) | (0.2%) | (0.2%) | (0.3%) | (0.3%) | (0.2%) | (0.2%) | (0.2%) | (0.2%) | (0.2%) | (0.3%) | (0.2%) | (0.2%) |
| Plus One | 26.1% | 25.8% | 26.5% | 26.6% | 26.7% | 26.9% | 27.3% | 27.8% | 27.6% | 27.1% | 27.7% | 28.4% | 28.7% |
| (Standard Error) | (0.3%) | (0.3%) | (0.3%) | (0.4%) | (0.2%) | (0.3%) | (0.3%) | (0.3%) | (0.3%) | (0.3%) | (0.4%) | (0.4%) | (0.4%) |
| Family | 26.7% | 26.8% | 26.4% | 27.4% | 27.6% | 27.1% | 27.2% | 28.0% | 27.9% | 27.8% | 28.0% | 28.8% | 28.9% |
| (Standard Error) | (0.3%) | (0.4%) | (0.3%) | (0.4%) | (0.3%) | (0.3%) | (0.3%) | (0.3%) | (0.4%) | (0.3%) | (0.4%) | (0.4%) | (0.4%) |
Source: Medical Expenditure Panel Survey-Insurance Component, private-sector establishments, 2009-2021.
Source: Medical Expenditure Panel Survey-Insurance Component, private-sector establishments, 2009-2021.
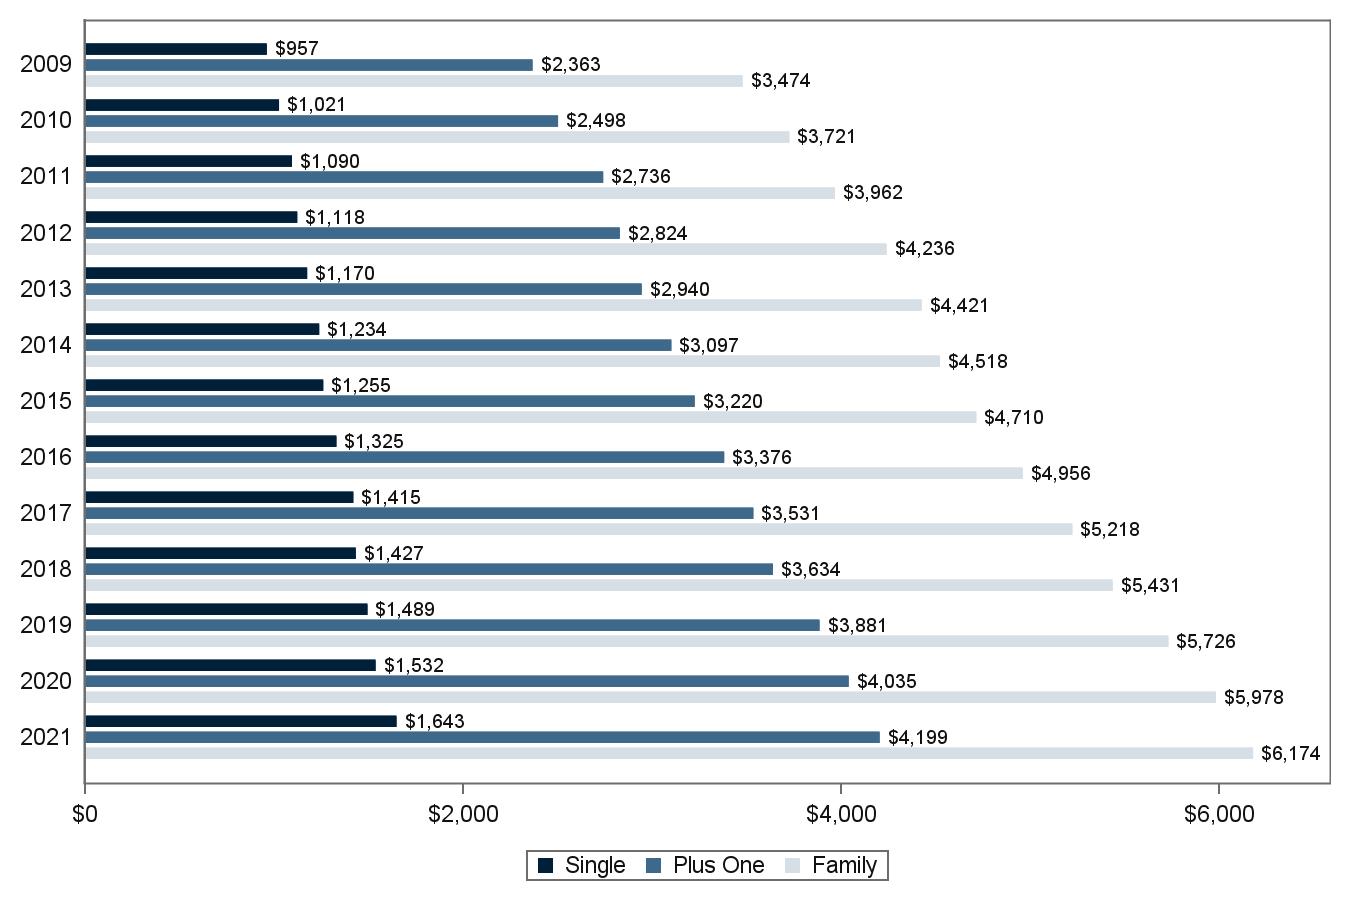
Exhibit ES.15: Average annual employee contribution (in dollars) (standard error) for single, employee-plus-one, and family coverage, 2009-2021
TABLE SUMMARY
| Coverage | 2009 | 2010 | 2011 | 2012 | 2013 | 2014 | 2015 | 2016 | 2017 | 2018 | 2019 | 2020 | 2021 |
|---|---|---|---|---|---|---|---|---|---|---|---|---|---|
| Single | $957 | $1,021 | $1,090 | $1,118 | $1,170 | $1,234 | $1,255 | $1,325 | $1,415 | $1,427 | $1,489 | $1,532 | $1,643 |
| (Standard Error) | ($13) | ($14) | ($9) | ($14) | ($16) | ($13) | ($14) | ($13) | ($15) | ($14) | ($18) | ($16) | ($19) |
| Plus One | $2,363 | $2,498 | $2,736 | $2,824 | $2,940 | $3,097 | $3,220 | $3,376 | $3,531 | $3,634 | $3,881 | $4,035 | $4,199 |
| (Standard Error) | ($27) | ($42) | ($36) | ($46) | ($23) | ($40) | ($35) | ($36) | ($39) | ($39) | ($54) | ($52) | ($64) |
| Family | $3,474 | $3,721 | $3,962 | $4,236 | $4,421 | $4,518 | $4,710 | $4,956 | $5,218 | $5,431 | $5,726 | $5,978 | $6,174 |
| (Standard Error) | ($44) | ($53) | ($42) | ($69) | ($50) | ($48) | ($56) | ($56) | ($64) | ($63) | ($82) | ($76) | ($87) |
Source: Medical Expenditure Panel Survey-Insurance Component, private-sector establishments, 2009-2021.
Source: Medical Expenditure Panel Survey-Insurance Component, private-sector establishments, 2009-2021.
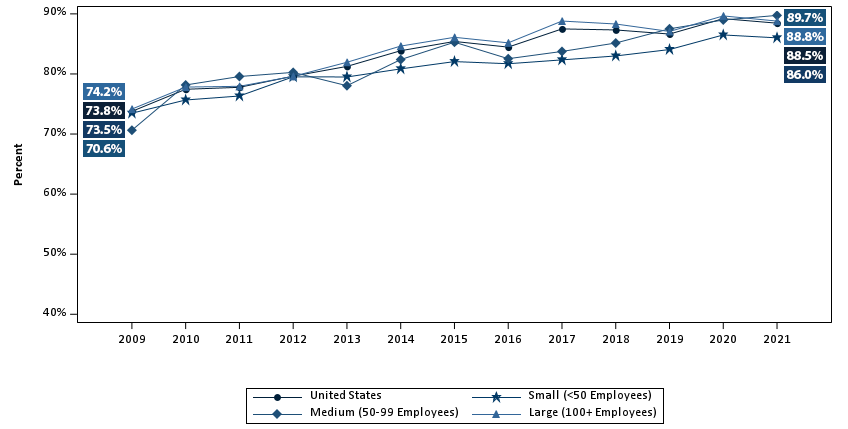
Exhibit ES.16: Percentage (standard error) of private-sector enrolled employees in a health insurance plan with a deductible, overall and by firm size, 2009-2021
TABLE SUMMARY
| Number of Employees | 2009 | 2010 | 2011 | 2012 | 2013 | 2014 | 2015 | 2016 | 2017 | 2018 | 2019 | 2020 | 2021 |
|---|---|---|---|---|---|---|---|---|---|---|---|---|---|
| U.S. | 73.8% | 77.5% | 77.8% | 79.6% | 81.3% | 83.9% | 85.4% | 84.5% | 87.5% | 87.3% | 86.6% | 89.2% | 88.5% |
| (Standard Error) | (0.5%) | (0.3%) | (0.7%) | (0.6%) | (0.7%) | (0.5%) | (0.5%) | (0.5%) | (0.4%) | (0.4%) | (0.5%) | (0.4%) | (0.5%) |
| <50 | 73.5% | 75.7% | 76.3% | 79.5% | 79.5% | 80.8% | 82.1% | 81.7% | 82.3% | 83.0% | 84.1% | 86.5% | 86.0% |
| (Standard Error) | (0.7%) | (0.7%) | (0.4%) | (1.0%) | (0.8%) | (0.8%) | (0.8%) | (0.8%) | (0.8%) | (0.8%) | (0.9%) | (0.8%) | (0.9%) |
| 50–99 | 70.6% | 78.2% | 79.6% | 80.3% | 78.0% | 82.4% | 85.3% | 82.5% | 83.7% | 85.1% | 87.5% | 89.0% | 89.7% |
| (Standard Error) | (1.9%) | (1.5%) | (1.7%) | (1.4%) | (1.1%) | (1.5%) | (1.5%) | (1.5%) | (1.6%) | (1.4%) | (1.5%) | (1.5%) | (1.3%) |
| 100+ | 74.2% | 77.8% | 77.9% | 79.6% | 81.9% | 84.6% | 86.1% | 85.2% | 88.8% | 88.3% | 87.1% | 89.7% | 88.8% |
| (Standard Error) | (0.6%) | (0.3%) | (1.0%) | (0.7%) | (0.7%) | (0.6%) | (0.6%) | (0.6%) | (0.4%) | (0.5%) | (0.5%) | (0.5%) | (0.5%) |
Source: Medical Expenditure Panel Survey-Insurance Component, private-sector establishments, 2009-2021.
Source: Medical Expenditure Panel Survey-Insurance Component, private-sector establishments, 2009-2021.
Note: In 2015, the methodology for calibrating the upper edit bound for the individual deductible amount changed, causing the average individual deductible per employee enrolled with single coverage in a health insurance plan with a deductible to increase by about 5 percent at the national level in 2015 relative to the earlier methodology.
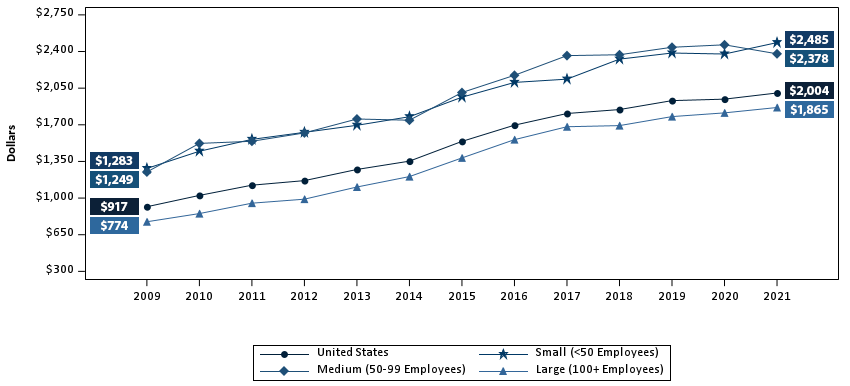
Exhibit ES.17: Average individual deductible (in dollars) (standard error) per employee enrolled with single coverage in a health insurance plan with a deductible, overall and by firm size, 2009-2021
TABLE SUMMARY
| Number of Employees | 2009 | 2010 | 2011 | 2012 | 2013 | 2014 | 2015 | 2016 | 2017 | 2018 | 2019 | 2020 | 2021 |
|---|---|---|---|---|---|---|---|---|---|---|---|---|---|
| U.S. | $917 | $1,025 | $1,123 | $1,167 | $1,273 | $1,353 | $1,541 | $1,696 | $1,808 | $1,846 | $1,931 | $1,945 | $2,004 |
| (Standard Error) | ($9) | ($18) | ($12) | ($8) | ($20) | ($13) | ($16) | ($16) | ($17) | ($17) | ($18) | ($18) | ($20) |
| <50 | $1,283 | $1,447 | $1,561 | $1,628 | $1,695 | $1,777 | $1,964 | $2,105 | $2,136 | $2,327 | $2,386 | $2,376 | $2,485 |
| (Standard Error) | ($24) | ($21) | ($26) | ($25) | ($24) | ($28) | ($35) | ($34) | ($35) | ($36) | ($35) | ($39) | ($43) |
| 50–99 | $1,249 | $1,522 | $1,543 | $1,622 | $1,755 | $1,744 | $2,008 | $2,173 | $2,361 | $2,369 | $2,441 | $2,464 | $2,378 |
| (Standard Error) | ($46) | ($57) | ($49) | ($64) | ($49) | ($59) | ($62) | ($64) | ($85) | ($65) | ($67) | ($67) | ($74) |
| 100+ | $774 | $852 | $951 | $989 | $1,106 | $1,205 | $1,383 | $1,558 | $1,681 | $1,692 | $1,778 | $1,814 | $1,865 |
| (Standard Error) | ($7) | ($20) | ($14) | ($10) | ($19) | ($14) | ($18) | ($18) | ($20) | ($19) | ($21) | ($20) | ($23) |
Source: Medical Expenditure Panel Survey-Insurance Component, private-sector establishments, 2009-2021.
Note: In 2015, the methodology for calibrating the upper edit bound for the individual deductible amount changed, causing the average individual deductible per employee enrolled with single coverage in a health insurance plan with a deductible to increase by about 5 percent at the national level in 2015 relative to the earlier methodology.