|
|
Font Size:
|
||||
|
|
|
|
||||
STATISTICAL BRIEF #121:
Out-of-Pocket Expenditures on Health Care and Insurance Premiums among the Nonelderly Population, 2003
Highlights
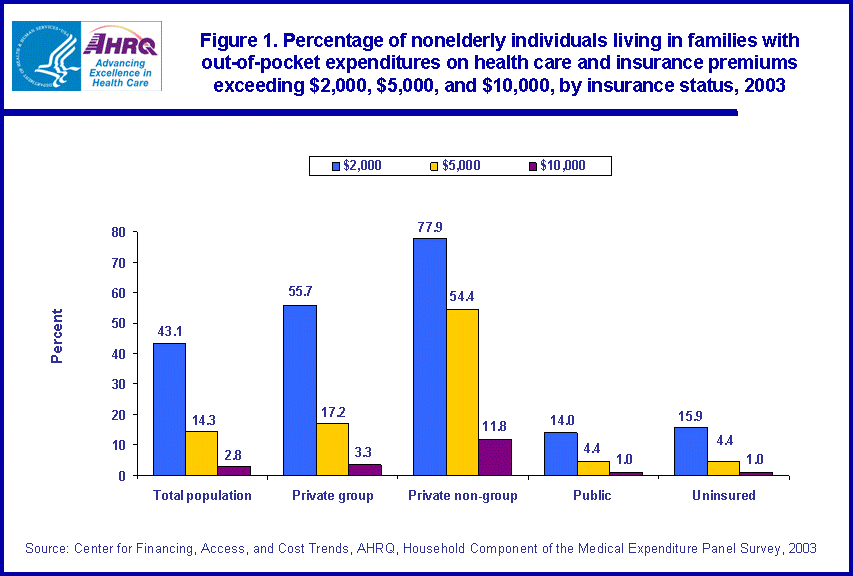
- In 2003, 43.1 percent of nonelderly adults lived in families with out-of-pocket expenditures on health care and health insurance premiums exceeding $2,000; 14.3 percent in families with such spending exceeding $5,000; and 2.8 percent in families with such spending exceeding $10,000.
- Those with private non-group coverage were most likely to have high family-level health-related spending: 11.8 percent had spending exceeding $10,000 compared to 3.3 percent of individuals with private group coverage, 1.0 percent of the uninsured, and 1.0 percent of those with public insurance.
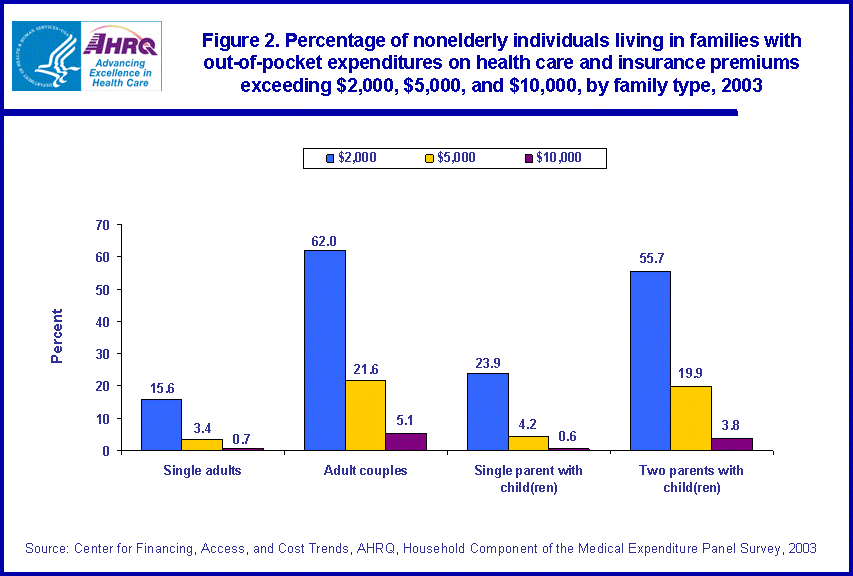
- The percentage of individuals with family-level spending exceeding $10,000 was higher among those living in adult couple families (5.1 percent) and in two parents with child(ren) families (3.8 percent) compared to those in single parent with child(ren) families (0.6 percent) and single adults (0.7 percent).
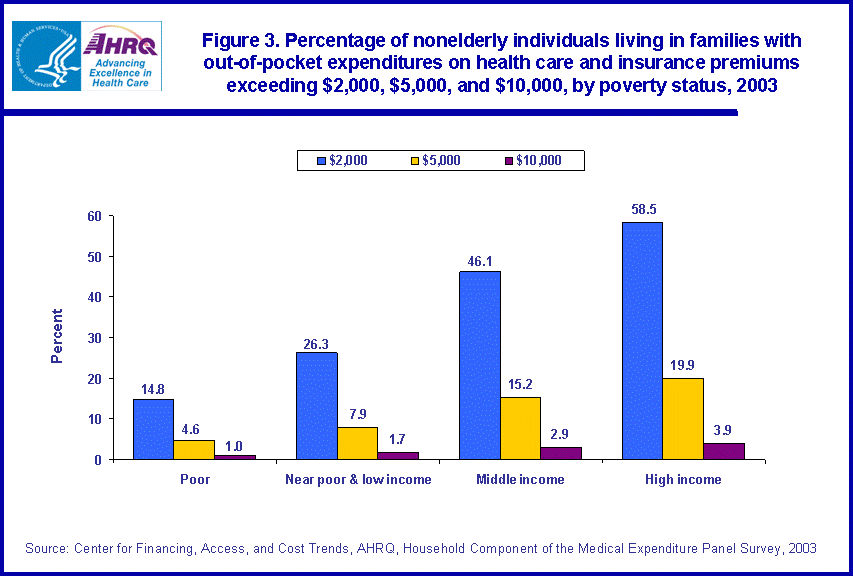
- The proportion of persons with family-level spending exceeding $10,000 was higher among those with high income (3.9 percent) compared to those in the near poor and low income (1.7 percent) and poor (1.0 percent) categories.
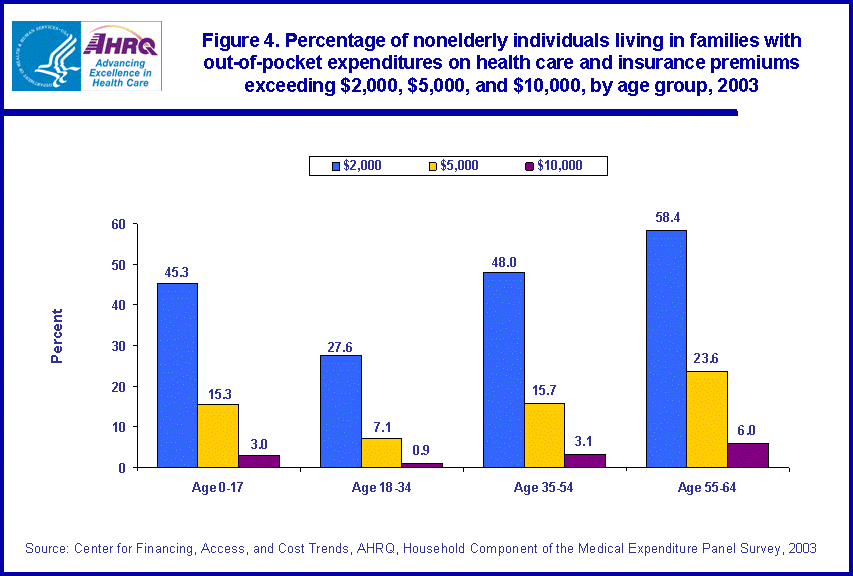
- Family-level out-of-pocket spending increased with age: 0.9 percent of adults aged 18-34 had family-level spending exceeding $10,000 compared to 3.1 percent of adults aged 35-54 and 6.0 percent of adults aged 55-64.
Introduction
Health care costs continue to rise faster than the overall rate of inflation and are consuming a larger share of family budgets.1 In examining the full impact of rising health care costs on families, it is important to capture out-of-pocket expenditures on premiums as well as out-of-pocket costs for health care treatments. Out-of-pocket premium costs can vary significantly by source of coverage. Furthermore, out-of-pocket premium costs are often related to the generosity of the plan, so that a higher premium means lower out-of-pocket spending on medical care and vice versa. Although expenses for health care are attributable to individuals, expenditures for health insurance premiums are attributable to all family members covered by the policy. For this reason, it is important to look at expenses at the family level.
This Statistical Brief presents estimates based on data from the Household Component of the Medical Expenditure Panel Survey (MEPS-HC) on how many nonelderly individuals (age below 65) in the U.S. civilian noninstitutionalized population lived in families with high levels of health-related spending in 2003. The brief also presents estimates on the percentage of individuals with high family-level out-of-pocket spending, by health insurance status, family type, poverty status, and age. All differences between estimates discussed in the text are statistically significant at the 0.05 level.
Findings
In 2003, there were approximately 254 million individuals under age 65 in the U.S. civilian noninstitutionalized population. Among these nonelderly individuals, 43.1 percent were living in families with out-of-pocket expenditures on health care and health insurance premiums exceeding $2,000; 14.3 percent were living in families with health-related out-of-pocket spending exceeding $5,000; and 2.8 percent were living in families with health-related out-of-pocket spending exceeding $10,000 (figure 1).
Out-of-pocket health-related spending, by insurance status
Among the nonelderly population, 63.8 percent had private group coverage (159.9 million), 3.5 percent had private non-group coverage (8.7 million), 13.6 percent had public coverage (34.1 million), and 19.2 percent were uninsured (48.0 million) in 2003.2
Those with private non-group coverage were the most likely to have high family-level health-related spending, reflecting the high premiums and high deductible plans that are common in the non-group market. Among individuals with private non-group coverage, 77.9 percent had family-level spending exceeding $2,000 compared to 55.7 percent of individuals with private group coverage, 15.9 percent of the uninsured, and 14.0 percent of those with public insurance (figure 1). Similarly, among individuals with private non-group coverage, 11.8 percent had family-level spending exceeding $10,000 compared to just 3.3 percent of individuals with private group coverage, 1.0 percent of the uninsured, and 1.0 percent of those with public insurance.
Out-of-pocket health-related spending, by family type
In 2003, among the nonelderly population, 47.8 percent were living in two parent with child(ren) families (120.7 million), 23.1 percent were living in single adult families (58.3 million), 15.9 percent were living in adult couple families (40.1 million), and 13.2 percent were living in single parent with child(ren) families (33.4 million).
Individuals living in adult couple families were more likely to have family-level health-related spending exceeding $2,000 compared to single adults. Per capita out-of-pocket health-related spending on health care was significantly higher among adult couples compared to single adults ($1,765 versus $1,046). This finding was associated with a significant difference in mean age between these two groups (49 versus 37, respectively). Two parent families with children were more likely to have family-level spending exceeding $2,000 compared to single parent families.
Among individuals living in adult couple families, 62.0 percent had family-level spending exceeding $2,000 compared to 55.7 percent of individuals living in two parents with child(ren) families, 23.9 percent of individuals living in single parent with child(ren) families, and 15.6 percent of single adults (figure 2). Similarly, the percentage of individuals with family-level spending exceeding $10,000 was higher among those living in adult couple families (5.1 percent) and those living in two parents with child(ren) families (3.8 percent) compared to those living in single parent with child(ren) families (0.6 percent), and single adults (0.7 percent).
Out-of-pocket health-related spending, by poverty status
High income individuals were the most likely to have high family-level health-related spending. Among individuals with high income, 58.5 percent had family-level spending exceeding $2,000 compared to 46.1 percent of middle income individuals, 26.3 percent of near poor and low income individuals, and 14.8 percent of poor individuals (figure 3). Similarly, among individuals with high income, 19.9 percent had family-level spending exceeding $5,000 compared to 15.2 percent of middle income individuals, 7.9 percent of near poor and low income individuals, and 4.6 percent of poor individuals.
The proportion of those with family-level spending exceeding $10,000 was higher among those with high income (3.9 percent) compared to near poor and low income (1.7 percent) and poor individuals (1.0 percent) (figure 3). The difference in the probability of family-level spending exceeding $10,000 between high income (3.9 percent) and middle income individuals (2.9 percent) was not statistically significant.
Health-related spending, by age group
Among nonelderly adults age 18 or more, family-level out-of-pocket spending increased with age: Of those aged 18-34, 27.6 percent had family-level spending exceeding $2,000 compared to 48.0 percent of adults aged 35-54, and 58.4 percent of adults aged 55-64 (figure 4). Similarly, among those aged 18-34, 0.9 percent had family-level spending exceeding $10,000 compared to 3.1 percent of adults aged 35-54, and 6.0 percent of adults aged 55-64. Among children, 45.3 percent were living in families with out-of-pocket spending exceeding $2,000, and 3.0 percent were living in families with out-of-pocket spending exceeding $10,000.
Data Source
The estimates in this Statistical Brief are based on data from the MEPS 2003 Full-Year Consolidated Data file: HC-079 and MEPS 2003 Person Round Plan Public Use File: HC-076.
Definitions
Family
The definition of family is based on the MEPS health insurance eligibility unit (HIEU) and includes all members of the family that would typically be covered under a private insurance family plan. HIEUs include adults, their spouses, and their unmarried natural/adoptive children age 18 and under as well as children under age 24 who are full-time students.
Persons under 65 who live in families with members over and under 65 were included in this analysis. In these instances, health care expenses for all family members were included in the totals.
Out-of-pocket health-related expenditures
Out-of-pocket costs across all members of the family were summed to calculate total out-of-pocket spending on health care services. Then out-of-pocket premium costs were summed across all health insurance policies covering family members. For example, if there were two single policies covering the two adults of a childless couple unit, these were summed together. If there was only one family policy covering members of the family unit then it was a simple matter to attribute family level premiums to the family unit as defined. Premiums were prorated to account for the number of months of coverage during the year.
Family type
Individuals were classified into four family types: single adults, adult couples, two parent with child(ren) families, and single parent with child(ren) families. In situations where children were not living with their biological parents, they were assigned to one parent or two parent families depending on whether there were one or two adults in the family unit. For the analysis by family type, a few individual children were excluded who were defined as living in their own family unit. These cases included foster children with health insurance coverage through state programs and represent less than 0.5% of the nonelderly population.
Insurance status
Health insurance status is person-level. It was hierarchically defined using insurance status as of the Round 1/3 interview. An individual with any private group coverage was assigned that category. If there was no private group coverage then individuals with any private non-group coverage were assigned that category. Individuals without private coverage of any type who had some type of public coverage were assigned to the public insurance category. Finally, individuals without any health insurance coverage of any type were assigned to the uninsured category.
Poverty status
Family income is defined in terms of poverty status, the ratio of the family's income to the Federal poverty thresholds, which control for the size of the family and the age of the head of the family (see the 2003 U.S. Department of Health and Human Services Poverty Guidelines at http://aspe.hhs.gov/poverty/03poverty.htm for more details). The following classifications were used:
- Poor: Persons in families with income less than 100 percent of the poverty line, including those whose losses exceeded their earnings, resulting in negative income.
- Near poor and low income: Persons in families with income from 100 to less than 200 percent of the poverty line.
- Middle income: Persons in families with income from 200 to less than 400 percent of the poverty line.
- High income: Persons in families with income at or above 400 percent of the poverty line.
About MEPS-HC
MEPS-HC is a nationally representative longitudinal survey that collects detailed information on health care utilization and expenditures, health insurance, and health status, as well as a wide variety of social, demographic, and economic characteristics for the civilian noninstitutionalized population. It is cosponsored by the Agency for Healthcare Research and Quality and the National Center for Health Statistics.
For more information about MEPS, call the MEPS information coordinator at AHRQ (301-427-1656) or visit the MEPS Web site at http://www.meps.ahrq.gov/.
References
For a detailed description of the MEPS survey design, sample design, and methods used to minimize sources of nonsampling error, see the following publications:
Cohen, J. Design and Methods of the Medical Expenditure Panel Survey Household Component. MEPS Methodology Report No. 1. AHCPR Pub. No. 97-0026. Rockville, Md.: Agency for Health Care Policy and Research, 1997.
Cohen, S. Sample Design of the 1996 Medical Expenditure Panel Survey Household Component. MEPS Methodology Report No. 2. AHCPR Pub. No. 97-0027. Rockville, Md.: Agency for Health Care Policy and Research, 1997.
Cohen, S. Design Strategies and Innovations in the Medical Expenditure Panel Survey. Medical Care, July 2003: 41(7) Supplement: III-5-III-12.
Suggested Citation
Bernard, D. and Banthin, J. Out-of-Pocket Expenditures on Health Care and Insurance Premiums among the Nonelderly Population, 2003. Statistical Brief #121. March 2006. Agency for Healthcare Research and Quality, Rockville, Md. http://www.meps.ahrq.gov/mepsweb/data_files/publications/st121/stat121.shtml
AHRQ welcomes questions and comments from readers of this publication who are interested in obtaining more information about access, cost, use, financing, and quality of health care in the United States. We also invite you to tell us how you are using this Statistical Brief and other MEPS data and tools and to share suggestions on how MEPS products might be enhanced to further meet your needs. Please e-mail us at mepspd@ahrq.gov or send a letter to the address below:
Steven B. Cohen, PhD, Director
Center for Financing, Access, and Cost Trends
Agency for Healthcare Research and Quality
540 Gaither Road
Rockville, MD 20850
Footnotes
1 Levit et al. Health Spending Rebound Continues in 2002. Health Affairs, 2004; 23(1):147-159.
2 Population estimates by insurance status are based on the people who were in the survey in the first half of the year.
 |
||||||||||||||||||||||||||||||||||||
|
||||||||||||||||||||||||||||||||||||
|
|
||||||||||||||||||||||||||||||||||||
 |
||||||||||||||||||||||||||||||||||||
|
||||||||||||||||||||||||||||||||||||
|
|
||||||||||||||||||||||||||||||||||||
 |
||||||||||||||||||||||||||||||||||||
|
||||||||||||||||||||||||||||||||||||
|
|
||||||||||||||||||||||||||||||||||||
 |
||||||||||||||||||||||||||||||||||||
|
||||||||||||||||||||||||||||||||||||
|
|
||||||||||||||||||||||||||||||||||||


