
|
|
Font Size:
|
||||
|
|
|
|
||||
STATISTICAL BRIEF #159:
Out-of-Pocket Expenditures on Health Care among the Nonelderly Population, 2004
Highlights
- In 2004, mean out-of-pocket expenses were $592 among the nonelderly population with some health care expenses. Half had annual out-of-pocket expenses equal to or more than $199 while the top 10 percent had expenses equal to or more than $1,469.
- For those with some expense, median and 90th percentile out-of-pocket expenditures were lowest among those with public insurance. The median was $255 among the privately insured, $8 among those with public insurance, and $225 among the uninsured. The 90th percentile was $1,516 among the privately insured, $631 among those with public insurance, and $1,872 among the uninsured.
- Out-of-pocket expenses increased significantly with age. For those with some expense, median expenses were $59 among children, $179 among adults age 18 to 34, $310 among adults age 35 to 54, and $636 among adults age 55 to 64. The 90th percentile expenses were $611 among children, $1,089 among adults age 18 to 34, $1,735 among adults age 35 to 54, and $2,810 among adults age 55 to 64.
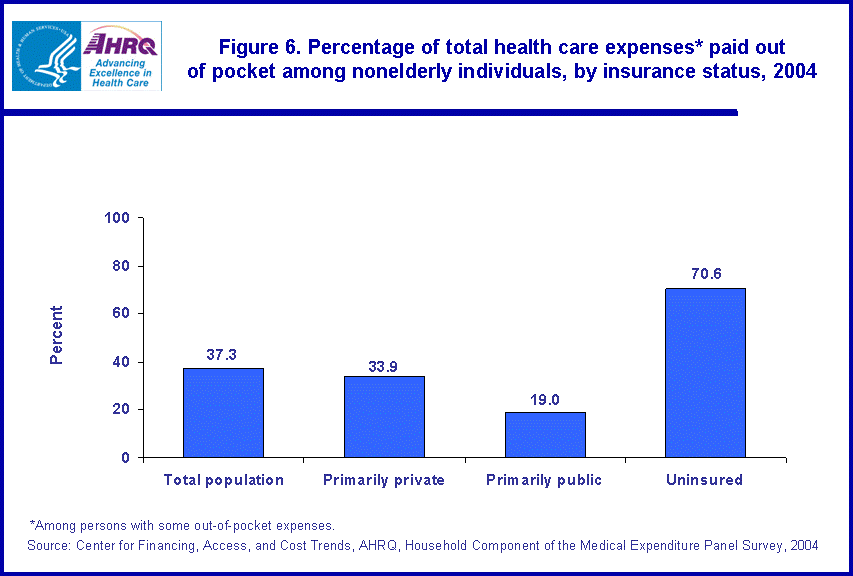
- The share of expenses paid out of pocket was highest among the uninsured and lowest among the publicly insured. Among those with some out-of-pocket expense, the uninsured paid 70.6 percent, the publicly insured paid 19.0 percent, and the privately insured paid 33.9 percent out of pocket.
Introduction
Health care costs continue to rise faster than the overall rate of inflation and are consuming a larger share of family budgets. By 2003, there were 48.8 million individuals living in families who spent more than 10 percent of family income on medical care, an increase of 11.7 million persons since 1996.*
Using data from the Household Component of the Medical Expenditure Panel Survey (MEPS-HC), this Statistical Brief presents data on out-of-pocket health care expenditures among nonelderly individuals (age below 65) in 2004, and examines how out-of-pocket spending varies by health insurance status, poverty status, and age. The distribution of health care expenditures is highly skewed (i.e., a small proportion of persons have extremely large expenses); as a consequence, the emphasis of this analysis is on the expenditure distribution. All differences between estimates discussed in the text are statistically significant at the 0.05 level.
Findings
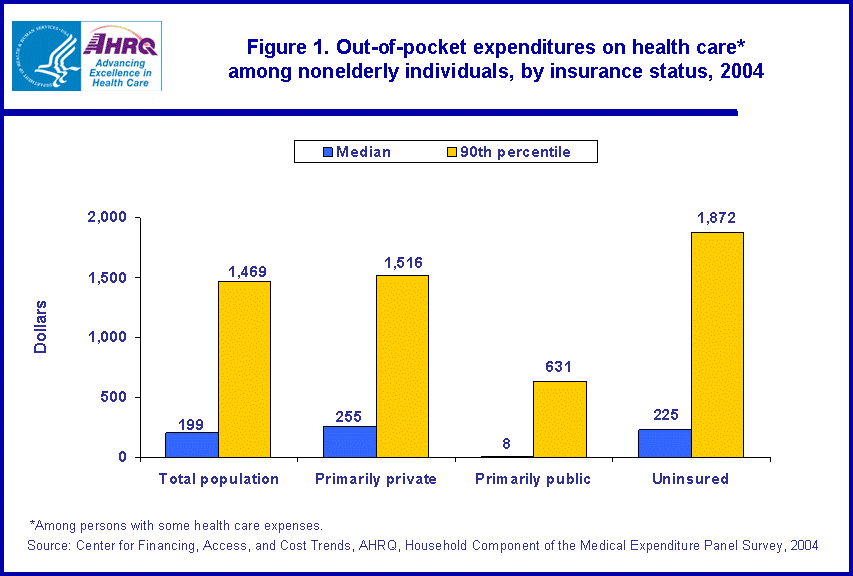
In 2004, there were approximately 256 million individuals under age 65 in the United States civilian noninstitutionalized population. Among nonelderly individuals 17.1 percent had no health care expenses. Among the 82.9 percent with some health care expenses, mean out-of-pocket expenses were $592. Among those with some expense, half had out-of-pocket expenditures of less than $199 (median) and half had expenses equal to or more than $199 (figure 1). The top 10 percent in terms of out-of-pocket spending (90th percentile) had out-of-pocket expenses equal to or more than $1,469.
Out-of-pocket health-related spending by insurance status
In 2004, among the nonelderly population, 67.4 percent had private insurance coverage (173.0 million), 14.5 percent had public coverage (37.3 million), and 18.0 percent were uninsured (46.2 million). Among the privately insured, 88.6 percent had some health care expenses, among those with public insurance, 85.5 percent, and among the uninsured, 59.3 percent.
For those with some expense, median and 90th percentile out-of-pocket expenditures were lowest among those with public insurance. Median out-of-pocket spending was $255 among the privately insured, $8 among those with public insurance, and $225 among the uninsured (figure 1). The 90th percentile out-of-pocket spending was $1,516 among the privately insured, $631 among those with public insurance, and $1,872 among the uninsured.
Out-of-pocket health-related spending by poverty status
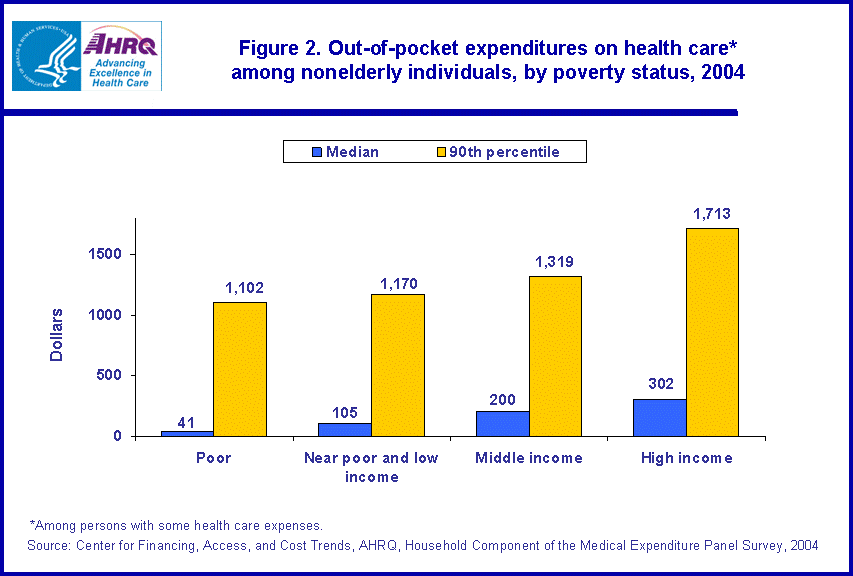
Out-of-pocket expenditures were positively correlated with income. Among those with some expense, median out-of-pocket spending was $41 among poor individuals, $105 among near poor and low income individuals, $200 among middle income individuals, and $302 among high income individuals (figure 2). The 90th percentile for out-of-pocket expenditures was significantly higher among high income individuals compared to those with lower incomes. The 90th percentile was $1,102 among poor individuals, $1,170 among near poor and low income individuals, $1,319 among middle income individuals, and $1,713 among high income individuals.
Health-related spending by age group
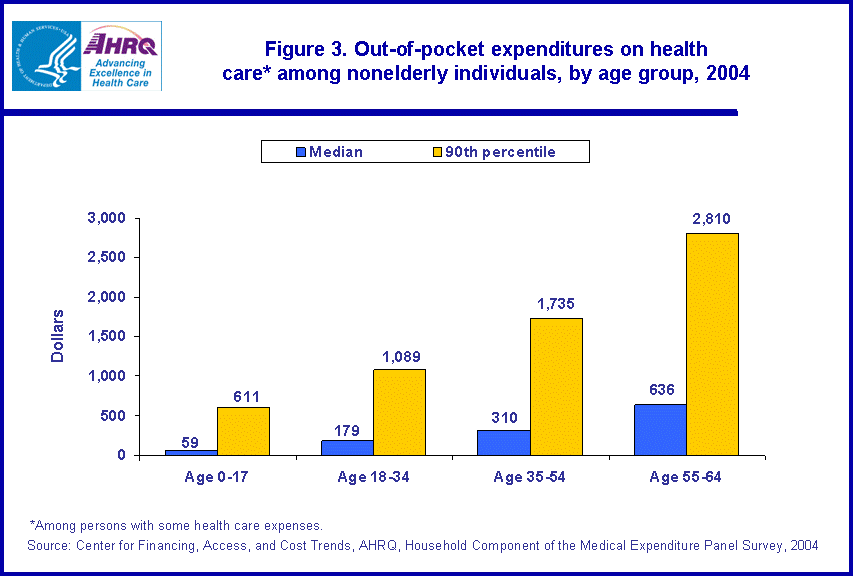
Out-of-pocket expenses increased significantly with age. For those with some expense, median expenses were $59 among children (those under age 18), $179 among adults age 18 to 34, $310 among adults age 35 to 54, and $636 among adults age 55 to 64 (figure 3). The 90th percentile for expenses was $611 among children, $1,089 among adults age 18 to 34, $1,735 among adults age 35 to 54, and $2,810 among adults age 55 to 64.
Out-of-pocket health-related spending by poverty and insurance status
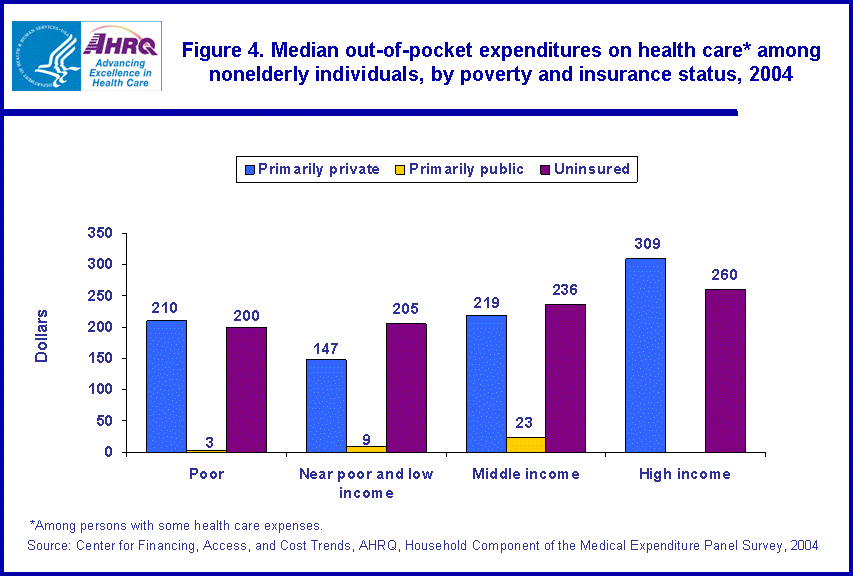
Since health care expenditures are positively correlated with income level, it is important to examine how expenditures vary by insurance status within poverty status. Across all income levels, those with public insurance had significantly lower out-of-pocket expenses compared with those with private insurance and the uninsured, while the difference in expenses between the privately insured and the uninsured was not statistically significant.
Among the poor with some expense, median out-of-pocket spending was $3 for the publicly insured versus $210 for the privately insured and $200 for the uninsured. Among near poor and low income individuals with some expense, median spending was $9 for the publicly insured versus $147 for the privately insured and $205 for the uninsured (figure 4). Among middle income individuals with some expense, median spending was $23 for the publicly insured versus $219 for the privately insured and $236 for the uninsured. Among high income individuals with some expense, median spending was $309 for the privately insured and $260 for the uninsured.
Health-related spending by age group and insurance status
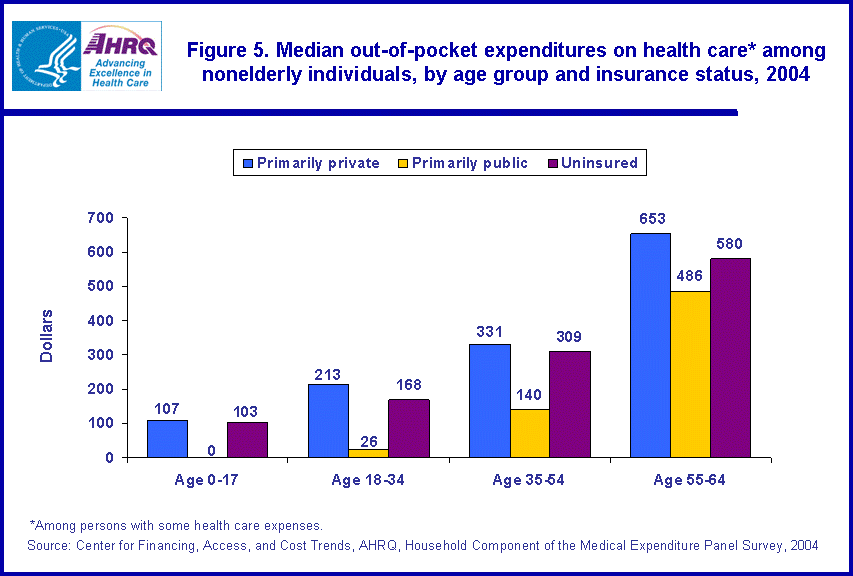
Since health care expenditures are positively correlated with age, it is important to examine how out-of-pocket expenditures vary by insurance status within age groups. Among children, adults age 18 to 34, and adults age 35 to 54, those with public insurance had significantly lower expenses compared with those with private insurance and the uninsured. Among adults age 55 to 64, those with public insurance had significantly lower expenses compared with those with private insurance.
For those with some expense, median out-of-pocket expenses were $0 among the publicly insured children versus $103 among the uninsured and $107 among the privately insured children (figure 5). For adults age 18 to 34, median expenses were $26 among the publicly insured versus $213 among the privately insured and $168 among the uninsured. For adults age 34 to 54, median expenses were $140 among the publicly insured versus $331 among the privately insured and $309 among the uninsured. For adults age 55 to 64, median expenses were $486 among the publicly insured versus $653 among the privately insured and $580 among the uninsured.
Share of total health care expenses paid out of pocket by insurance status
Among nonelderly persons with some health care expense in 2004, 10.0 percent paid nothing out of pocket for their health care. For those with some health care expenses, 4.4 percent among the privately insured, 7.1 percent among the uninsured, and 39.3 percent among those with public insurance had no out-of-pocket expenses.
Figure 6 presents the mean share of expenses paid out of pocket by insurance status for those with some out-of-pocket expenses. The share of expenses paid out of pocket was highest among the uninsured. On average, the uninsured paid 70.6 percent of their health care expenses out of pocket.† The share of expenses paid out of pocket was lowest among the publicly insured. On average, the publicly insured paid 19.0 percent of their health care expenses out of pocket. The mean share of expenses paid out of pocket was 33.9 percent among those with private insurance.
Data Source
The estimates in this Statistical Brief are based upon data from the MEPS 2004 Full-Year Consolidated Data file (HC-089).
Definitions
Family
The definition of family used in this brief is based on the U.S. Census Bureau's Current Population Survey--defined family unit, which includes adults, their spouses, and their unmarried natural/adoptive children age 18 and under as well as children under age 24 who are full-time students. These families do not include non-married partners, foster children, and in-laws. Persons under 65 who live in families including members over and under 65 are included in this analysis. In these instances, health care expenses for all family members are included in the totals.
Out-of-pocket health-related expenditures
MEPS total expenses include payments from all sources (including third-party payers and other miscellaneous sources) to hospitals, physicians, other health care providers, and pharmacies for services reported by respondents in the MEPS-HC. Out-of-pocket expenses comprise the portion of payments made by individuals and families for services received during the year. Health insurance premiums are not included in this analysis.
Insurance status
Health insurance status is person-level. For people with a change in their insurance status during the year, insurance status was hierarchically assigned. Using the monthly insurance status variables, we constructed the number of months with private and public coverage during the year. First, individuals without any private or public health insurance coverage during the year were assigned to the uninsured category. Next, people with both private and public coverage were assigned the type of coverage with the longer duration. For example, a person with four months of private and eight months of public coverage was assigned to the public insurance category.
Poverty status
Family income is defined in terms of poverty status, the ratio of the family's income to the Federal poverty thresholds, which control for the size of the family and the age of the head of the family (see the 2004 U.S. Department of Health and Human Services Poverty Guidelines at http://aspe.hhs.gov/poverty/04poverty.shtml for more details). The following classification is used:
- Poor: Persons in families with income less than 100 percent of the poverty line, including those whose losses exceeded their earnings, resulting in negative income.
- Near poor and low income: Persons in families with income from 100 to less than 200 percent of the poverty line.
- Middle income: Persons in families with income from 200 to less than 400 percent of the poverty line.
- High income: Persons in families with income at or above 400 percent of the poverty line.
About MEPS-HC
MEPS-HC is a nationally representative longitudinal survey that collects detailed information on health care utilization and expenditures, health insurance, and health status, as well as a wide variety of social, demographic, and economic characteristics for the civilian noninstitutionalized population. It is cosponsored by the Agency for Healthcare Research and Quality and the National Center for Health Statistics.
For more information about MEPS, call the MEPS information coordinator at AHRQ (301-427-1656) or visit the MEPS Web site at http://www.meps.ahrq.gov/.
References
For a detailed description of the MEPS survey design, sample design, and methods used to minimize sources of nonsampling error, see the following publications:
Cohen, J. Design and Methods of the Medical Expenditure Panel Survey Household Component. MEPS Methodology Report No. 1. AHCPR Pub. No. 97-0026. Rockville, Md.: Agency for Health Care Policy and Research, 1997.
Cohen, S. Sample Design of the 1996 Medical Expenditure Panel Survey Household Component. MEPS Methodology Report No. 2. AHCPR Pub. No. 97-0027. Rockville, Md.: Agency for Health Care Policy and Research, 1997.
Cohen, S. Design Strategies and Innovations in the Medical Expenditure Panel Survey. Medical Care, July 2003: 41(7) Supplement: III-5-III-12.
Suggested Citation
Bernard, D. Out-of-Pocket Expenditures on Health Care among the Nonelderly Population, 2004. Statistical Brief #159. January 2007. Agency for Healthcare Research and Quality, Rockville, Md. http://www.meps.ahrq.gov/mepsweb/data_files/publications/st159/stat159.shtml.
AHRQ welcomes questions and comments from readers of this publication who are interested in obtaining more information about access, cost, use, financing, and quality of health care in the United States. We also invite you to tell us how you are using this Statistical Brief and other MEPS data and tools and to share suggestions on how MEPS products might be enhanced to further meet your needs. Please e-mail us at mepspd@ahrq.gov or send a letter to the address below:
Steven B. Cohen, PhD, Director
Center for Financing, Access, and Cost Trends
Agency for Healthcare Research and Quality
540 Gaither Road
Rockville, MD 20850
Footnotes
*Banthin, J. and D. Bernard. Changes in Financial Burdens for Health Care, National Estimates for the Population under Age 65, 1996 to 2003. JAMA, 2006: 296 (22):2712-2719.
†The remaining portion of expenses for uninsured persons was likely paid by various miscellaneous sources that are not classified as health insurance coverage in MEPS, such as the Indian Health Service, Veteran's Administration, community and neighborhood clinics, State and local health departments, Worker's Compensation, as well as automobile, homeowner's, and liability insurance.
 |
||||||||||||||||||||||||||||||
|
||||||||||||||||||||||||||||||
|
|
||||||||||||||||||||||||||||||
 |
||||||||||||||||||||||||||||||
|
||||||||||||||||||||||||||||||
|
|
||||||||||||||||||||||||||||||
 |
||||||||||||||||||||||||||||||
|
||||||||||||||||||||||||||||||
|
|
||||||||||||||||||||||||||||||
 |
||||||||||||||||||||||||||||||
|
||||||||||||||||||||||||||||||
|
|
||||||||||||||||||||||||||||||
 |
||||||||||||||||||||||||||||||
|
||||||||||||||||||||||||||||||
|
|
||||||||||||||||||||||||||||||
 |
||||||||||||||||||||||||||||||
|
||||||||||||||||||||||||||||||
|
|
||||||||||||||||||||||||||||||


