STATISTICAL BRIEF #285:
Employer-Sponsored Single, Employee-Plus-One, and Family Health Insurance Coverage: Selection and Cost, 2009
Highlights
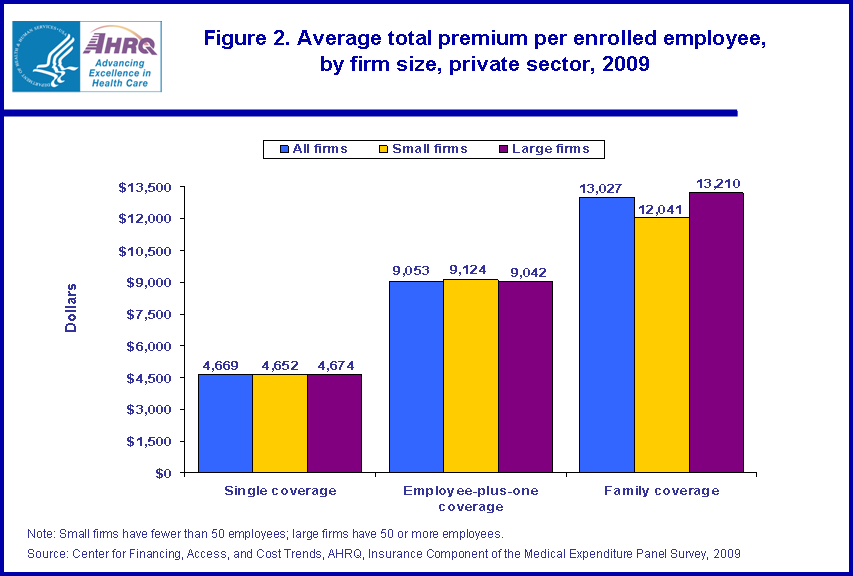
- In 2009, the average annual family coverage premiums ($13,027) were much higher than those for employee-plus-one coverage ($9,053), which in turn were much higher than single coverage premiums ($4,669) in the private sector. Compared with those with single coverage, employees with non-single coverage also contributed a larger amount toward their premium both in terms of dollars and percentage of total premium cost.
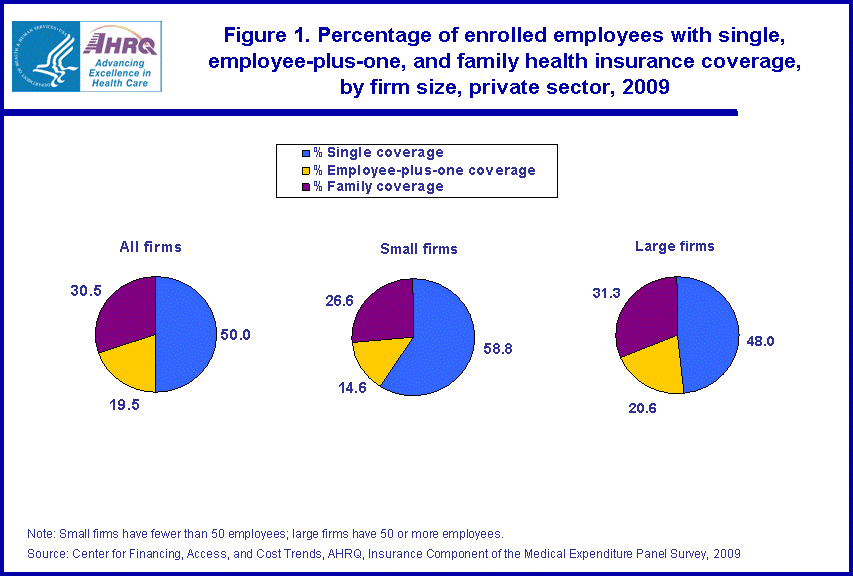
- In 2009, 49.9 percent of private sector employees with health insurance through their employer were enrolled in single coverage plans and 50.1 percent were enrolled in non-single coverage plans. About 39 percent of employees with non-single coverage were in employee-plus-one plans.
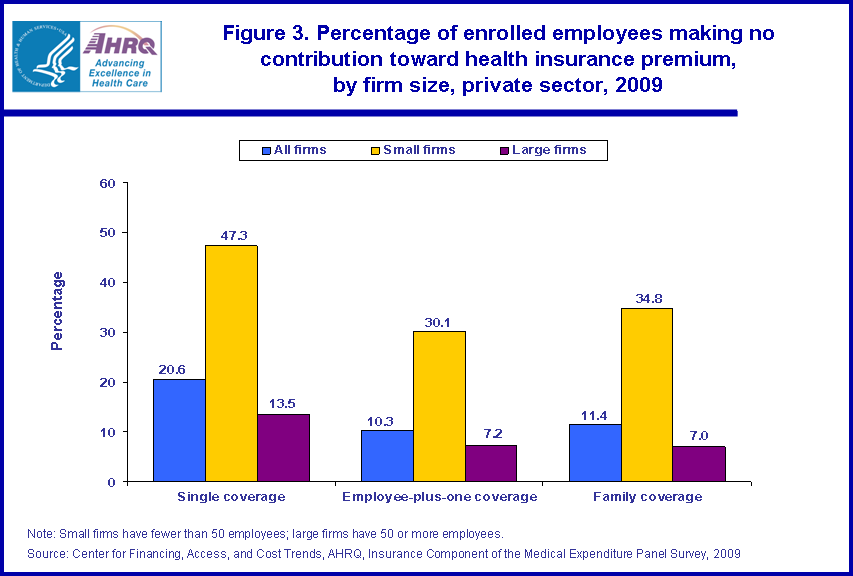
- For both large and small employers, employees with single coverage were much more likely to not have to contribute toward their plan s premium than employees with non-single coverage. Overall, 20.6 percent of those enrolled in single plans did not contribute toward the premium cost compared with 11.4 percent of those with family coverage, and 10.3 percent of those with employee-plus-one coverage.
Introduction
Health insurance provided by employers is a key source of coverage for both employees and their families. In 2009, half of private sector employees enrolled in employer-sponsored health insurance took single, self-only coverage and half took non-single coverage (a plan covering the employee and at least one other family member). According to the Insurance Component of the Medical Expenditure Panel Survey (MEPS-IC), those employees with non-single coverage contributed both a larger dollar amount and a larger percentage of the total premium for their coverage than did employees with single coverage.Non-single health insurance plans encompass two types of coverage: family coverage and employee-plus-one coverage. When available for the same level of benefits, employee-plus-one plan premiums are less expensive than family plans (see Definitions section).
This Statistical Brief presents information on the selection and cost of single, employee-plus-one, and family health insurance coverage in the private sector in 2009.
Only differences that are statistically significant at the 0.05 significance level are discussed in the text.
Findings
Among employees obtaining health insurance through their private sector employers in 2009, half were enrolled in single coverage and half were enrolled in non single coverage (a plan covering one or more family members or dependents in addition to the employee). Of the 59.2 million employees enrolled in health insurance plans, 29.6 million employees had single coverage, 11.6 million employees had employee-plus-one coverage, and 18.1 million employees had family coverage (figure 1).Employees in large private sector firms, those with 50 or more employees, were somewhat more likely to have enrolled in non single coverage (52.0 percent) than in single coverage (48.0 percent) (figure 1). However, the reverse was true for small firms, those with fewer than 50 employees, where the portion of enrollment in single plans (58.8 percent) was much larger than in non-single plans (41.2 percent).
There were large differences in 2009 between the average total premium costs for single, employee-plus-one, and family plans. Single coverage premiums averaged $4,669 per year compared with $9,053 for employee-plus-one premiums and $13,027 for family premiums (figure 2). In the private sector, the average premium for single coverage in small firms was no different than the average premium for comparable coverage in large firms. The same was true for employee-plus-one premiums. However, the average premium for family coverage in small firms was 8.8 percent lower than the comparable coverage in large firms.
Premium costs for employer-based coverage may be paid completely by the employee, paid in part by the employer and in part by the employee, or paid completely by the employer. While 20.6 percent of private sector employees with single coverage were enrolled in a plan that did not require them to contribute toward the premium cost, only 11.4 percent of employees with family coverage and 10.3 percent of those with employee-plus-one coverage were in such a plan (figure 3). For both large and small employers, employees with single coverage were much less likely to contribute toward their plan premium than those with non-single coverage.
In 2009, employees of small firms were much less likely to contribute to their premium than those in large firms. In small firms, 47.3 percent of those with single coverage did not contribute to their premium (figure 3). For large firms, that was true for only 13.5 percent of employees. The comparable figures for employee-plus-one coverage were 30.1 percent (small firms) versus 7.2 percent (large firms), and for family coverage 34.8 percent (small firms) versus 7.0 percent (large firms).
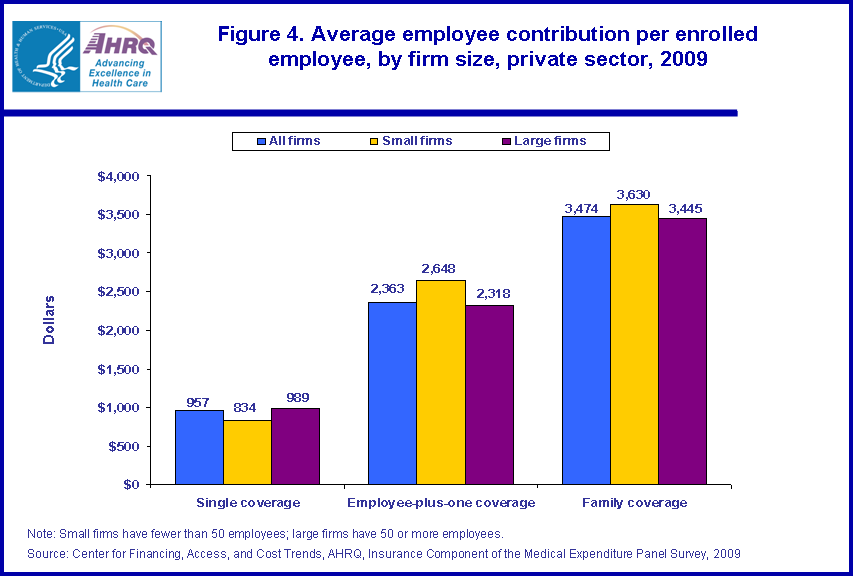
As with the premiums, the average annual contribution by an employee toward that premium was much larger for family coverage ($3,474) than for employee-plus-one coverage ($2,363) or single coverage ($957) (figure 4). These averages include all employees who enrolled in private sector employer-sponsored plans. Employee contributions toward single coverage were 15.7 percent lower in small firms than large firms ($834 versus $989). In contrast, employee contributions toward employee-plus-one coverage were 14.2 percent higher for employees in small firms ($2,648) compared with large firms ($2,318), and employee contributions for family coverage were 5.4 percent higher in small firms ($3,630) compared with large firms ($3,445).
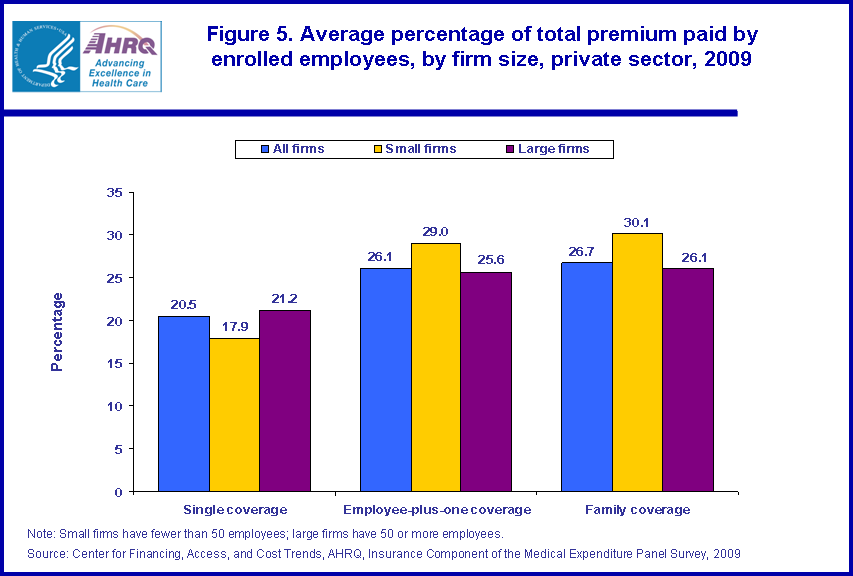
Employees with non-single coverage not only contribute a larger dollar amount toward their health insurance premium than employees with single coverage, they also pay a greater percentage of the total premium cost. Those with family and employee-plus-one coverage contributed 26.7 and 26.1 percent on average, respectively, of the cost of their premium, while employees with single coverage contributed 20.5 percent (figure 5). Large firms' employees paid 21.2 percent of the single premium, higher than the 17.9 percent that small firms' employees paid. For employee-plus-one and family coverage, the reverse was true. For employee-plus-one coverage, large firms' employees paid 25.6 percent of the premium, while employees of small firms paid 29.0 percent. For family coverage, large firms' employees paid 26.1 percent of the premium, while employees of small firms paid 30.1 percent.
Data Source
The statistics in this Brief are estimates from the 2009 MEPS-IC. All information comes from tables that are available on the MEPS Web site at http://www.meps.ahrq.gov/mepsweb/survey_comp/Insurance.jsp. This Brief is limited to a discussion of private sector statistics; tables containing information on employer-sponsored health insurance for State and local government employees will be published in Fall 2010.Definitions
Health insurance planAn insurance contract that provides hospital and/or physician coverage to an employee or retiree for an agreed-upon fee (premium) for a defined benefit period.
Employee
A person on the actual payroll. Excludes temporary and contract workers but includes the owner or manager if that person works at the firm.
Firm
A business entity consisting of one or more business establishments under common ownership or control. A firm represents the entire organization, including the company headquarters and all divisions, subsidiaries, and branches. A firm may consist of a single-location establishment, in which case the establishment and firm are identical.
Premium
Agreed-upon fee paid for coverage of medical benefits for a defined benefit period, usually a calendar year. Premiums can vary based on a variety of factors, such as services covered, amounts of deductibles and co-pays, location of firm, and demographics of the workforce.
Single coverage
Health insurance that covers the employee only.
Employee-plus-one coverage
Health insurance that covers the employee plus one family member at a lower premium level than family coverage. This family member could be a spouse or child. If premiums differed for employee-plus-spouse and employee-plus-child coverage, information for employee-plus-child was reported.
Family coverage
Health insurance that covers the employee and the employee s family. If a plan offered more than one pricing level for family coverage, information for a family of four was reported.
Non-single coverage
Health insurance that covers at least one person in addition to the employee. Both employee-plus-one coverage and family coverage are included in this category.
About MEPS-IC
MEPS-IC is a survey of business establishments and governments that collects information on employer-sponsored health insurance, such as whether insurance is offered, enrollments, types of plans and premiums. The survey is conducted annually by the U.S. Census Bureau under the sponsorship of the Agency for Healthcare Research and Quality. The yearly response rate has averaged 78 percent for in-scope sample units. Approximately 4 percent of the original sample has been out-of-scope in a typical year. A total sample of 42,000 private sector establishments was selected for the 2009 survey, prior to accounting for losses due to nonresponse and out-of-scope cases.For more information on this survey, see MEPS Methodology Reports 6, 8, 10, 14, 17, and 18 on the MEPS Web site at http://www.meps.ahrq.gov/mepsweb/data_stats/Pub_ProdLookup_Results.jsp?ProductType=Methodology%20Report&Comp=Insurance and Insurance Component Survey Basics at http://www.meps.ahrq.gov/mepsweb/survey_comp/Insurance.jsp.
Suggested Citation
Crimmel, B.L. Employer-Sponsored Single, Employee-Plus-One, and Family Health Insurance Coverage: Selection and Cost, 2009. Statistical Brief #285. July 2010. Agency for Healthcare Research and Quality, Rockville, MD. http://www.meps.ahrq.gov/mepsweb/data_files/publications/st285/stat285.shtmlAHRQ welcomes questions and comments from readers of this publication who are interested in obtaining more information about access, cost, use, financing, and quality of health care in the United States. We also invite you to tell us how you are using this Statistical Brief and other MEPS data and tools and to share suggestions on how MEPS products might be enhanced to further meet your needs. Please e-mail us at MEPSProjectDirector@ahrq.hhs.gov or send a letter to the address below:
Steven B. Cohen, PhD, Director
Center for Financing, Access, and Cost Trends
Agency for Healthcare Research and Quality
540 Gaither Road
Rockville, MD 20850
 |
||||||||||||||||||||||||
|
||||||||||||||||||||||||
|
|
||||||||||||||||||||||||
 |
||||||||||||||||||||||||
|
||||||||||||||||||||||||
|
|
||||||||||||||||||||||||
 |
||||||||||||||||||||||||
|
||||||||||||||||||||||||
|
|
||||||||||||||||||||||||
 |
||||||||||||||||||||||||
|
||||||||||||||||||||||||
|
|
||||||||||||||||||||||||
 |
||||||||||||||||||||||||
|
||||||||||||||||||||||||
|
|
||||||||||||||||||||||||