 |  |
STATISTICAL BRIEF #287
|
|
Findings
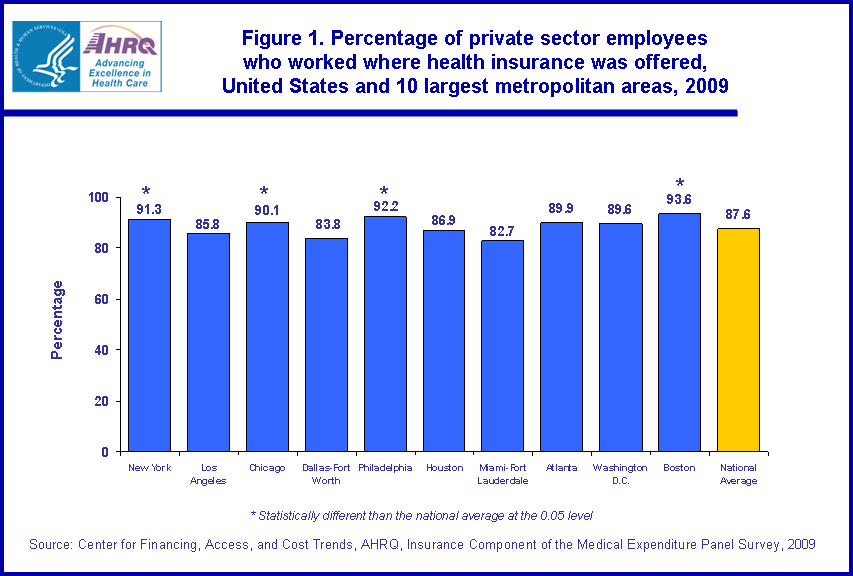
Among the 110.5 million private sector employees in the United States, 87.6 percent worked where employer-sponsored health insurance was offered in 2009 (figure 1). Among the 10 largest metropolitan areas, New York (91.3 percent), Chicago (90.1 percent), Philadelphia (92.2 percent) and Boston (93.6 percent) all had offer rates higher than the national average. None of the six remaining areas had rates that differed from the national average.
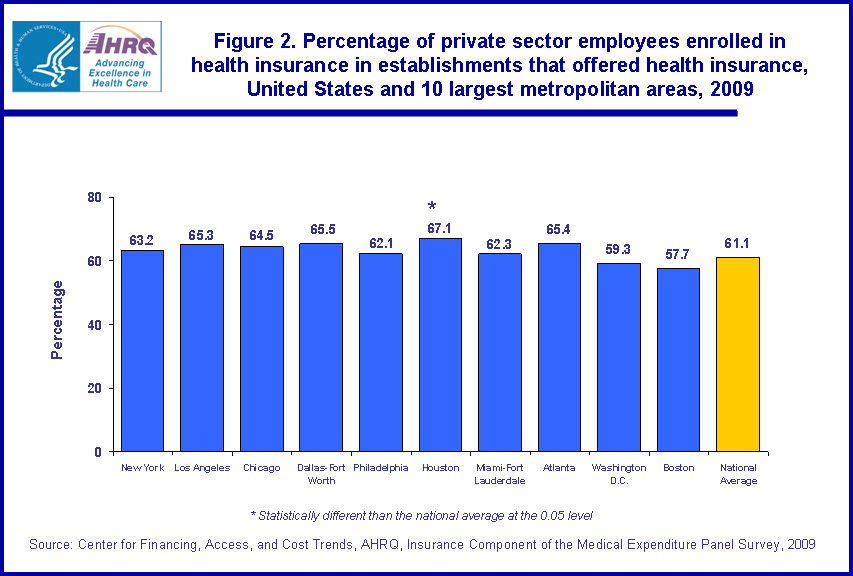
Of all private sector employees in the U.S. who worked where health insurance was offered, 61.1 percent enrolled (figure 2). Only the Houston area, at 67.1 percent, differed from the U.S. average.
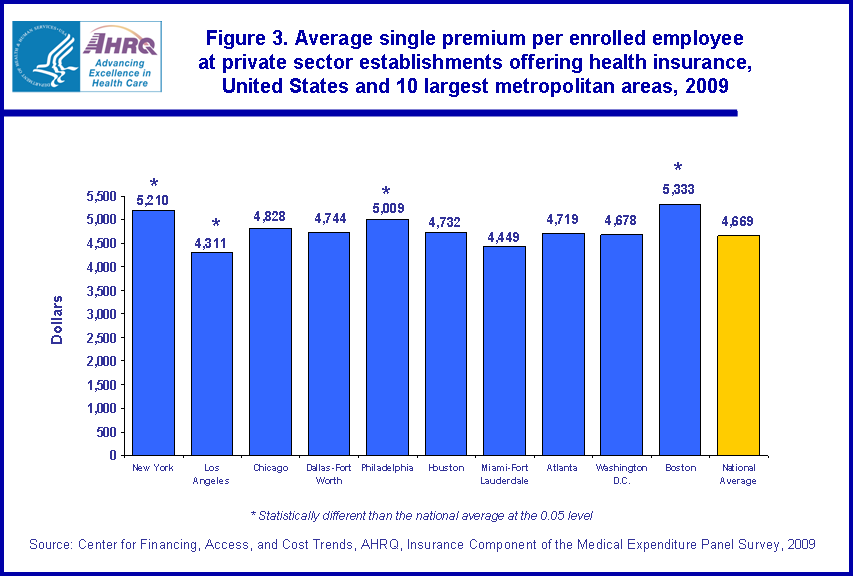
In 2009, the U.S. average premium for those enrolled in employer-sponsored single coverage was $4,669 (figure 3). Only Los Angeles, of the 10 largest metro areas, had an average single premium ($4,311) below the U.S. average. New York ($5,210), Philadelphia ($5,009), and Boston ($5,333) had average single premiums above the U.S. average.
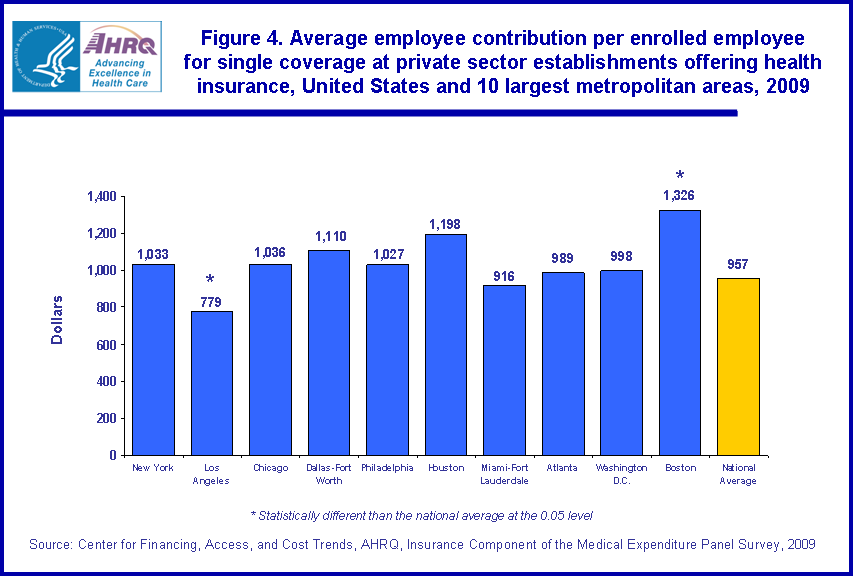
The average employee contribution toward the premium for single coverage was higher than average in Boston ($1,326) and lower than average in Los Angeles ($779) (figure 4). None of the other 10 largest metropolitan areas had single coverage contributions that differed from the U.S. average ($957) in 2009.
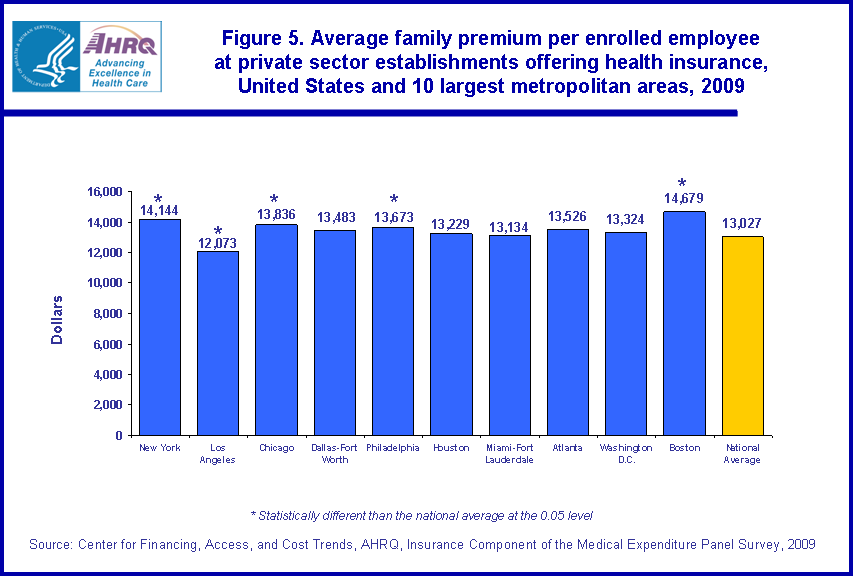
The 2009 U.S. private sector average premium for employer-sponsored family coverage was $13,027 (figure 5). As with single premiums, only Los Angeles had a below average family premium ($12,073). New York ($14,144), Chicago ($13,836), Philadelphia ($13,673), and Boston ($14,679) premiums were above average, of the 10 largest areas.
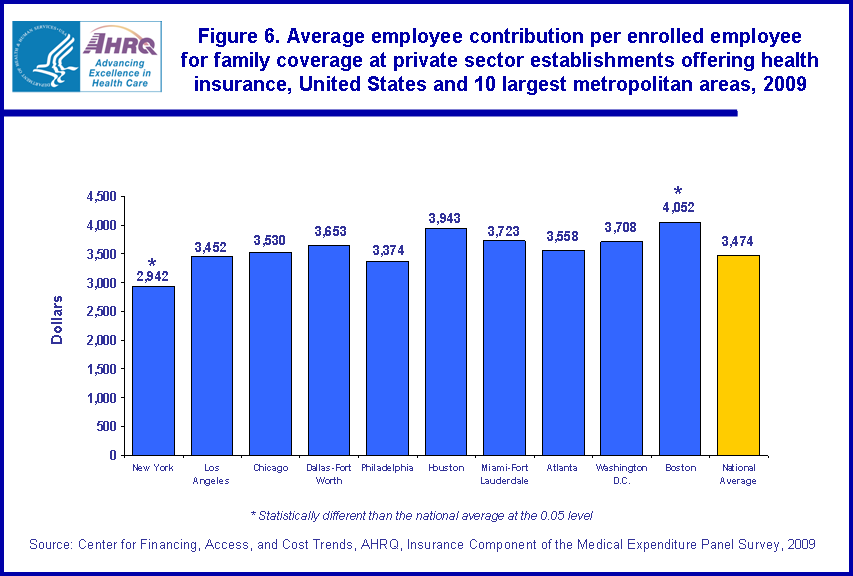
In 2009, the national average employee contribution toward the family premium was $3,474 (figure 6). Boston's average family contribution ($4,052) was the only area's contribution that was higher than the national average--the same pattern as for single contributions. New York's contribution ($2,942) was lower than average. The remainder of the 10 largest areas contributions did not differ from the family coverage national average.
Data Source
This Statistical Brief summarizes data from the 2009 MEPS-IC. The data are available on the MEPS Web site at http://www.meps.ahrq.gov/mepsweb/survey_comp/Insurance.jsp or have been produced using special computation runs on the confidential MEPS-IC data available at the U.S. Census Bureau.
Definitions
Single coverage
Single coverage is health insurance that covers the employee only. This is also known as employee-only coverage.
Family coverage
Family coverage is health insurance that covers the employee and one or more members of his/her immediate family (spouse and/or children as defined by the plan). For the MEPS-IC survey, family coverage is any coverage other than single and employee-plus-one. Some plans offer more than one rate for family coverage, depending on family size and composition. If more than one rate is offered, survey respondents are asked to report costs for a family of four.
Metropolitan areas
Metropolitan areas are Metropolitan Statistical Areas (MSAs) defined and published by the Office of Management and Budget (OMB) as of June 6, 2003. Counties included in each area can be found in the Appendix of OMB Bulletin No. 04-03: (http://www.whitehouse.gov/omb/bulletins/fy04/b04-03.html).
Note that the name of the central city of each MSA has been used in the text and tables for convenience and brevity. The areas consist of more than the central cities. For instance, Washington, D.C., consists of the central city plus counties in Maryland, Virginia, and West Virginia.
About MEPS-IC
MEPS-IC is a survey of business establishments and governments that collects information on employer-sponsored health insurance, such as whether insurance is offered, enrollments, types of plans, and premiums. The survey is conducted annually by the U.S. Census Bureau under the sponsorship of the Agency for Healthcare Research and Quality (AHRQ). The yearly response rate has averaged 78 percent for in-scope sample units. Approximately 4 percent of the original sample has been out-of-scope in a typical year. A total sample of 42,000 establishments was selected for the 2009 survey, prior to accounting for losses due to nonresponse and out-of-scope cases.
For more information on this survey, see MEPS Methodology Reports 6, 8, 10, 14, 17, and 18 on the MEPS Web site at http://www.meps.ahrq.gov/mepsweb/data_stats/publications.jsp and Insurance Component Survey Basics at http://www.meps.ahrq.gov/mepsweb/survey_comp/Insurance.jsp
Suggested Citation
Crimmel, B.L., Offer Rates, Enrollment Rates, Premiums, and Employee Contributions for Employer-Sponsored Health Insurance in the Private Sector for the 10 Largest Metropolitan Areas, 2009. Statistical Brief #287. July 2010. Agency for Healthcare Research and Quality, Rockville, MD. http://www.meps.ahrq.gov/data_files/publications/st287/stat287.pdf
AHRQ welcomes questions and comments from readers of this publication who are interested in obtaining more information about access, cost, use, financing, and quality of health care in the United States. We also invite you to tell us how you are using this Statistical Brief and other MEPS data and tools and to share suggestions on how MEPS products might be enhanced to further meet your needs. Please e-mail us at mepsprojectdirector@ahrq.hhs.gov or send a letter to the address below:
Steven B. Cohen, PhD, Director
Center for Financing, Access, and Cost Trends
Agency for Healthcare Research and Quality
540 Gaither Road
Rockville, MD 20850
 |
|
|
 |
|
|
 |
|
|
 |
|
|
 |
|
|
 |
|
|