
|
|
Font Size:
|
||||
|
|
|
|
||||
STATISTICAL BRIEF #310:
Person Characteristics of the Elderly Reporting One or More Cognitive Disorders, 2007
Highlights
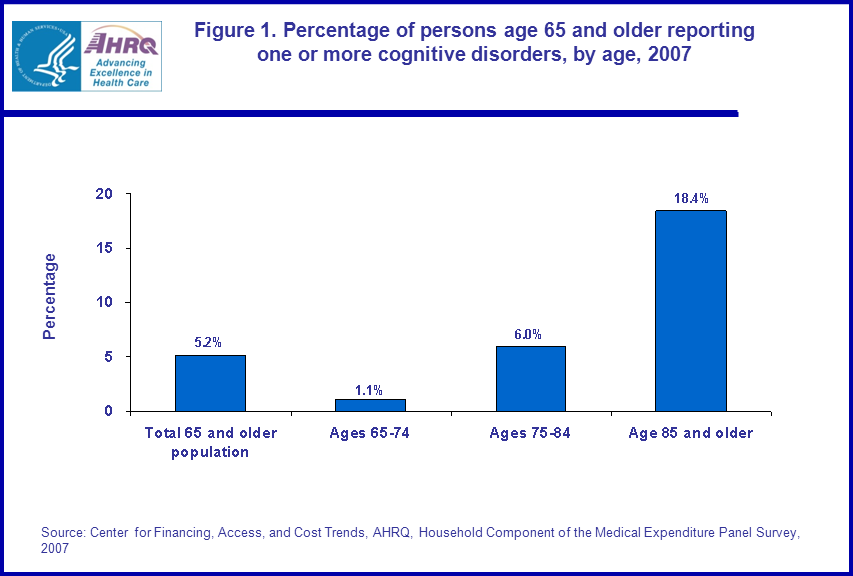
- In 2007, the percentage of persons age 85 and older reporting one or more cognitive disorders (18.4 percent) was higher than the percentage of persons ages 75-84 (6.0 percent) and persons ages 65-74 with cognitive disorders (1.1 percent).
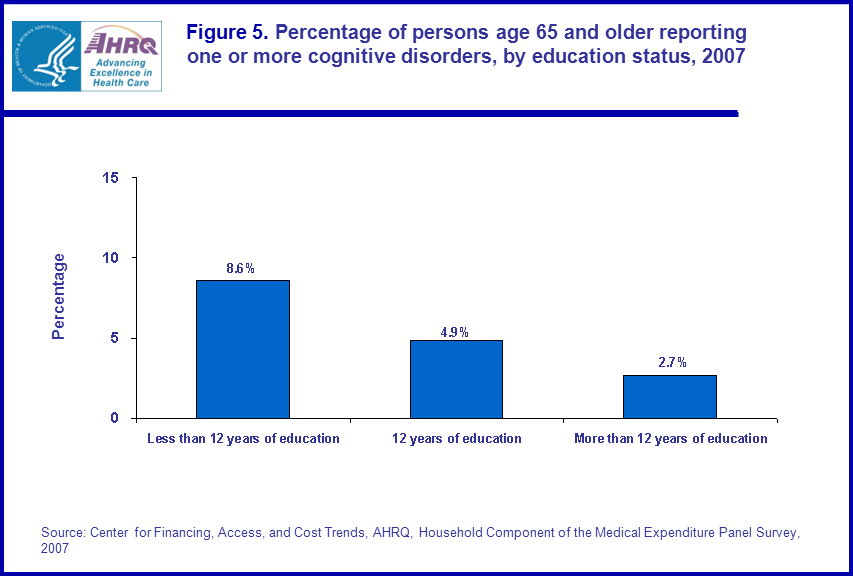
- A higher percentage of elderly persons completing less than 12 years of education reported one or more cognitive disorders (8.6 percent) when compared with elderly persons reporting 12 years of education (4.9 percent) and elderly reporting more than 12 years of education (2.7 percent) in 2007.
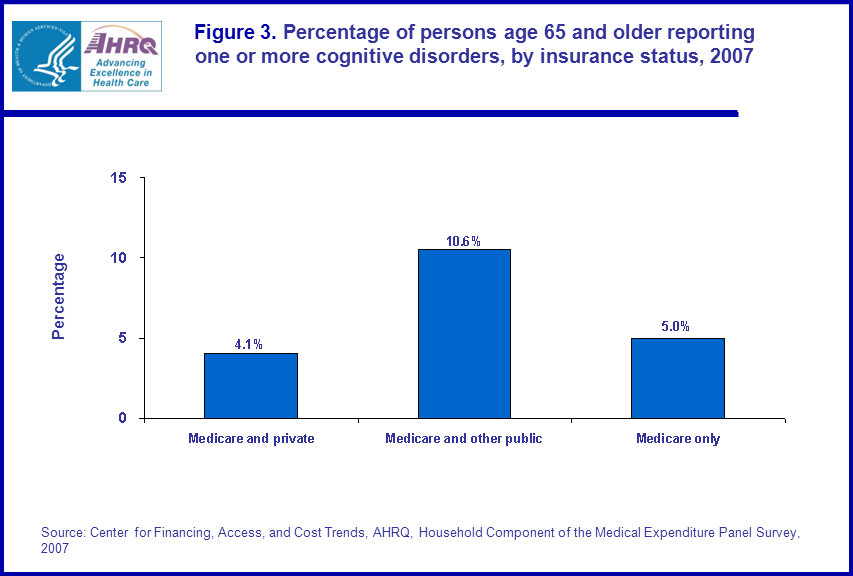
- During 2007, the percentage of elderly persons with Medicare and other public insurance reporting one or more cognitive disorders (10.6 percent) was higher than elderly persons with Medicare and any private insurance (4.1 percent) and elderly persons with Medicare only (5.0 percent).
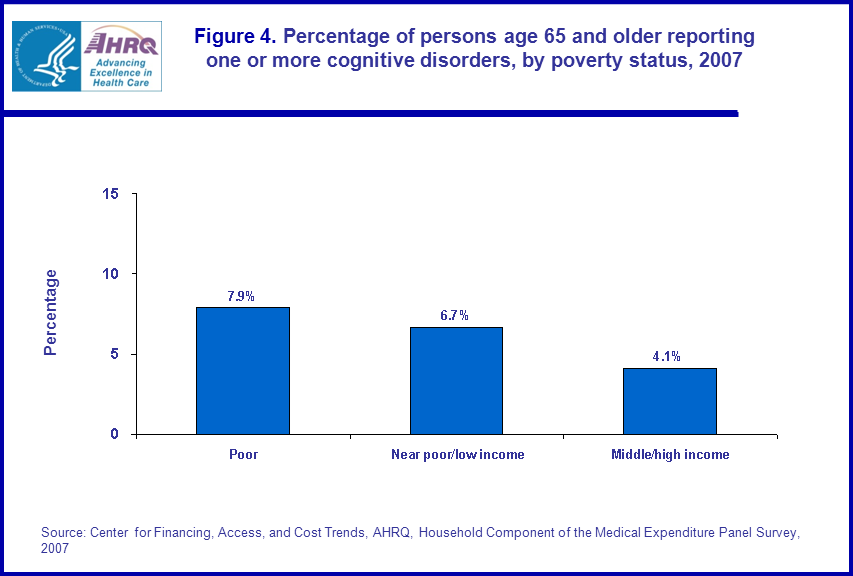
- In 2007, a lower percentage of elderly persons with middle and high income reported one or more cognitive disorders (4.1 percent) than elderly persons that were poor (7.9 percent) or elderly persons that were near poor and had low income (6.7 percent).
Introduction
This Statistical Brief presents estimates for adults age 65 and older (elderly) reporting one or more cognitive disorders in 2007. Estimates are presented for subgroups defined by age, sex, insurance status, poverty status, and education status. Average annual expenditures for those reporting and not reporting one or more cognitive disorders by age are also compared. The estimates are for the U.S. civilian noninstitutionalized population and are derived from the 2007 Household Component of the Medical Expenditure Panel Survey (MEPS-HC).Cognitive disorders are conditions that hinder a person's cognitive functioning including reasoning and memory. Many cognitive disorders result in impairment of a person's ability to carry out everyday activities and being dependent on others for their care. This Brief provides estimates to gain a better understanding of which subpopulations of the U.S. civilian noninstitutionalized population have these types of disorders.
All differences discussed in the text are statistically significant at the 0.05 level.
Findings
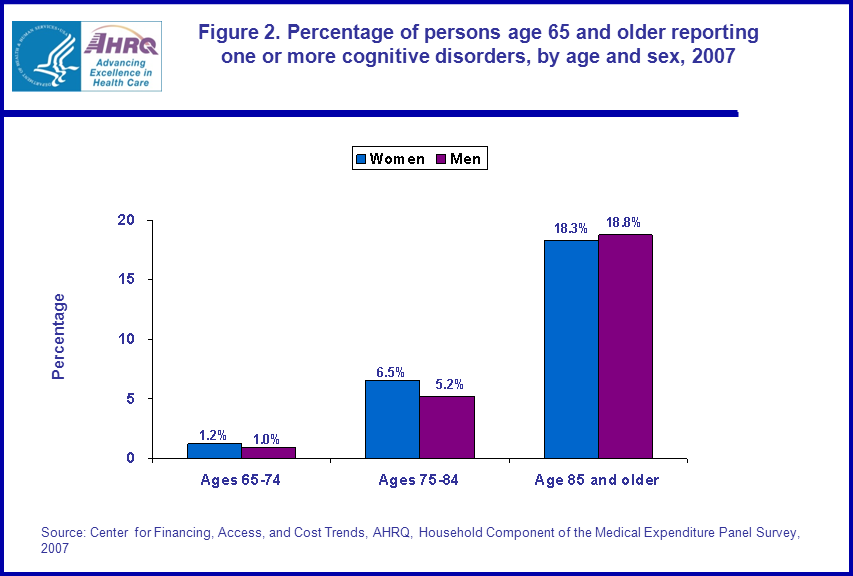
In 2007, 5.2 percent of the 38.7 million persons age 65 and older (elderly persons) in the U.S. civilian noninstitutionalized population reported having one or more cognitive disorders. A higher percentage of elderly persons age 85 and older reported one or more cognitive disorders (18.4 percent) when compared with elderly persons ages 75-84 (6.0 percent) and elderly persons ages 65-74 (1.1 percent). Moreover, the percentage of elderly persons ages 75-84 reporting one or more cognitive disorders was higher than the percentage of persons ages 65-74 reporting one or more cognitive disorders (figure 1).There were no significant differences when comparing the percentage of elderly women and elderly men reporting one or more cognitive disorders by the following age groups: ages 65-74 (1.2 and 1.0 percent, respectively), ages 75-84 (6.5 percent and 5.2 percent), and those age 85 and older (18.3 percent and 18.8 percent) in 2007 (figure 2).
In 2007, elderly Medicare beneficiaries with supplementary public insurance had a higher percentage of persons reporting one or more cognitive disorders (10.6 percent) than elderly Medicare beneficiaries with supplementary private insurance (4.1 percent) and elderly persons with Medicare only (5.0 percent) (figure 3).
The percentage of elderly persons reporting one or more cognitive disorders was higher for persons completing less than 12 years of education (8.6 percent) when compared with elderly persons reporting 12 years of education (4.9 percent) and elderly persons reporting more than 12 years of education (2.7 percent) in 2007. Furthermore, elderly persons completing 12 years of education had a greater percentage reporting one or more cognitive disorders (4.9 percent) than those elderly persons reporting more than 12 years of education (2.7 percent) (figure 5).
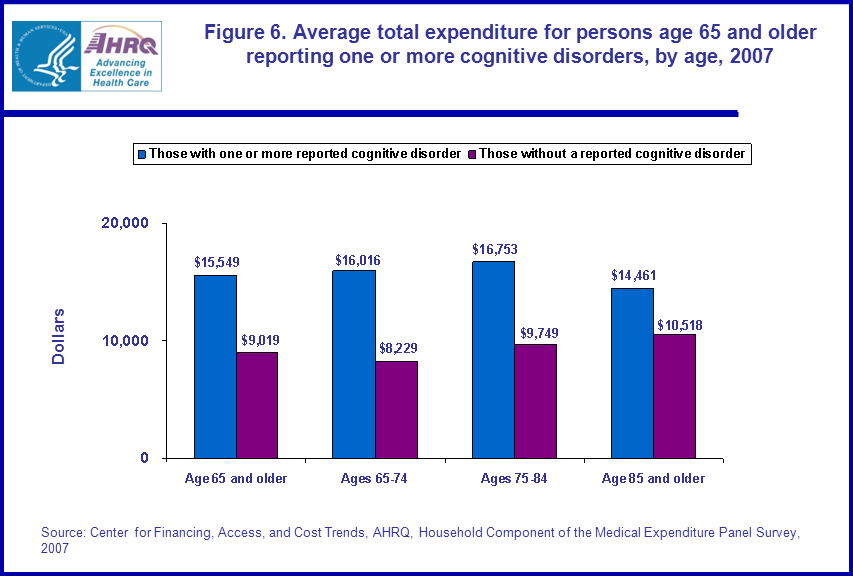
During 2007, when comparing average total expenditure for elderly persons with one or more cognitive disorders and those without a cognitive disorder by age, there were significant differences for the following age categories: ages 75-84 ($16,753 versus $9,749, respectively) and age 85 and older ($14,461 versus $10,518, respectively) (figure 6).
Data Source
The estimates shown in this Statistical Brief are based on data from MEPS HC-113: 2007 Full Year Consolidated Data File and MEPS HC-112: 2007 Medical Conditions File.Definitions/Methodology
Medical conditionsCondition data were collected from household respondents during each round as verbatim text and coded by professional coders using the International Classification of Diseases, Ninth Revision (ICD-9). ICD-9-CM condition codes were then aggregated into clinically meaningful categories that group similar conditions using the Clinical Classification System (CCS) software. Categories were collapsed when appropriate. Note that the reported ICD-9-CM condition code values were mapped to the appropriate clinical classification category prior to being collapsed to 3-digit ICD-9-CM condition codes. The result is that every record which has an ICD-9-CM diagnosis code also has a clinical classification code. For this Statistical Brief, the following CCS codes were used: Delirium, dementia, and amnestic and other cognitive disorders (CCS=653).
Age
Age was defined as the age of the person in the last survey round in 2007.
Health insurance status
Respondents were asked about health insurance coverage for themselves and all household members at each round of interviewing. The insurance variables reflect supplemental coverage, in addition to Medicare, that beneficiaries had for hospital and physician services. The insurance categories are mutually exclusive and hierarchical. Persons with more than one type of supplemental coverage were placed into an insurance category in the following order:
- Medicare and private insurance: This category includes persons classified as Medicare beneficiaries and covered by Medicare and a supplementary private policy.
- Medicare and other public insurance: This category includes persons classified as Medicare beneficiaries who met both of the following criteria: 1) they were not covered by private insurance at any point during the year, and 2) they were covered by one of the following public programs at any point during the year: Medicaid, other public hospital/physician coverage.
- Medicare HMO/Medicare only: This category includes persons classified as Medicare beneficiaries but not classified as Medicare and private insurance or as Medicare and other public insurance. This group includes persons who were enrolled in Medicare HMOs and persons who had Medicare fee-for-service coverage only. This includes a small number of persons age 65 and older that reported no insurance coverage.
Each year, persons were classified according to their family's income in terms of poverty status. In this report, poverty status is the ratio of the family's income to the Federal poverty thresholds, which control for the size of the family and the age of the head of the family. The following classification of poverty status was used:
- Poor: Persons in families with income less than 100 percent of the poverty line, including those who reported negative income.
- Near poor/low income: Persons in families with income of 100 percent of the poverty line through 200 percent of the poverty line.
- Middle income/high income: Persons in families with income over 200 percent of the poverty line.
Measured as the highest level of education each individual has attained, as of the date they first entered MEPS. The following three education categories were used:
- Less than 12 years of education.
- 12 years of education.
- More than 12 years of education.
Expenditures in MEPS are defined as payments from all sources for hospital inpatient care, ambulatory care provided in offices and hospital outpatient departments, care provided in emergency departments, paid care provided in the patient's home (home health), and the purchase of prescribed medications. Sources include direct payments from individuals, private insurance, Medicare, Medicaid, Workers' Compensation, and miscellaneous other sources. These expenditures do not include over-the-counter medications used for the treatment of any condition.
About MEPS-HC
MEPS-HC is a nationally representative longitudinal survey that collects detailed information on health care utilization and expenditures, health insurance, and health status, as well as a wide variety of social, demographic, and economic characteristics for the U.S. civilian noninstitutionalized population. It is cosponsored by the Agency for Healthcare Research and Quality and the National Center for Health Statistics.For more information about MEPS, call the MEPS information coordinator at AHRQ (301) 427-1656 or visit the MEPS Web site at http://www.meps.ahrq.gov/.
References
For a detailed description of the MEPS-HC survey design, sample design, and methods used to minimize sources of nonsampling error, see the following publications:Cohen, J. Design and Methods of the Medical Expenditure Panel Survey Household Component. MEPS Methodology Report No. 1. AHCPR Pub. No. 97-0026. Rockville, MD. Agency for Health Care Policy and Research, 1997. http://www.meps.ahrq.gov/mepsweb/data_files/publications/mr1/mr1.shtml
Cohen, S. Sample Design of the 1996 Medical Expenditure Panel Survey Household Component. MEPS Methodology Report No. 2. AHCPR Pub. No. 97-0027. Rockville, MD. Agency for Health Care Policy and Research, 1997. http://www.meps.ahrq.gov/mepsweb/data_files/publications/mr2/mr2.shtml
Cohen, S. Design Strategies and Innovations in the Medical Expenditure Panel Survey. Medical Care, July 2003: 41(7) Supplement: III-5-III-12.
Ezzati-Rice, T.M., Rohde, F., Greenblatt, J. Sample Design of the Medical Expenditure Panel Survey Household Component, 1998-2007. Methodology Report No. 22. March 2008. Agency for Healthcare Research and Quality, Rockville, MD. http://www.meps.ahrq.gov/mepsweb/data_files/publications/mr22/mr22.shtml
Suggested Citation
Stagnitti, M.N. Person Characteristics of the Elderly Reporting One or More Cognitive Disorders, 2007. Statistical Brief #310. January 2011. Agency for Healthcare Research and Quality, Rockville, MD. http://www.meps.ahrq.gov/mepsweb/data_files/publications/st310/stat310.shtmlAHRQ welcomes questions and comments from readers of this publication who are interested in obtaining more information about access, cost, use, financing, and quality of health care in the United States. We also invite you to tell us how you are using this Statistical Brief and other MEPS data and tools and to share suggestions on how MEPS products might be enhanced to further meet your needs. Please e-mail us at mepspd@ahrq.gov or send a letter to the address below:
Steven B. Cohen, PhD, Director
Center for Financing, Access, and Cost Trends
Agency for Healthcare Research and Quality
540 Gaither Road
Rockville, MD 20850
 |
|||||||||||||||||||||||||
|
|||||||||||||||||||||||||
|
|
|||||||||||||||||||||||||
 |
|||||||||||||||||||||||||
|
|||||||||||||||||||||||||
|
|
|||||||||||||||||||||||||
 |
|||||||||||||||||||||||||
|
|||||||||||||||||||||||||
|
|
|||||||||||||||||||||||||
 |
|||||||||||||||||||||||||
|
|||||||||||||||||||||||||
|
|
|||||||||||||||||||||||||
 |
|||||||||||||||||||||||||
|
|||||||||||||||||||||||||
|
|
|||||||||||||||||||||||||
 |
|||||||||||||||||||||||||
|
|||||||||||||||||||||||||
|
|
|||||||||||||||||||||||||


