 |  |
STATISTICAL BRIEF #318
|
|
Hospital ambulatory settings were more likely to have no out-of-pocket payments for a physician visit than those occurring in office-based settings (58 percent versus 44 percent—see table 1). However, average out-of-pocket expenses were higher in hospital than OB settings among visits where some payments were made ($102–$121 versus $29). The top 10 percent out-of-pocket payments (i.e., 90th percentiles) were $50 or more for OB visits versus $228 and $242 or more for ER and OP visits, respectively.
Variation in selected patient characteristics by setting
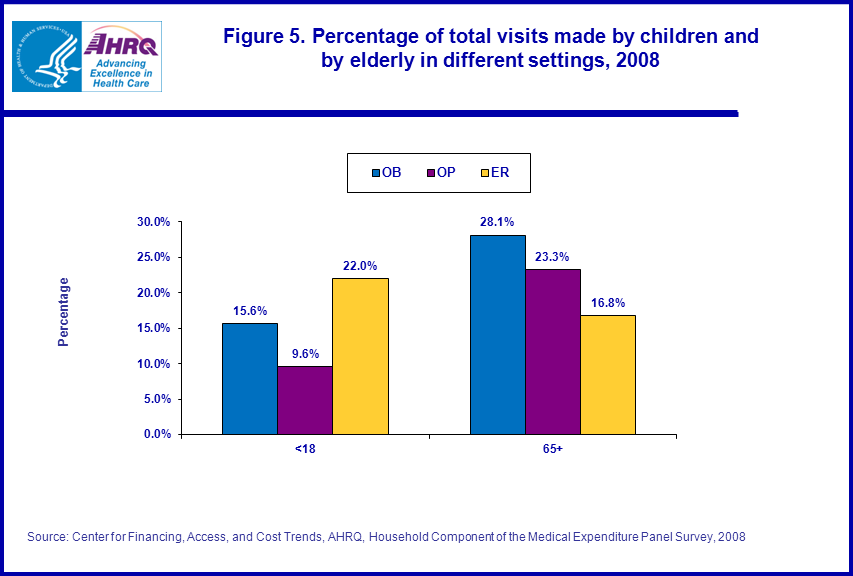
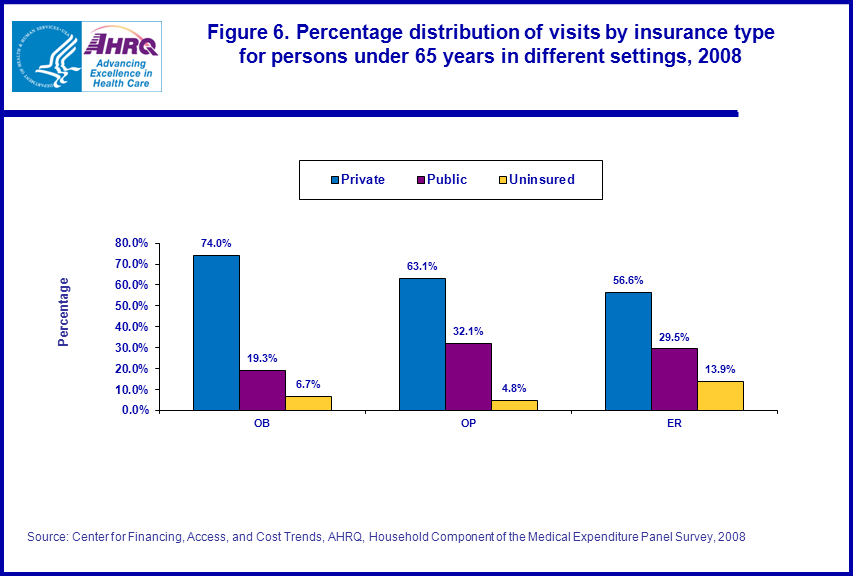
In addition to variation in types of services provided and general costs associated with delivering care in different settings, a variety of other factors contribute to variations in expenses across settings such as patient’s age, insurance coverage status and types of conditions treated. For example, among the three settings, ER had the highest proportion of visits from children and the lowest proportion from the population age 65 and over, which is almost entirely covered by Medicare (figure 5). In addition, among persons under age 65, the ER setting had the highest proportion of visits from uninsured persons while the OB setting had the highest proportion of privately insured persons (figure 6).
Reported medical conditions by setting
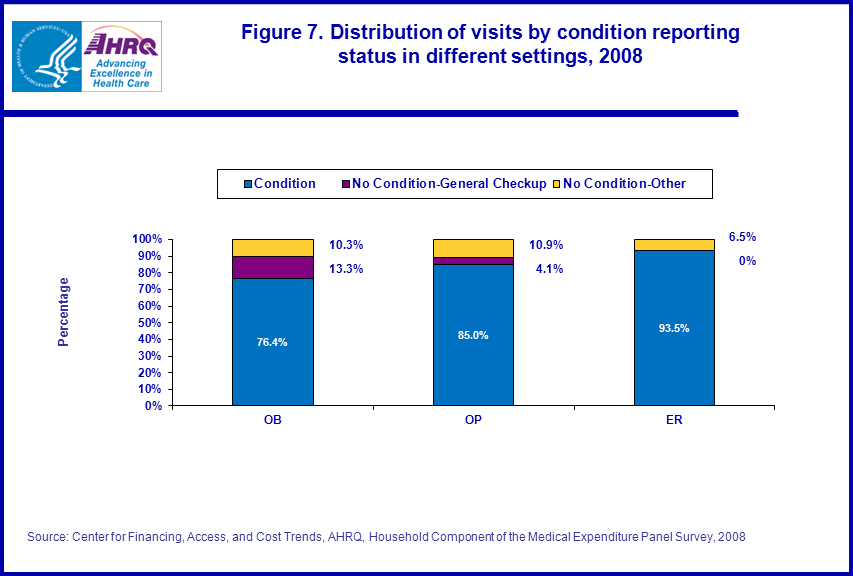
ER visits were the most likely (94 percent) and OB visits were the least likely (76 percent) to have a medical condition reported as associated with the patient’s visit (figure 7). Moreover, among visits with a reported condition, the five most common conditions varied across the three settings (table 2). Trauma was by far the most common first-listed condition among ER visits (27 percent) while mental disorders (14.7 percent) and cancer (13.2 percent) together accounted for a similar proportion of OP visits. There was less concentration among types of conditions reported for OB visits, with the five most common conditions (hypertension, mental disorders, trauma, COPD/asthma, and cancer) each accounting for 6.1–8.5 percent of visits and together comprising just over one-third of all OB visits. Over half of the 24 percent of OB visits with no specific condition were reported as being for a general check-up (figure 7).
Data Source
The estimates in this Statistical Brief are produced from the MEPS Office-Based Medical Provider Visits File (HC-118G), Outpatient Visits File (HC-118F), and Emergency Room Visits File (HC-118E) for 2008. Demographic information was linked from the MEPS 2008 Full Year Consolidated Data File (HC-121).Definitions
AgeMost sample persons were classified according to their age on December 31 of the year they participated in the survey. However, age for a small proportion of persons was based on the date earlier in the year when they were last considered to be in-scope for the survey (e.g., before death, entering the military, or moving to an institution).
Insurance coverage
Persons under age 65 were classified into three insurance categories as follows:
- Private: Person had any private insurance coverage (including TRICARE) any time during year
- Public only: Person had only public insurance coverage for all or part of year
- Uninsured: Person was uninsured all of year
Total expenditures are defined as the sum of payments for visits from all sources including individuals/families (i.e., out-of-pocket), private insurance policies, Medicare, Medicaid, Workers’ Compensation, and miscellaneous other sources.
Medical conditions
In MEPS, conditions are recorded verbatim by interviewers in connection with any household reported health care event (i.e., including the OB, OP, and ER visits discussed in this Brief). While there is usually one medical condition reported for a visit, in some instances no condition or multiple conditions are reported. Condition categories shown in this Brief are based on the AHRQ Clinical Classification Code (CCC) system: (http://www.hcup-us.ahrq.gov/toolssoftware/ccs/ccs.jsp), with first-listed conditions in MEPS data files used to classify visits.
About MEPS-HC and MEPS-MPC
The MEPS Household Component (HC) is a nationally representative longitudinal survey that collects detailed information on health care utilization and expenditures, health insurance, and health status, as well as a wide variety of social, demographic, and economic characteristics for the U.S. civilian noninstitutionalized population. It is cosponsored by the Agency for Healthcare Research and Quality and the National Center for Health Statistics.The MEPS Medical Provider Component (MPC) collects information on dates of visit, diagnoses and procedures, and charges and payments from a sample of medical providers who provided care to persons in the survey. The MPC data collected are generally used as the primary source of MEPS expenditure data and are also used to impute expenditure information not reported by household respondents.
For more information about MEPS, call the MEPS information coordinator at AHRQ (301) 427-1406 or visit the MEPS Web site at http://www.meps.ahrq.gov.
References
Cohen, J., Cohen S., and Banthin, J. The Medical Expenditure Panel Survey: A National Information Resource to Support Healthcare Cost Research and Inform Policy and Practice. Medical Care 2009, 47(7), Supplement, pp. S44–S50.Cohen, J. Design and Methods of the Medical Expenditure Panel Survey Household Component. MEPS Methodology Report No. 1. AHCPR Pub. No. 97-0026. Rockville, MD: Agency for Healthcare Policy and Research, 1997. http://www.meps.ahrq.gov/mepsweb/data_files/publications/mr1/mr1.shtml
Ezzati-Rice, T.M., Rohde, F., Greenblatt, J. Sample Design of the Medical Expenditure Panel Survey Household Component, 1998–2007. Methodology Report No. 22. March 2008. Agency for Healthcare Research and Quality, Rockville, MD. http://www.meps.ahrq.gov/mepsweb/data_files/publications/mr22/mr22.shtml
Suggested Citation
Machlin, S., and Chowdhury, S. Expenses for Physician Visits in Different Ambulatory Care Settings. Statistical Brief #318. March 2011. Agency for Healthcare Research and Quality, Rockville, MD. http://www.meps.ahrq.gov/mepsweb/data_files/publications/st318/stat318.pdfAHRQ welcomes questions and comments from readers of this publication who are interested in obtaining more information about access, cost, use, financing, and quality of health care in the United States. We also invite you to tell us how you are using this Statistical Brief and other MEPS data and tools and to share suggestions on how MEPS products might be enhanced to further meet your needs. Please e-mail us at mepspd@ahrq.gov or send a letter to the address below:
Steven B. Cohen, PhD, Director
Center for Financing, Access, and Cost Trends
Agency for Healthcare Research and Quality
540 Gaither Road
Rockville, MD 20850
 |
|
|
 |
|
|
 |
|
|
 |
|
|
 |
|
|
 |
|
|
 |
|
|