
|
|
Font Size:
|
||||
|
|
|
|
||||
STATISTICAL BRIEF #455:
The Concentration of Health Care Expenditures and Related Expenses for Costly Medical Conditions, 2012
Highlights
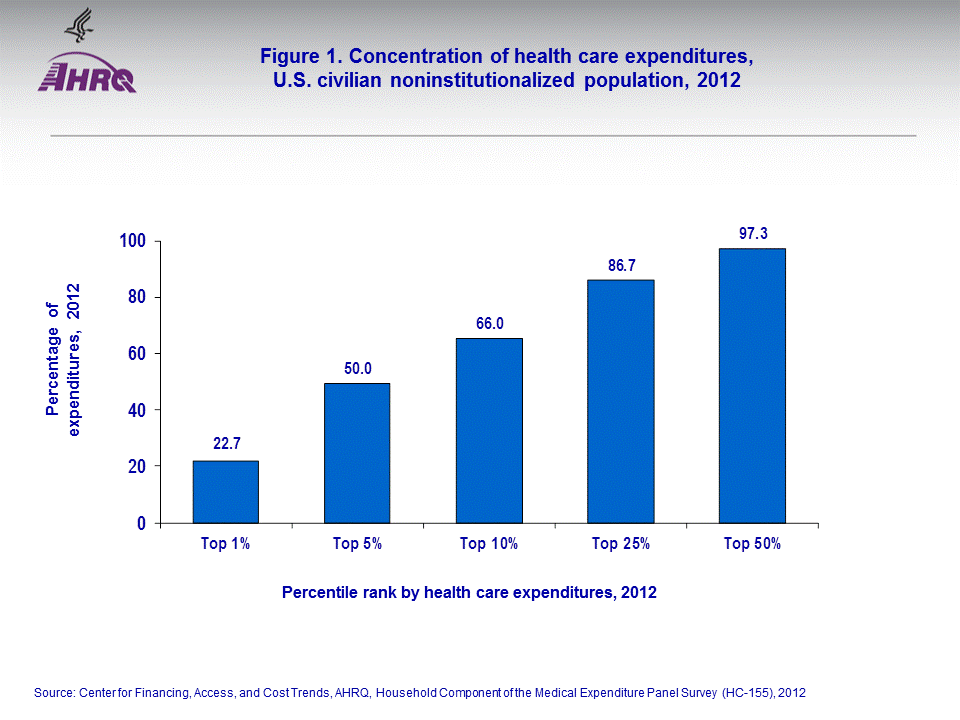
- In 2009, 1 percent of the population accounted for 22.7 percent of total health care expenditures and 5 percent of the population accounted for 50 percent of overall health care spending. The bottom half of the expenditure distribution accounted for only 2.7 percent of spending in 2012.
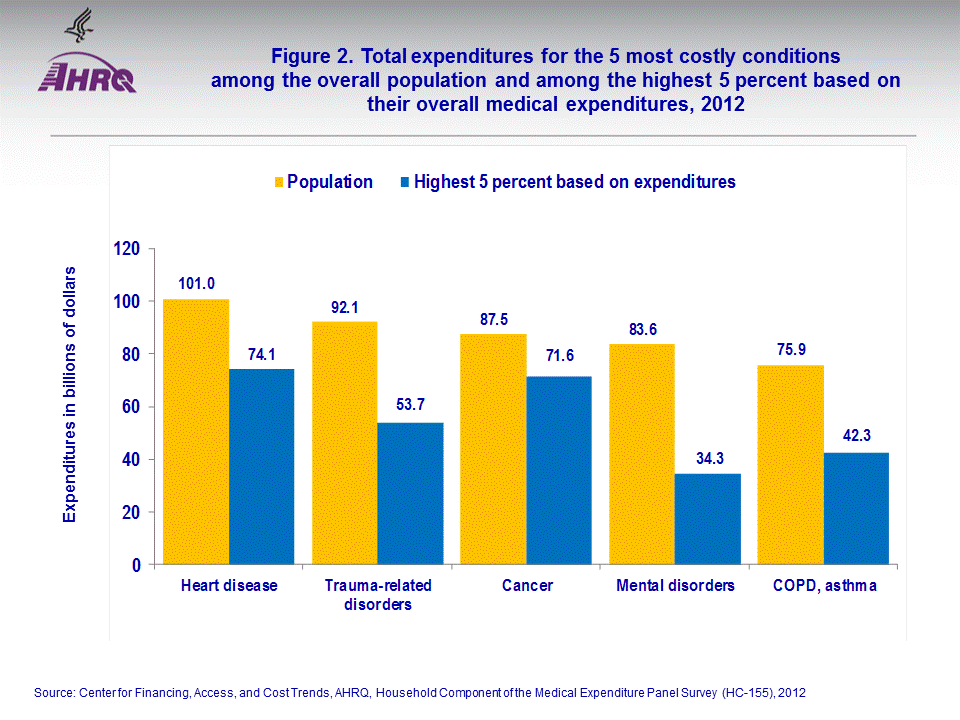
- The top 5 most costly medical conditions in terms of health care expenditures were heart disease, trauma-related disorders, cancer, mental disorders, and COPD/asthma.
- The top 5 percent of the population based on their health care expenditures also accounted for a large component of the health care expenditures associated with the treatment of the 5 highest cost medical conditions. They incurred about three-quarters of the overall expenditures for the treatment of heart disease and cancer, and ranged from 40 to 60 percent of total expenditures for treatment of trauma-related disorders, mental disorders, and asthma.
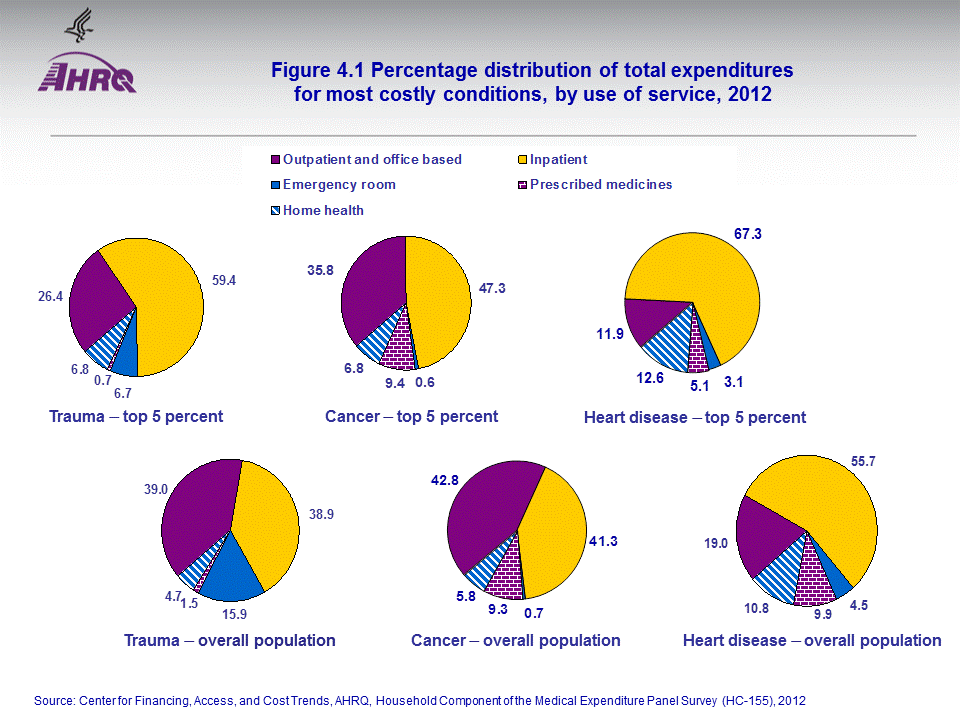
- These high cost patients had a higher portion of health expenditures allocated for the treatment of trauma, mental disorders and COPD/asthma and heart disease in an inpatient setting, compared with the overall population. In addition, these high cost individuals had a lower portion of health expenses tied to prescribed medicines for the treatment of mental disorders, asthma, and heart disease relative to the overall population.
- A lower percentage of health care expenditures associated with care for trauma-related disorders and COPD/asthma was paid out of pocket by these high cost patients relative to the overall population.
Introduction
Estimates of health care expenses for the U.S. civilian noninstitutionalized (community) population are critical to policymakers and others concerned with access to medical care and the cost and sources of payment for that care. In 2012, health care expenses among the U.S. community population totaled $1.35 trillion. Medical care expenses, however, are highly concentrated among a relatively small proportion of individuals in the community population. As reported previously in 1996, the top 1 percent of the U.S. population accounted for 28 percent of the total health care expenditures and the top 5 percent for more than half. More recent data have revealed that over time there has been some decrease in the extent of this concentration at the upper tail of the expenditure distribution. Furthermore, medical expenditures have been concentrated for the treatment of certain types of highly prevalent conditions or for which treatment often entails the use of high cost services.Using information from the Household Component of the Medical Expenditure Panel Survey (MEPS-HC) for 2012, this report provides detailed estimates of the concentration of health care expenditures further examined by costs associated with care in treating the most costly medical conditions. Studies that examine the concentration of high levels of expenditures are essential to help discern the factors most likely to drive health care spending and the characteristics of the individuals who incur them. The MEPS-HC data are particularly well suited for measuring the concentration of health care expenditures and the cost of care associated with medical conditions. This Brief compares the health care spending for the overall population with the expenses for the top 5 percent of the population based on spending in 2012. All differences between estimates discussed in the text are statistically significant at the 0.05 level unless otherwise noted.
Findings
In 2012, the top 1 percent ranked by their health care expenses accounted for 22.7 percent of total health care expenditures with an annual mean expenditure of $97,956 (figure 1). The top 5 percent of the population accounted for 50.0 percent of total expenditures with an annual mean expenditure of $43,058. In addition, the top 10 percent of the population accounted for 66.0 percent of total expenditures with an annual mean expenditure of $28,468. Overall, the top 50 percent of the population ranked by their expenditures accounted for 97.3 percent of overall health care expenditures while the lower 50 percent accounted for only 2.7 percent of the total. Those individuals ranked in the top half of the health care expenditure distribution had an annual mean expenditure of $8,384 (dollar amounts not shown). Based on chronic condition status, persons with four or more chronic conditions had the lowest concentrated levels of health care expenditures and the highest annual mean expenses at the top quantiles of the expenditure distribution (Cohen, 2014).In 2012, the top 5 most costly medical conditions in terms of health care expenditures were heart disease, trauma-related disorders, cancer, mental disorders, and chronic obstructive pulmonary disease (COPD)/asthma. Overall health care expenditures for the treatment of heart disease totaled $101 billion with an annual mean expenditure of $4,349 per person with an expense. Expenditures associated with trauma-related disorders totaled $92.1 billion with an annual mean expenditure of $2,609 per person with an expense. Health care expenditures for the treatment of cancer totaled $87.5 billion with an annual mean expenditure of $5,631 per person with an expense. In addition, expenses for the treatment of mental disorders totaled $83.6 billion with an annual mean expenditure of $1,849 per person with an expense. Overall health care expenditures for the treatment of COPD/asthma totaled $75.9 billion with an annual mean expenditure of $1,681 per person with an expense (figure 2).
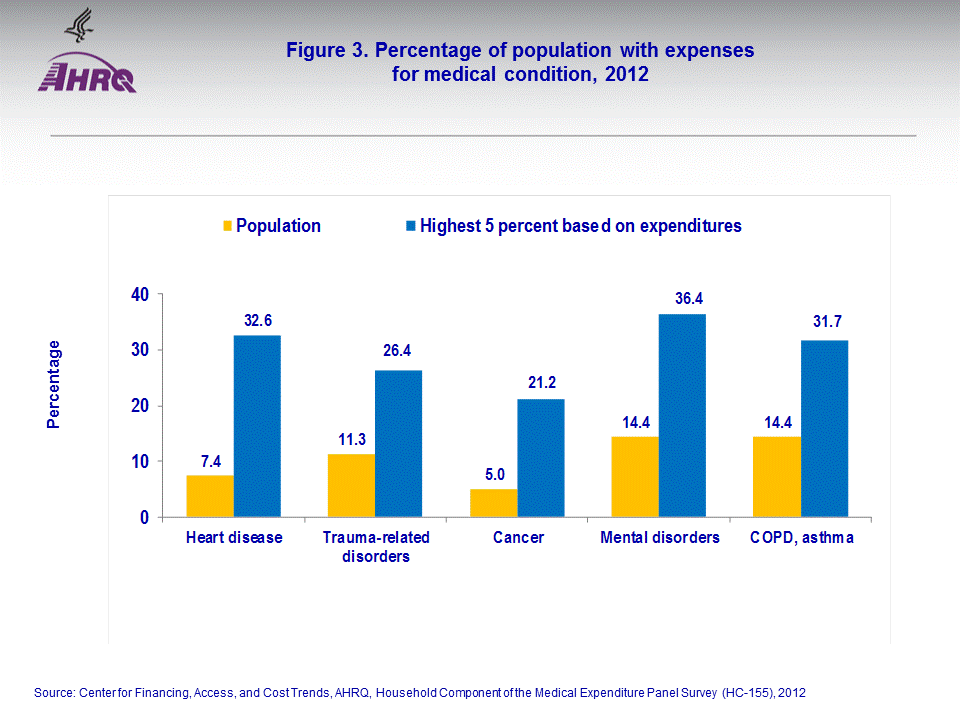
Health expenditures associated with trauma-related disorders for these individuals with highly concentrated levels of medical expenditures in 2012 totaled $53.7 billion, accounting for 58.3 percent of the overall spending on trauma care, with an annual mean expenditure of $12,975 per person with an expense. Of these individuals, 26.4 percent had expenses for the treatment of trauma relative to only 11.3 percent for the overall population. This subset of the population also spent $34.3 billion for the treatment of mental disorders, accounting for 41.0 percent of the overall spending on mental disorders, with an annual mean expenditure of $6,003. Of these individuals, 36.4 percent had expenses for the treatment of mental disorders relative to only 14.4 percent for the overall population (figure 3).
Health expenditures associated with COPD/asthma for these individuals totaled $42.3 billion, accounting for 55.7 percent of the overall spending on asthma, with an annual mean expenditure of $8,533 per person with an expense. Of these individuals, 31.7 percent had expenses for the treatment of asthma relative to 14.4 percent for the overall population (figures 2 and 3).
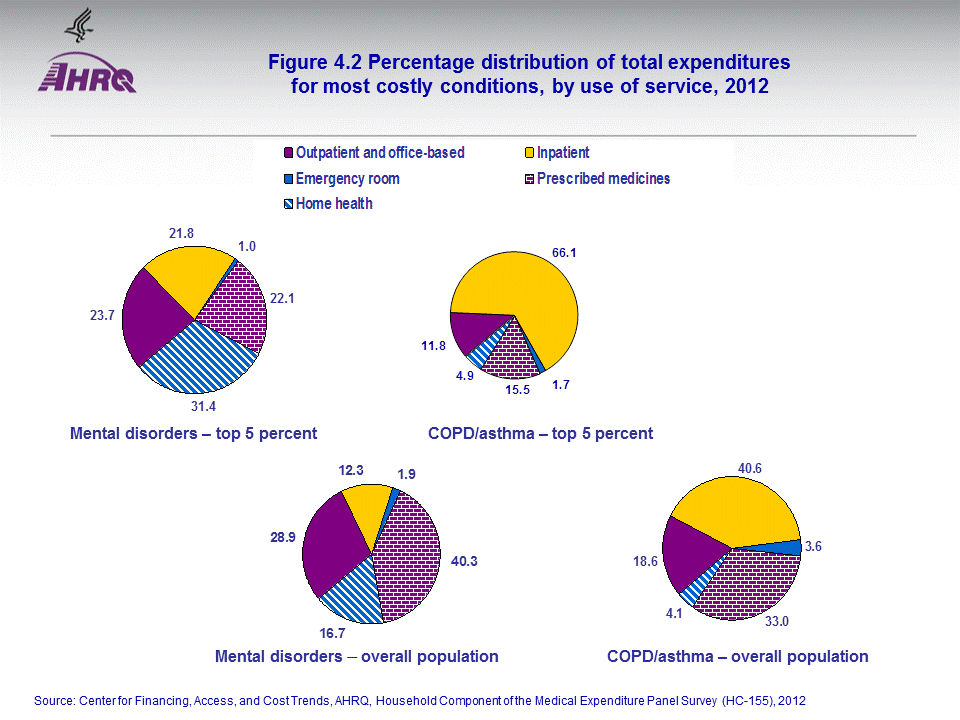
An examination of the expenditure distributions by type of service for treatment of the medical conditions under study also revealed a number of differences between these most expensive 5 percent of patients and the overall population. A higher percentage of health care expenditures associated with trauma-related disorders (59.4 percent), mental disorders (21.8 percent), and COPD/asthma (66.1) were for care received in an inpatient setting relative to inpatient treatment expenses for trauma (38.9 percent), mental disorders (12.3 percent), and COPD/asthma (40.6 percent) occurring in the overall population. In contrast, a lower percentage of health care expenditures associated with trauma-related disorders for the top 5 percent were for care received in emergency room (6.7 percent), and office-based and outpatient settings (26.4 percent) relative to emergency room (15.9 percent) and outpatient and office-based settings (39.0 percent) for trauma occurring in the overall population. In addition, the top 5 percent had a lower percentage of health care expenditures associated with prescribed medicines for mental disorders (22.1 percent), COPD/asthma (15.5 percent), and heart disease (5.1 percent) relative to prescribed medicine expenses for these conditions in the overall population (40.3 percent, 33.0 percent, and 9.9 percent, respectively) (figures 4.1 and 4.2).
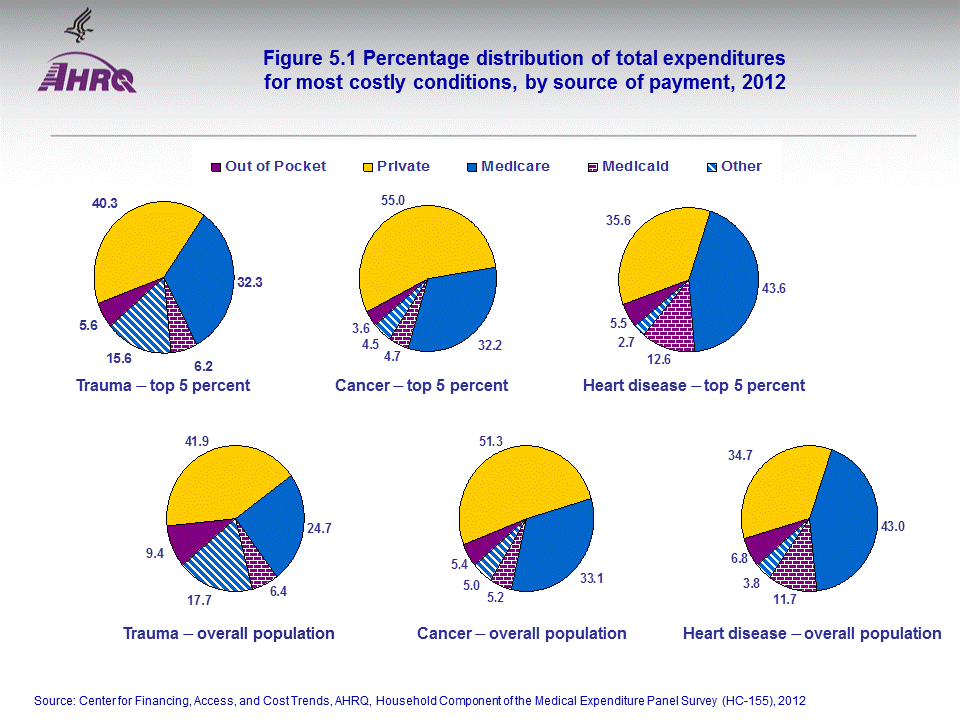
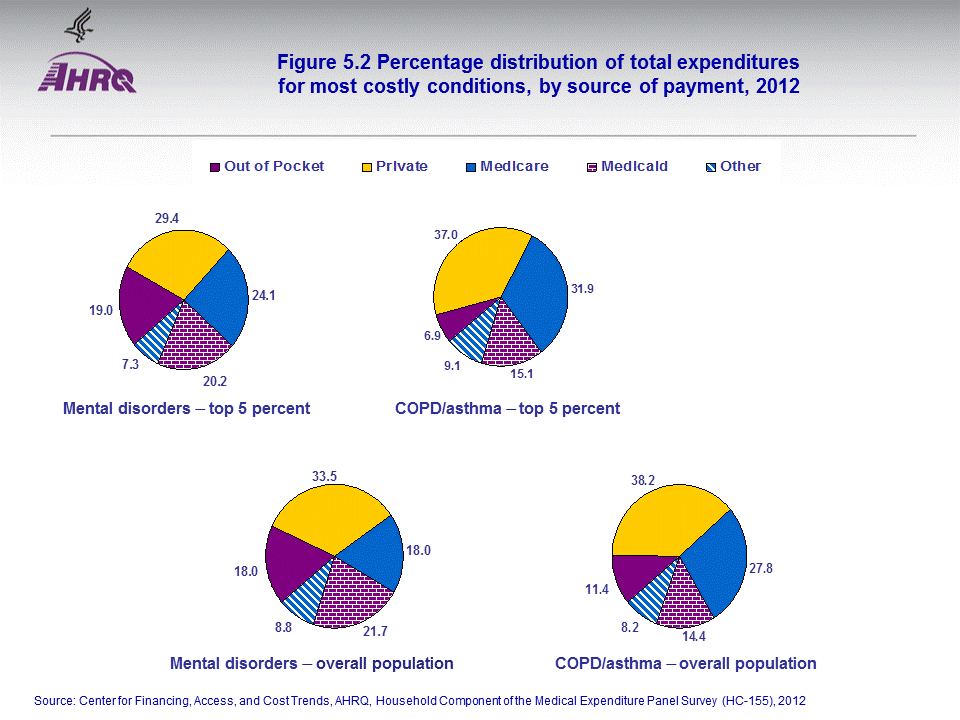
A comparison of the expenditure distributions by source of payment for care associated with these high cost medical conditions also revealed some differences between these most expensive patients and the overall population. A lower percentage of health care expenditures associated with care for trauma-related disorders and COPD/asthma was paid out of pocket (5.6 percent and 6.9 percent, respectively) by these individuals with high levels of medical expenditures relative to out-of-pocket expenses for treatment of these conditions in the overall population (9.4 percent and 11.4 percent, respectively) (figures 5.1 and 5.2).
Data Source
The estimates shown in this Statistical Brief are drawn from analyses conducted by the MEPS staff from the following 2012 public use files: Full Year Consolidated Data File (HC-155), Medical Conditions File (HC-154), Office-Based Medical Provider Visits File (HC-152G), Outpatient Visits File (HC-152F), Hospital Inpatient Stays File (HC-152D), Home Health File (HC-152H), Emergency Room Visits File (HC-152E), Prescribed Medicines File (HC-152A), and Condition-Event Link File (HC-152I File 1).Definitions
*All child birth related expenditures were excluded from the top 10 most costly conditions.Medical conditions
Condition data were collected from household respondents during each round as verbatim text and coded by professional coders using the International Classification of Diseases, Ninth Revision (ICD-9). ICD-9-CM condition codes were then aggregated into clinically meaningful categories that group similar conditions using the Clinical Classification System (CCS) software. Categories were collapsed when appropriate. The reported ICD-9-CM condition code values were mapped to the appropriate clinical classification category prior to being collapsed to 3-digit ICD-9-CM condition codes. The result is that every record that has an ICD-9-CM diagnosis code also has a clinical classification code.
Expenditures
Expenditures in MEPS are defined as payments from all sources for hospital inpatient care, ambulatory care provided in offices and hospital outpatient departments, care provided in emergency departments, paid care provided in the patient's home (home health), and the purchase of prescribed medications. Sources include direct payments from individuals, private insurance, Medicare, Medicaid, Workers' Compensation, and miscellaneous other sources. Payments for over-the-counter drugs are not included in MEPS total expenditures. Indirect payments not related to specific medical events, such as Medicaid Disproportionate Share and Medicare Direct Medical Education subsidies, are also excluded. Expenditures were classified with a condition if a visit, stay, or medication purchase was cited as being related to the specific condition. Expenditures may be associated with more than one condition and are not unduplicated in the condition totals; summing over conditions would double-count some expenses. While total spending estimates include amounts for other medical expenses, such as durable and nondurable supplies, medical equipment, eyeglasses, ambulance services, and dental expenses, they are not included in the expenditure estimates associated with medical conditions because these items could not be linked to specific conditions.
Sources of payment
- Private insurance: This category includes payments made by insurance plans covering hospital and other medical care (excluding payments from Medicare, Medicaid, and other public sources), Medigap plans, and TRICARE (Armed Forces-related coverage).
- Medicare: Medicare is a federally financed health insurance plan for the elderly, persons receiving Social Security disability payments, and persons with end-stage renal disease. Medicare Part A, which provides hospital insurance, is automatically given to those who are eligible for Social Security. Medicare Part B provides supplementary medical insurance that pays for medical expenses and can be purchased for a monthly premium. Medicare Part D, which started in 2006, covers prescription drug expenses.
- Medicaid/CHIP: This category includes payments made by the Medicaid and CHIP programs which are means-tested government programs financed jointly by federal and state funds that provide health care to those who are eligible. Medicaid is designed to provide health coverage to families and individuals who are unable to afford necessary medical care, while CHIP provides coverage to additional low income children not eligible for Medicaid. Eligibility criteria for both programs vary significantly by state.
- Out of pocket: This category includes expenses paid by the user or other family member.
- Other sources: This category includes payments from other federal sources such as Indian Health Service, military treatment facilities, and other care provided by the federal government; various state and local sources (community and neighborhood clinics, state and local health departments, and state programs other than Medicaid/CHIP); various unclassified sources (e.g., automobile, homeowner's, or other liability insurance, and other miscellaneous or unknown sources); Medicaid/CHIP payments reported for persons who were not reported as enrolled in the Medicaid or CHIP programs at any time during the year; and private insurance payments reported for persons without any reported private health insurance coverage during the year.
About MEPS-HC
MEPS-HC is a nationally representative longitudinal survey that collects detailed information on health care utilization and expenditures, health insurance, and health status, as well as a wide variety of social, demographic, and economic characteristics for the U.S. civilian noninstitutionalized population. It is cosponsored by the Agency for Healthcare Research and Quality and the National Center for Health Statistics.For more information about MEPS, call the MEPS information coordinator at AHRQ (301-427-1406) or visit the MEPS Web site at http://www.meps.ahrq.gov/.
References
Cohen, J. Design and Methods of the Medical Expenditure Panel Survey Household Component. MEPS Methodology Report No. 1. AHCPR Pub. No. 97-0026. Rockville, MD: Agency for Healthcare Policy and Research, 1997. http://www.meps.ahrq.gov/mepsweb/data_files/publications/mr1/mr1.shtmlCohen, S. Design Strategies and Innovations in the Medical Expenditure Panel Survey. Medical Care, July 2003: 41(7) Supplement: III-5–III-12.
Cohen, S. Differentials in the Concentration of Health Expenditures across Population Subgroups in the U.S., 2012. Statistical Brief #448. September 2014. Agency for Healthcare Research and Quality, Rockville, MD. http://meps.ahrq.gov/mepsweb/data_files/publications/st448/stat448.shtml
Cohen, S. The Concentration and Persistence in the Level of Health Expenditures over Time: Estimates for the U.S. Population, 2011–2012. Statistical Brief #449. September 2014. Agency for Healthcare Research and Quality, Rockville, MD. http://www.meps.ahrq.gov/mepsweb/data_files/publications/st449/stat449.shtml
Cohen, S. The Concentration of Health Care Expenditures and Related Expenses for Costly Medical Conditions, 2009. Statistical Brief #359. February 2012. Agency for Healthcare Research and Quality, Rockville, MD. http://www.meps.ahrq.gov/mepsweb/data_files/publications/st359/stat359.shtml
Rohde, F., Greenblatt, J. Sample Design of the Medical Expenditure Panel Survey Household Component, 1998–2007. Methodology Report No. 22. March 2008. Agency for Healthcare Research and Quality, Rockville, MD. http://www.meps.ahrq.gov/mepsweb/data_files/publications/mr22/mr22.shtml
Soni, A. Top 10 Most Costly Conditions among Men and Women, 2008: Estimates for the U.S. Civilian Noninstitutionalized Adult Population, Age 18 and Older. Statistical Brief #331. July 2011. Agency for Healthcare Research and Quality, Rockville, MD. http://www.meps.ahrq.gov/mepsweb/data_files/publications/st331/stat331.shtml
Suggested Citation
Cohen, S. The Concentration of Health Care Expenditures and Related Expenses for Costly Medical Conditions, 2012. October 2014. Statistical Brief #455. Agency for Healthcare Research and Quality, Rockville, MD. http://www.meps.ahrq.gov/mepsweb/data_files/publications/st455/stat455.shtmlAHRQ welcomes questions and comments from readers of this publication who are interested in obtaining more information about access, cost, use, financing, and quality of health care in the United States. We also invite you to tell us how you are using this Statistical Brief and other MEPS data and tools and to share suggestions on how MEPS products might be enhanced to further meet your needs. Please email us at MEPSProjectDirector@ahrq.hhs.gov or send a letter to the address below:
Steven B. Cohen, PhD, Director
Center for Financing, Access, and Cost Trends
Agency for Healthcare Research and Quality
540 Gaither Road
Rockville, MD 20850
 |
||||||||||||||||||||||||||||||||||||||||||||||||
|
||||||||||||||||||||||||||||||||||||||||||||||||
|
|
||||||||||||||||||||||||||||||||||||||||||||||||
 |
||||||||||||||||||||||||||||||||||||||||||||||||
|
||||||||||||||||||||||||||||||||||||||||||||||||
|
|
||||||||||||||||||||||||||||||||||||||||||||||||
 |
||||||||||||||||||||||||||||||||||||||||||||||||
|
||||||||||||||||||||||||||||||||||||||||||||||||
|
|
||||||||||||||||||||||||||||||||||||||||||||||||
 |
||||||||||||||||||||||||||||||||||||||||||||||||
|
||||||||||||||||||||||||||||||||||||||||||||||||
|
|
||||||||||||||||||||||||||||||||||||||||||||||||
 |
||||||||||||||||||||||||||||||||||||||||||||||||
|
||||||||||||||||||||||||||||||||||||||||||||||||
|
|
||||||||||||||||||||||||||||||||||||||||||||||||
 |
||||||||||||||||||||||||||||||||||||||||||||||||
|
||||||||||||||||||||||||||||||||||||||||||||||||
|
|
||||||||||||||||||||||||||||||||||||||||||||||||
 |
||||||||||||||||||||||||||||||||||||||||||||||||
|
||||||||||||||||||||||||||||||||||||||||||||||||
|
|
||||||||||||||||||||||||||||||||||||||||||||||||


