
|
|
Font Size:
|
||||
|
|
|
|
||||
STATISTICAL BRIEF #459:
Changes in Statin Therapy among Adults (Age ≥ 18) by Selected Characteristics, United States, 2000–2001 to 2010–2011
Highlights
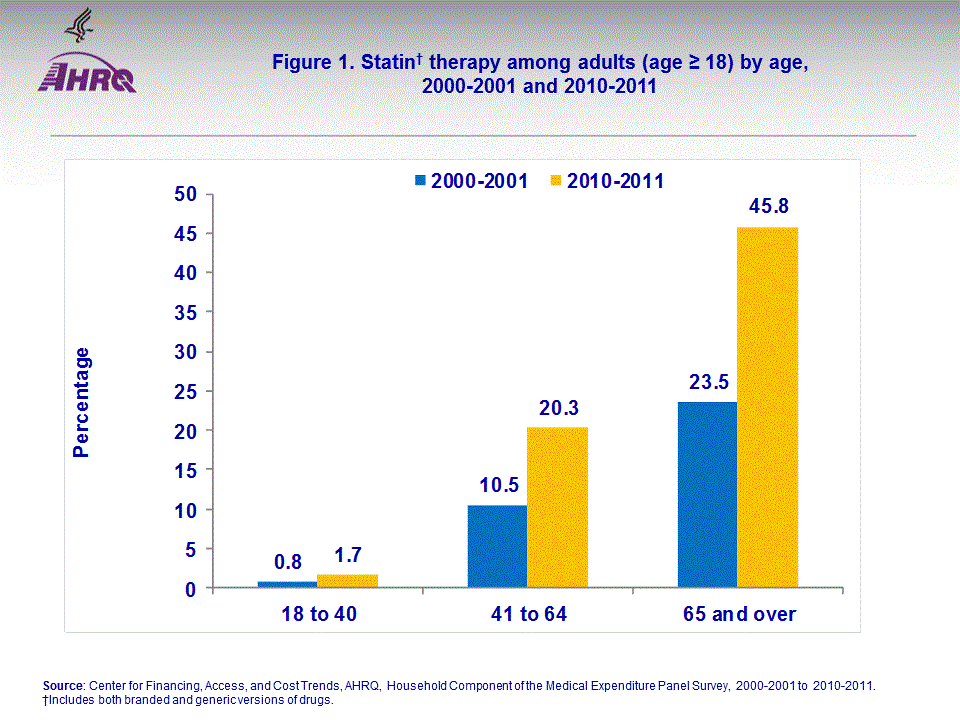
- Between 2000–2001 and 2010–2011, the average annual percentage of adults who reported using statins more than doubled for adults ages 18–40 (0.8 to 1.7 percent) and nearly doubled for adults ages 41–64 (10.5 to 20.3 percent) and adults age 65 and older (23.5 to 45.8 percent).
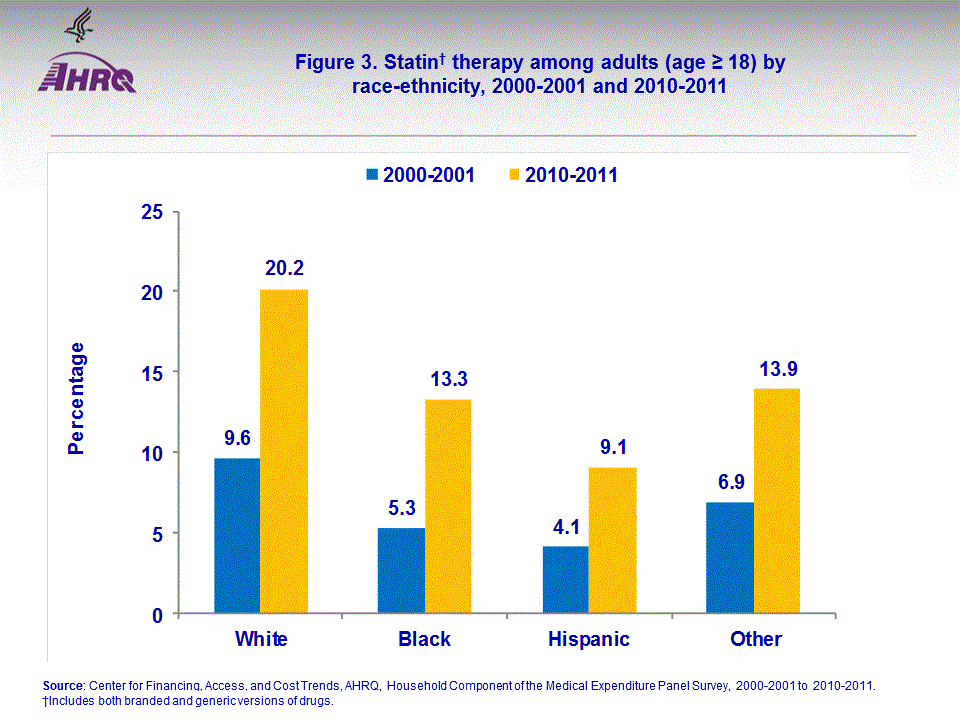
- Between 2000–2001 and 2010–2011, the average annual percentage of adults who reported using statins increased for non-Hispanic whites (9.6 to 20.2 percent), non-Hispanic blacks (5.3 to 13.3 percent), Hispanics (4.1 to 9.1 percent), and non-Hispanic others (6.9 to 13.9 percent).
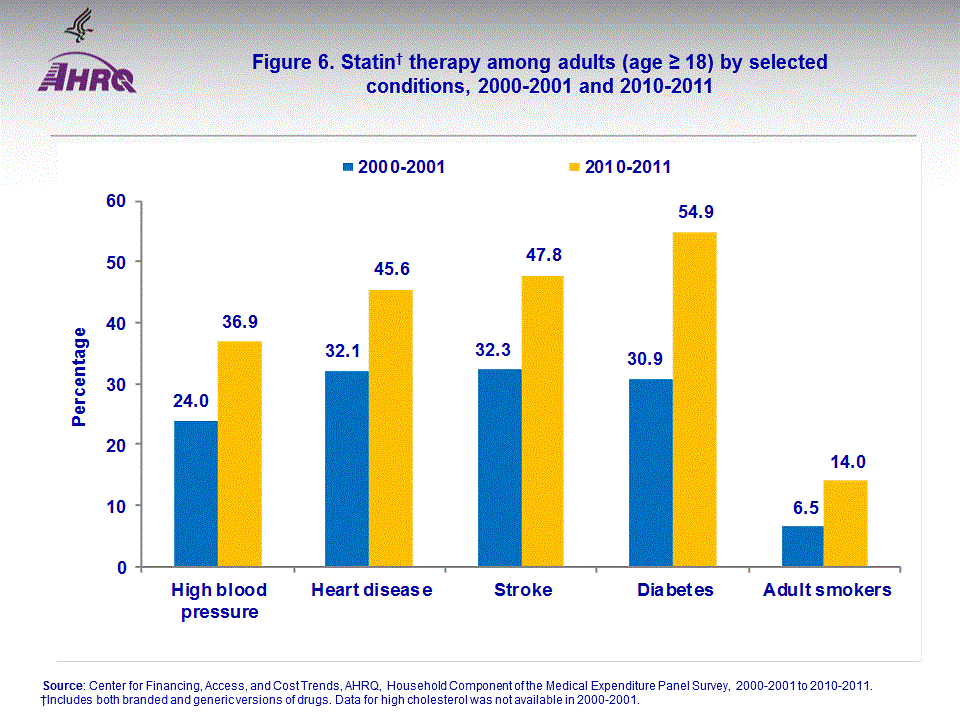
- Between 2000–2001 and 2010–2011, the average annual percentage of adults (age ≥ 18) reporting statin use increased more than 40 percent among adults with high blood pressure (24.0 to 36.9 percent), heart disease (32.1 to 45.6 percent), stroke (32.3 to 47.8 percent), and diabetes (30.9 to 54.9 percent).
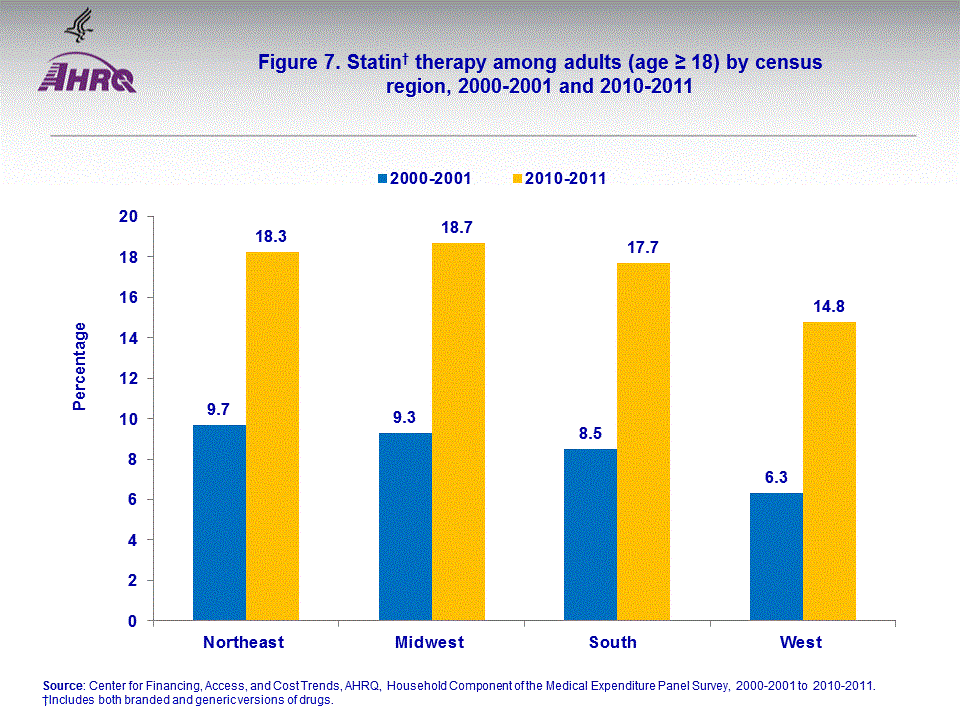
- Between 2000–2001 and 2010–2011, the average annual percentage of adults who reported using statins increased in the Northeast (9.7 to 18.3 percent), Midwest (9.3 to 18.7 percent), South (8.5 to 17.7 percent), and West (6.3 to 14.8 percent).
Introduction
Statins or 3-hydroxy-3-methylglutaryl-coenzyme (HMG-CoA) reductase inhibitors are a class of drugs used in the management of high cholesterol (i.e., dyslipidemia or disorder of lipoprotein metabolism), a major risk factor for heart disease, the leading cause of death in the U.S.1 Recently, the American Heart Association (AHA) and the American College of Cardiology (ACC) published new clinical practice guidelines on the treatment of blood cholesterol to reduce atherosclerotic cardiovascular (ASCVD) risk in adults.2,3This Statistical Brief examines changes in statin use among adults (age ≥ 18) in the U.S. using nationally representative data from the 2000 to 2011 Medical Expenditure Panel Survey (MEPS). In particular, this Brief examines changes in statin use among subgroups of the U.S. civilian noninstitutionalized adult population defined by age, sex, race/ethnicity, health insurance status, perceived health status, comorbidities (priority conditions), and census region. The focus is on trends within groups, from 2000–2001 to 2010–2011. Data from 2000–2001 and 2010–2011 are pooled to increase sample sizes and the precision of estimates, thus results are presented as average annual estimates for these time periods. All differences between estimates discussed in the text are statistically significant at the 0.05 level unless otherwise noted.
Findings
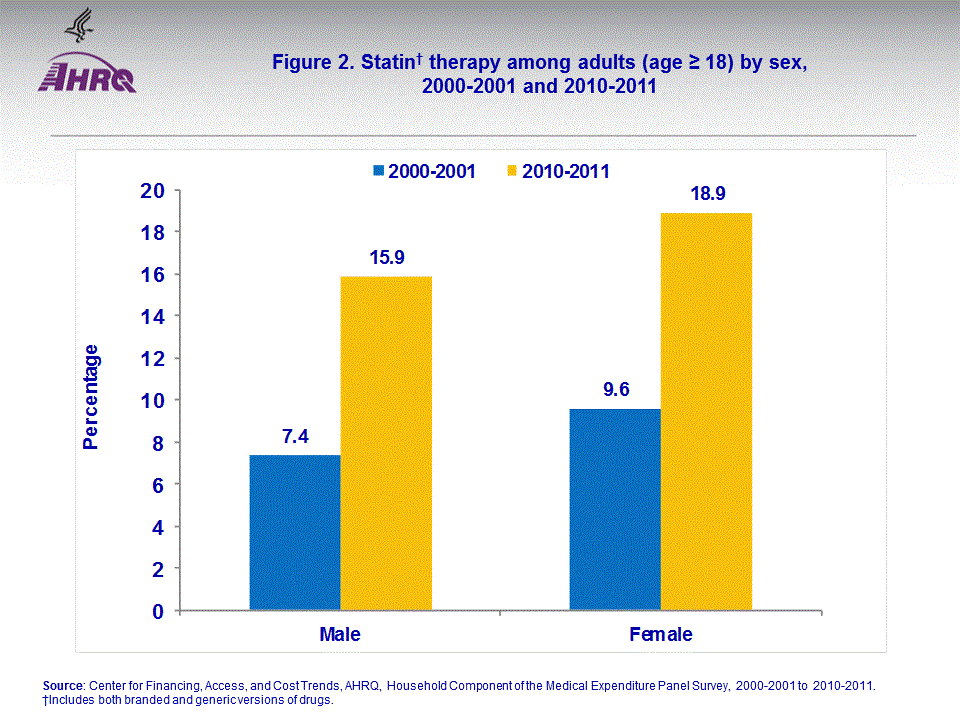
The average annual percentage of adults who reported using statins increased from 0.8 percent in 2000–2001 to 1.7 percent in 2010–2011 for adults ages 18–40, from 10.5 percent in 2000–2001 to 20.3 percent in 2010–2011 for adults ages 41–64, and from 23.5 percent in 2000–2001 to 45.8 percent in 2010–2011 for adults, age 65 and older (figure 1).The average annual percentage of adult men and women who reported using statins increased from 7.4 and 9.6 percent in 2000–2001 to 15.9 and 18.9 percent in 2010–2011 (figure 2).
Between 2000–2001 and 2010–2011, the average annual percentage of adults who reported using statins increased across all race/ethnicities—non-Hispanic whites (9.6 to 20.2 percent), non-Hispanic blacks (5.3 to 13.3 percent), Hispanics (4.1 to 9.1 percent), and non-Hispanic others (6.9 to 13.9 percent) (figure 3).
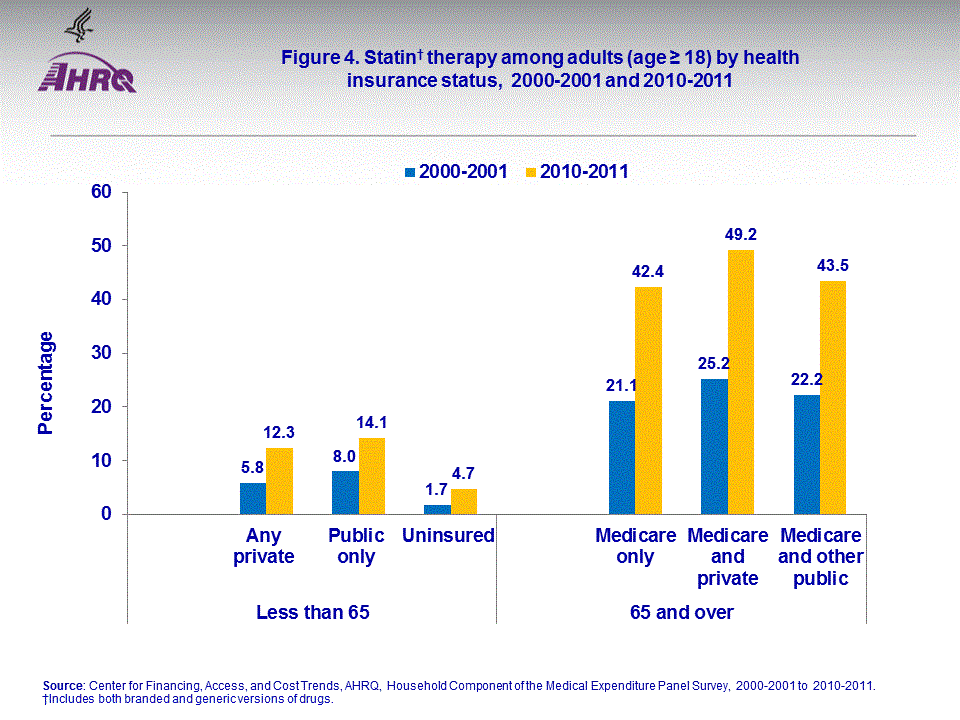
Between 2000–2001 and 2010–2011, there were increases across all health insurance categories in the average annual percentage who reported using statins as follows—adults ages 18–64: any private (5.8 to 12.3 percent), public only (8.0 to 14.1 percent), and the uninsured (1.7 to 4.7 percent); adults age 65 and older: Medicare only (21.1 to 42.4 percent), Medicare and private (25.2 to 49.2 percent), and Medicare and other public (22.2 to 43.5 percent) (figure 4).
Between 2000–2001 and 2010–2011, there were increases in the average annual percentage of adults reporting statin use among adults with selected comorbidities—high blood pressure (24.0 to 36.9 percent), heart disease (32.1 to 45.6 percent), stroke (32.3 to 47.8 percent), and diabetes (30.9 to 54.9 percent), and among adults who smoke (6.5 to 14.0 percent) (figure 6).
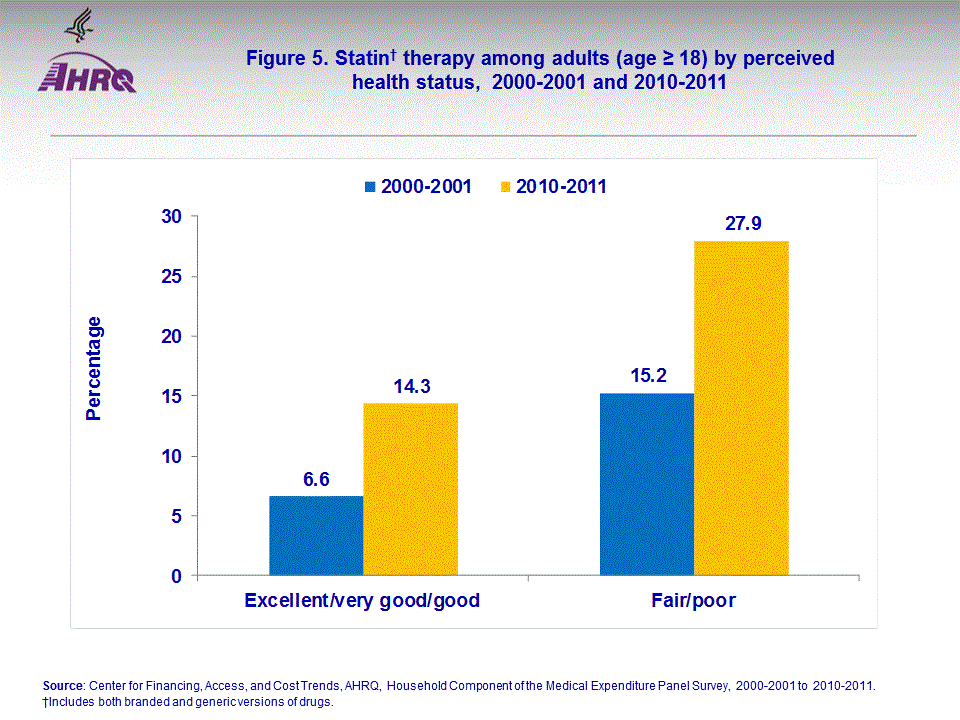
The average annual percentage who reported using statins among adults with high cholesterol in 2010–2011 was 51.3 percent (data not shown).
Between 2000–2001 and 2010–2011, the average annual percentage of adults who reported using statins increased in all four census regions—Northeast (9.7 to 18.3 percent), Midwest (9.3 to 18.7 percent), South (8.5 to 17.7 percent), and West (6.3 to 14.8 percent) (figure 7).
Data Source
The estimates presented in this Statistical Brief were derived from the MEPS Full Year Consolidated Data Files, the MEPS Conditions Files and the MEPS Prescribed Medicines Files for 2000 to 2011.Definitions
Statin medicationsEach drug that was listed as purchased or otherwise obtained in the MEPS Prescribed Medicines (PMED) Files was linked to the Multum Lexicon database, a product of Cerner Multum, Inc. The Multum drug name variable gives the active ingredient(s) in each drug and was used to identify the major types of statins (atorvastatin, amlodipine-atorvastatin, cerivastatin, fluvastatin, lovastatin, lovastatin-niacin, pitavastatin, pravastatin, aspirin-pravastatin, rosuvastatin, simvastatin, ezetimibe-simvastatin, and niacin-simvastatin).
Utilization
Indicator variables were created to identify persons who used each of the major classes of statin medications during the year. Utilization estimates are presented as the percentage of persons using each of the general types of statin medications, and each specific class of statin medication during the year.
Conditions
Indicator variables were created to identify persons who were ever diagnosed with the following selected priority conditions—high blood pressure (HIBPDX, HIBPDX53), heart disease (CHDDX, ANGIDX, MIDX, OHRTDX, CHDDX53, ANGIDX53, MIDX53, OHRTDX53), stroke (STRKDX, STRKDX53), high cholesterol (CHOLDX, CHOLDX53), and diabetes (DIABDX, DIABDX53).
Adult smoker
Smoking behavior of each adult was determined based on a question on current smoking status in the MEPS Self-Administered Questionnaire (SAQ).
Age
In this report, age is the last reported age in each year for each adult age 18 and older, in the sampled households.
Race/ethnicity
Classification by race and ethnicity in this report was based on the following four race/ethnicity groups: Hispanic; black single race non-Hispanic; white single race non-Hispanic; and other races non-Hispanic. Classification by race and ethnicity is based on information provided by the household respondent for each household member. First, respondents were asked if the person's main ethnic background was Puerto Rican, Cuban/Cuban American, Dominican, Mexican, Mexican American, Central or South American, other Latin American, or other Hispanic/Latino. All persons whose main ethnic background was reported as one of these Hispanic groups, regardless of racial background, were classified as Hispanic. All other persons were classified as non-Hispanic according to their reported race. From 1998 to 2001, the respondent was asked if each person's race was best described as American Indian, Aleut, Eskimo, Asian or Pacific Islander, black, white, or other. Beginning in 2002, the respondent was able to describe each person's race by specifying any number of races that applied (i.e., multiracial). The other races non-Hispanic includes non-Hispanic adults with single races other than white and black as well as adults with multiple races.
Health insurance status:
Individuals 18 to 64 years of age were classified in the following three insurance categories based on household responses to health insurance status questions:
- Any private health insurance: Individuals who, at any time during the year, had insurance that provides coverage for hospital and physician care (other than Medicare, Medicaid, or other public hospital/physician coverage) were classified as having private insurance. Coverage by TRICARE (Armed Forces-related coverage) was also included as private health insurance. Insurance that provides coverage for a single service only, such as dental or vision coverage, was not included.
- Public coverage only: Individuals were considered to have public coverage only if they met both of the following criteria: 1) they were not covered by private insurance at any time during the year; and 2) they were covered by one of the following public programs at any point during the year: Medicare, Medicaid, or other public hospital/physician coverage.
- Uninsured: The uninsured were defined as people not covered by private hospital/physician insurance, Medicare, TRICARE, Medicaid, or other public hospital/physician programs at any time during the entire year or period of eligibility for the survey.
- Medicare plus private (including TRICARE): Individuals who at any time during the year were covered by TRICARE or a supplemental private insurance policy in addition to Medicare.
- Medicare plus other public coverage: Individuals were considered to have Medicare plus other public coverage if they were covered by Medicare and met both of the following criteria: 1) they were not covered by TRICARE or a supplemental private policy at any time during the year; and 2) they were covered by one of the following public programs other than Medicare at any point during the year: Medicaid or other public hospital/physician coverage.
- Medicare only: This group includes adults who had Medicare fee-for-service coverage or who were enrolled in Medicare HMOs and did not report any private or public supplemental insurance coverage.
Perceived health status
During each round of interviewing, the household respondent was asked to rate the health of each person in the family according to the following categories: excellent, very good, good, fair, or poor. For this report, the highest ranking response category reported for the year was used and then collapsed into the following two categories: "excellent," "very good," and "good"; and, "fair" and "poor."
Census region
During each round, adults were classified as living in one of the following four regions as defined by the U.S. Census Bureau. In this report, the last reported census region in each year is used.
- Northeast: Maine, New Hampshire, Vermont, Massachusetts, Rhode Island, Connecticut, New York, New Jersey, and Pennsylvania.
- Midwest: Ohio, Indiana, Illinois, Michigan, Wisconsin, Minnesota, Iowa, Missouri, South Dakota, North Dakota, Nebraska, and Kansas.
- South: Delaware, Maryland, District of Columbia, Virginia, West Virginia, North Carolina, South Carolina, Georgia, Florida, Kentucky, Tennessee, Alabama, Mississippi, Arkansas, Louisiana, Oklahoma, and Texas.
- West: Montana, Idaho, Wyoming, Colorado, New Mexico, Arizona, Utah, Nevada, Washington, Oregon, California, Alaska, and Hawaii.
About MEPS-HC
MEPS-HC is a nationally representative longitudinal survey that collects detailed information on health care utilization and expenditures, health insurance, and health status, as well as a wide variety of social, demographic, and economic characteristics for the U.S. civilian noninstitutionalized population. It is cosponsored by the Agency for Healthcare Research and Quality and the National Center for Health Statistics.For more information about MEPS, call the MEPS information coordinator at AHRQ (301-427-1656) or visit the MEPS Web site at http://www.meps.ahrq.gov/.
References
For a detailed description of the MEPS survey design, sample design, and methods used to minimize sources of nonsampling error, see the following publications:Cohen, J. Design and Methods of the Medical Expenditure Panel Survey Household Component. MEPS Methodology Report No. 1. AHCPR Pub. No. 97-0026. Rockville, MD: Agency for Health Care Policy and Research, 1997. http://www.meps.ahrq.gov/mepsweb/data_files/publications/mr1/mr1.shtml
Cohen, S. Sample Design of the 1996 Medical Expenditure Panel Survey Household Component. MEPS Methodology Report No. 2. AHCPR Pub. No. 97-0027. Rockville, MD: Agency for Health Care Policy and Research, 1997. http://www.meps.ahrq.gov/mepsweb/data_files/publications/mr2/mr2.shtml
Cohen, S. Design Strategies and Innovations in the Medical Expenditure Panel Survey. Medical Care, July 2003: 41(7) Supplement: III-5–III-12.
Ezzati-Rice, T.M., Rohde, F., Greenblatt, J. Sample Design of the Medical Expenditure Panel Survey Household Component, 1998–2007. Methodology Report No. 22. March 2008. Agency for Healthcare Research and Quality, Rockville, MD. http://www.meps.ahrq.gov/mepsweb/data_files/publications/mr22/mr22.shtml
Suggested Citation
Sarpong, E.M. and Zuvekas, S.H. Changes in Statin Therapy among Adults (Age ≥ 18) by Selected Characteristics, United States, 2000–2001 to 2010–2011. Statistical Brief #459. November 2014. Agency for Healthcare Research and Quality, Rockville, MD. http://www.meps.ahrq.gov/mepsweb/data_files/publications/st459/stat459.shtmlAHRQ welcomes questions and comments from readers of this publication who are interested in obtaining more information about access, cost, use, financing, and quality of health care in the United States. We also invite you to tell us how you are using this Statistical Brief and other MEPS data and tools and to share suggestions on how MEPS products might be enhanced to further meet your needs. Please email us at MEPSProjectDirector@ahrq.hhs.gov or send a letter to the address below:
Steven B. Cohen, PhD, Director
Center for Financing, Access, and Cost Trends
Agency for Healthcare Research and Quality
540 Gaither Road
Rockville, MD 20850
1 http://www.cdc.gov/cholesterol/facts.htm Accessed June 11, 2014.
2 Stone NJ, Robinson J, Lichtenstein AH, et al. 2013 ACC/AHA guideline on the treatment of blood cholesterol to reduce atherosclerotic cardiovascular risk in adults: a report of the American College of Cardiology/American Heart Association Task Force on Practice Guidelines. Circulation, 2013.
3 Goff DC, Lloyd-Jones DM, Bennett G, et al. 2013 ACC/AHA Guideline on the Assessment of Cardiovascular Risk: A Report of the American College of Cardiology/American Heart Association Task Force on Practice Guidelines. Circulation, 2013.
 |
||||||||||||||||||||||||
|
||||||||||||||||||||||||
|
|
||||||||||||||||||||||||
 |
||||||||||||||||||||||||
|
||||||||||||||||||||||||
|
|
||||||||||||||||||||||||
 |
||||||||||||||||||||||||
|
||||||||||||||||||||||||
|
|
||||||||||||||||||||||||
 |
||||||||||||||||||||||||
|
||||||||||||||||||||||||
|
|
||||||||||||||||||||||||
 |
||||||||||||||||||||||||
|
||||||||||||||||||||||||
|
|
||||||||||||||||||||||||
 |
||||||||||||||||||||||||
|
||||||||||||||||||||||||
|
|
||||||||||||||||||||||||
 |
||||||||||||||||||||||||
|
||||||||||||||||||||||||
|
|
||||||||||||||||||||||||


