
|
|
|
Font Size:
|
||||
|
|
|
|
||||
Concentration of Healthcare Expenditures and Selected Characteristics of Persons With High Expenses, United States Civilian Noninstitutionalized Population, 2018-2021
Statistical Brief #556 | March 2024 | Adriana Hernandez-Viver, MS, and Emily M. Mitchell, PhD
Highlights
- In 2021, the top 1 percent of the population ranked by their healthcare expenditures accounted for 24 percent of total healthcare expenditures, while the bottom 50 percent accounted for less than 3 percent.
- Persons in the top 1 percent expenditure tier had an average of $166,980 in healthcare expenditures in 2021, nearly $30,000 higher than in 2019 or 2018. In 2020, persons in the top 1 percent expenditure tier had average expenditures that were more than $20,000 higher than in 2019 or 2018.
- Persons aged 65 and older and non-Hispanic Whites were disproportionately represented in the top expenditure tiers.
- Inpatient stays accounted for about 26 percent of healthcare expenses for persons in the top 5 percent expenditure tier.
- More than three-quarters of aggregate expenses for persons in the top 5 percent expenditure tier were paid for by private insurance or Medicare.
- Among adults in the top 5 percent expenditure tier, 78.1 percent had two or more priority conditions.
Introduction
The height of the COVID-19 pandemic in 2020 and 2021 resulted in major shifts in patterns of healthcare consumption and delivery in the United States.1 Data from the Medical Expenditure Panel Survey Household Component (MEPS-HC) indicate that in 2021, expenditures on healthcare for the U.S. civilian noninstitutionalized population totaled approximately $2.3 trillion. Most of these expenses, though, remained highly concentrated among a small proportion of persons, with 5 percent of the population accounting for more than half of all healthcare expenditures. These expenditures include all sources of payment for medical care, including payments made by private insurance, Medicare, or Medicaid; out-of-pocket expenses; and other sources.
In this Statistical Brief, data from the Agency for Healthcare Research and Quality's MEPS-HC are used to describe the overall concentration of healthcare expenditures across the U.S. civilian noninstitutionalized population in 2021 compared with 2018, 2019, and 2020. The most commonly treated conditions among persons in the top expenditure groups are identified, and the shares of expenses by age group, race/ethnicity, type of medical service, and source of payment are illustrated for 2021. All differences discussed in the text are statistically significant at the 0.05 level.
Findings
Overall expenditures, 2018-2021 (figures 1 and 2, table 1)
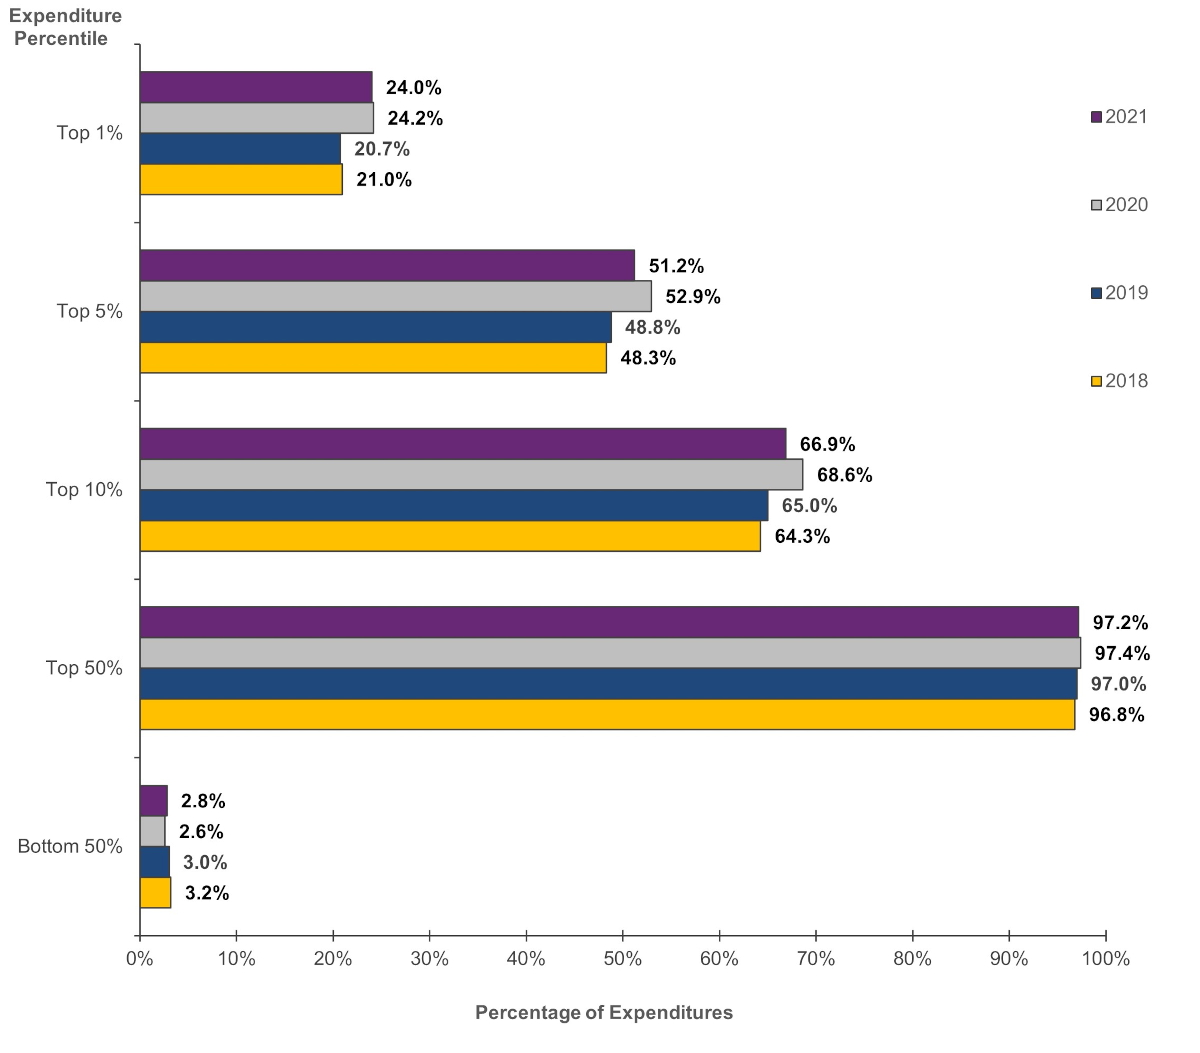
In 2021, the top 1 percent of the population ranked by their healthcare expenditures accounted for 24.0 percent of total healthcare expenditures among the U.S. civilian noninstitutionalized population (figure 1). Persons in the top 5 percent expenditure tier accounted for more than half (51.2%) of healthcare expenses in 2021. On the other hand, persons with expenses in the bottom 50 percent in 2021 accounted for only 2.8 percent (100 minus 97.2) of total healthcare expenses.
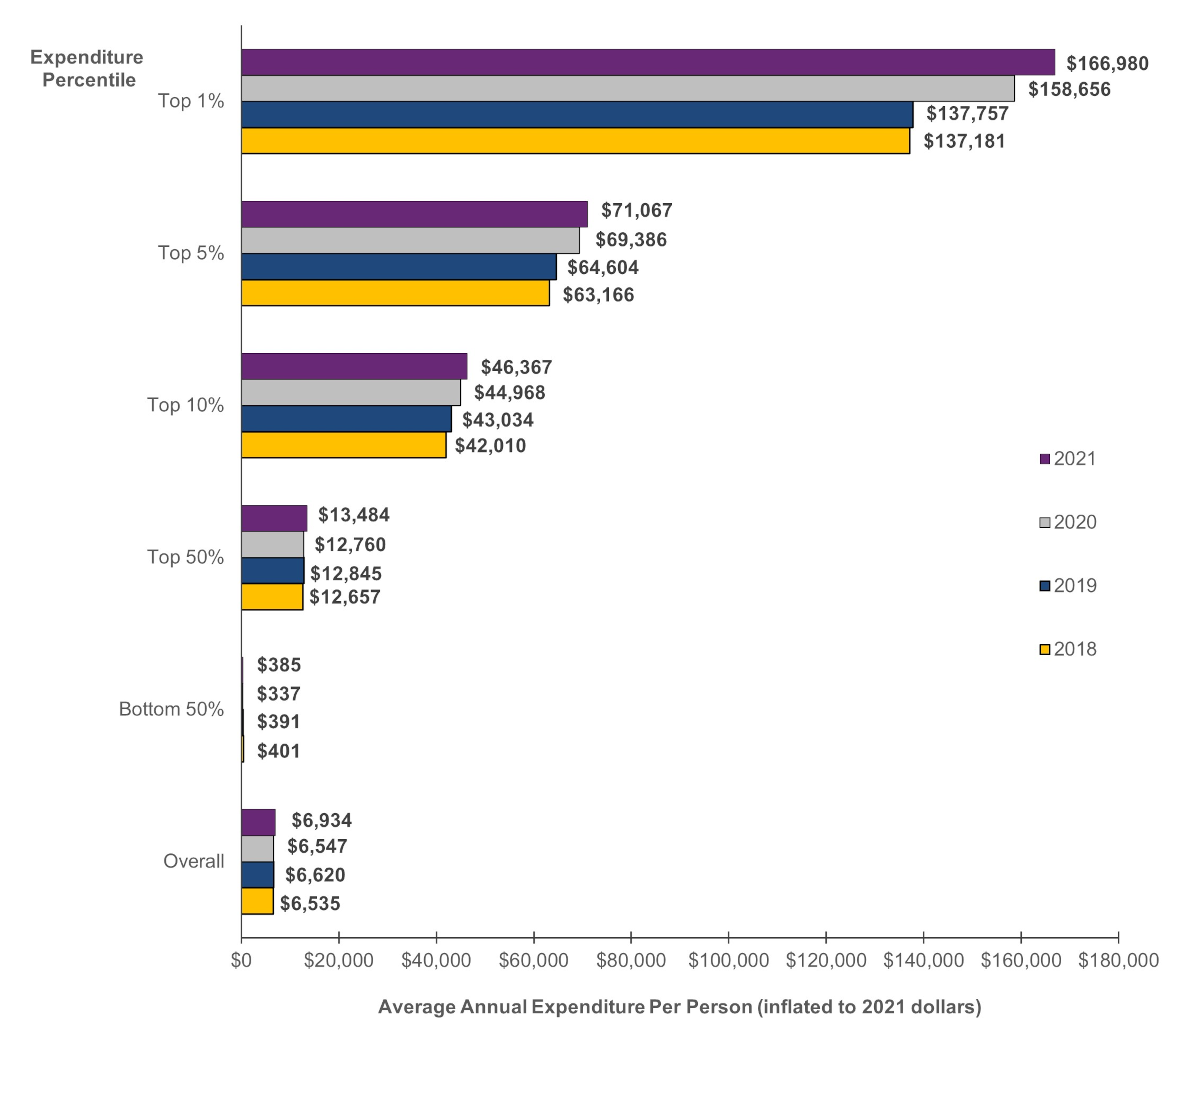
Average costs for persons in the top expenditure tier were higher in 2020 and 2021 than in pre-pandemic years. After adjusting for inflation,a persons in the top 1 percent expenditure tier in 2021 had an average of $166,980 in healthcare expenditures during the year, nearly $30,000 higher than in 2019 or 2018 (figure 2). In 2020, persons in the top 1 percent expenditure tier had average expenditures that were more than $20,000 higher than in 2019 or 2018.
Persons in the top 1 percent expenditure tier are defined as those with healthcare costs of $86,783 or more in 2021. Expenses for persons in the bottom 50 percent of the distribution were less than $1,374 during 2021. Cut points for additional percentile groups are shown in table 1.
Table 1. Percentile of population ranked by healthcare expenditures by year
| Percentile of population | Annual healthcare expenditures (inflated to 2021 dollars) | |||
|---|---|---|---|---|
| 2021 | 2020 | 2019 | 2018 | |
| Top 1% | $86,783 or more | $86,733 or more | $82,731 or more | $77,827 or more |
| Top 5% | $29,921 or more | $28,609 or more | $29,185 or more | $28,404 or more |
| Top 10% | $16,113 or more | $15,098 or more | $16,068 or more | $15,790 or more |
| Bottom 50% | Less than $1,374 | Less than $1,202 | Less than $1,390 | Less than $1,419 |
Age (figure 3)
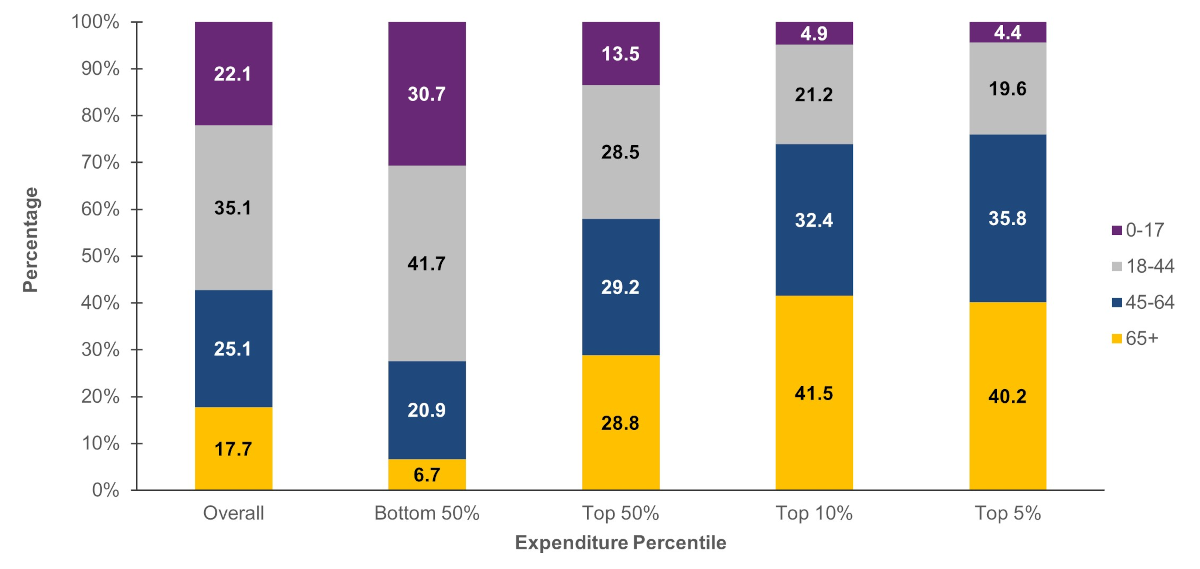
Older persons were disproportionately represented in the higher expenditure tiers. In 2021, persons aged 65 and older constituted 17.7 percent of the U.S. civilian noninstitutionalized population, while persons under age 18 represented 22.1 percent of the population. Among persons in the top 5 percent expenditure tier, however, 40.2 percent were aged 65 and older, while only 4.4 percent were under age 18. In contrast, among persons in the bottom 50 percent expenditure tier, 30.7 percent were under age 18 while only 6.7 percent were aged 65 and older.
Race/ethnicity (figure 4)
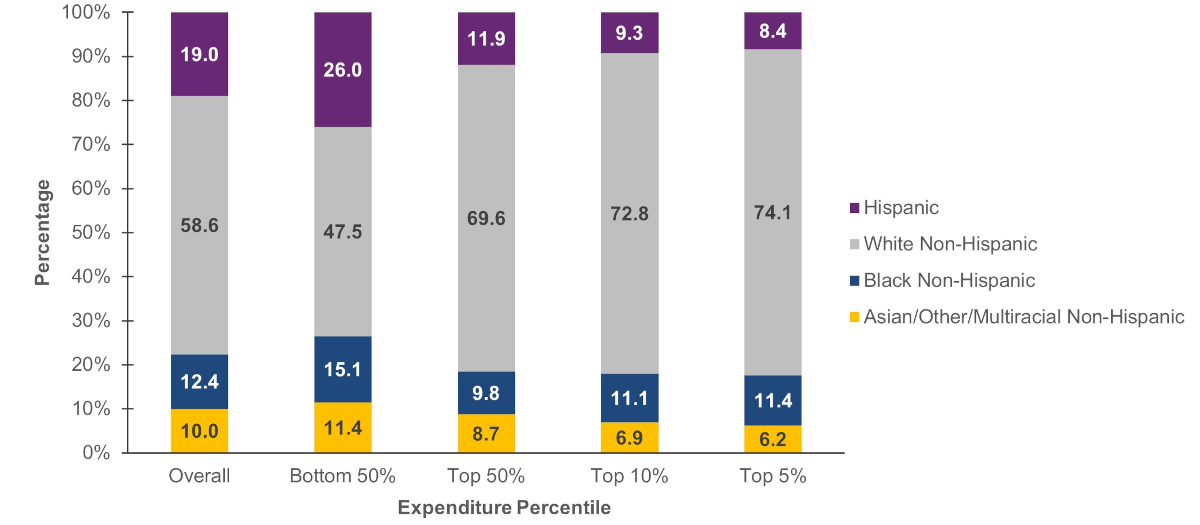
Non-Hispanic Whites were disproportionately represented among persons in the top 50 percent expenditure tier, while Hispanics were underrepresented in this higher expenditure group. Non-Hispanic Whites represented 58.6 percent of the U.S. civilian noninstitutionalized population in 2021 but accounted for 69.6 percent of persons in the top half expenditure tier. Hispanics, on the other hand, comprised 19.0 percent of the total population but only 11.9 percent of persons in the top half expenditure tier.
Type of service (figure 5)
For persons in the bottom 50 percent expenditure tier, more than half of their medical expenses were for ambulatory events (59.9%). The proportion of expenses for inpatient stays and home healthcare in this group was negligible (0.1 and 0.3 percent of expenditures, respectively).
Among persons in the top 5 percent expenditure tier, more than one-quarter (26.1%) of their healthcare expenses were for inpatient stays; a little over one-third (38.5%) of their expenses were for ambulatory events.
Source of Payment (figure 6)
Medicare and private insurance paid for approximately three-quarters of expenses for persons in the top 5 percent expenditure tier (Medicare: 32.3%; private insurance: 43.3%). Out-of-pocket payments comprised only 7.7 percent of expenses in this group.
For persons in the bottom 50 percent expenditure tier, out-of-pocket payments accounted for nearly one quarter of their expenditures (24.4%), while Medicare payments comprised only 5.7 percent of expenditures.
Health Conditions (figures 7 and 8)
The most commonly treated condition among persons in the top 5 percent expenditure tier in 2021 was hypertension (45.9%), followed by hyperlipidemia (33.7%), and musculoskeletal pain and back problems (30.4%). In the overall population, the percentage of persons who received treatment for each of these conditions was 18.6 percent, 14.4 percent, and 11.7 percent, respectively. Other commonly treated conditions for persons in the top 5 percent expenditure tier included injuries, diabetes mellitus, cancer, depression, and anxiety. Note that although these conditions were the most common among persons with high expenses, the majority of these conditions are not necessarily the most expensive conditions to treat. Rather, the top expenditure groups are more likely to include persons with multiple chronic conditions or costly treatments (e.g., surgeries, hospitalizations) associated with these conditions.
MEPS also collects information about a select group of chronic medical conditions that are considered priority conditions due to their prevalence, expense, or relevance to policy. Adults (those aged 18 and older) were asked if they had ever been diagnosed with high blood pressure, heart disease, stroke, emphysema, high cholesterol, cancer, diabetes, arthritis, or asthma. They were also asked whether they had experienced joint pain or chronic bronchitis in the last 12 months. Among adults in the top 5 percent expenditure tier, 78.1 percent had two or more priority conditions. In contrast, among adults in the bottom 50 percent expenditure tier, 24.2 percent had two or more priority conditions while 48.0 percent had no priority conditions.
Data Source
The estimates shown in this Statistical Brief are based on data from the MEPS 2018-2021 Full Year Consolidated Files (HC-209, HC-216, HC-224, and HC-233) and the MEPS 2021 Medical Conditions File (HC-231).
Definitions
Age
Age was defined as age at the end of the year 2021 (or on the last date of MEPS eligibility if the person was
out of scope at the end of the year).
Expenditures
Total expenditures were defined as the sum of payments from all sources to hospitals, physicians, other
healthcare providers (including dental care), and pharmacies for services reported by respondents in the MEPS-HC. For
comparisons across years, dollar amounts were inflated to 2021 levels using the gross domestic product (GDP) price
index.
Expenditure percentiles
Expenditure percentiles were formed by ordering sampled persons by their total expenditures from highest to lowest, then allocating persons to groups based on weighted percentages of the population. Near the cut point of each percentile, a person was included in the top percentile group if their added weight did not surpass the specified percentile. In the case of ties, where two or more people had the same expenditures close to a percentile cut point, the person with the lower weight was included in the higher percentile group. In this brief, the "Bottom 50%" and "Top 50%" are mutually exclusive, while the "Top 50%," "Top 10%,", "Top 5%," and "Top 1%" are not.
Health conditions
The health conditions reported in this statistical brief were the most commonly treated conditions among persons with high expenses; these conditions are not mutually exclusive. Persons were classified as having been treated for a particular condition if they had one or more healthcare events (e.g., office-based, hospital outpatient or emergency room visits, hospital inpatient stays, prescribed medicine purchases, or home healthcare) where the condition was reported as leading to or having been discovered during the event (see Mitchell, E., Ahrnsbrak, R., Soni, A., and Machlin, S. [2023]. Analyzing medical conditions in MEPS: User guide [Parts 1 and 2], for more information about analyzing MEPS medical conditions data).
Conditions reported by the household were coded using classification codes from the International Classification of Diseases, Tenth Revision, Clinical Modification (ICD-10-CM), which were then collapsed into codes from the Clinical Classification Software Refined (CCSR) (see https://www.hcup-us.ahrq.gov/toolssoftware/ccsr/ccs_refined.jsp for details). Similar CCSR codes were further grouped into broader condition categories. The conditions discussed in this brief were defined as follows:
Table 2. Collapsed Condition Category by Classification Software Refined (CCSR) Codes
| Collapsed Condition Category | Classification Software Refined (CCSR) Codes |
|---|---|
| Hypertension | CIR007, CIR008 |
| Hyperlipidemia | END010 |
| Musculoskeletal Pain and Back Problems (including joint and back pain) | MUS010, MUS011, MUS022, MUS038 |
| Injuries | INJ000-INJ021, INJ024-INJ027, INJ032, INJ038-INJ058, INJ061-INJ064, INJ068, INJ073, INJ074 |
| Diabetes Mellitus | END002-END006 |
| Cancer | NEO000-NEO072, NEO074, FAC006 |
| Depression | MBD002 |
| Anxiety | MBD005 |
Priority conditions
MEPS collects information about a select group of medical conditions that have been specified by AHRQ as priority conditions due to their prevalence, expense, or relevance to policy. For most conditions (except joint pain and chronic bronchitis), respondents were asked if they had ever been diagnosed with the condition. For joint pain and chronic bronchitis, respondents were asked if they experienced the condition in the last 12 months. For this brief, adults with any of the following conditions were categorized into "One Condition" or "Two or More Conditions" as appropriate:
- High blood pressure (identified as HIBPDX = 1)
- Heart disease, including coronary heart disease (CHDDX = 1), angina (ANGIDX = 1), myocardial infarction (MIDX = 1), and other unspecified heart disease (OHRTDX = 1)
- Stroke (STRKDX = 1)
- Emphysema (EMPHDX = 1)
- Chronic bronchitis in the last 12 months (CHBRON31 = 1 and/or CHRBRON53 = 1)
- High cholesterol (CHOLDX = 1)
- Cancer (CANCERDX = 1)
- Diabetes (DIABDX_M18 = 1)
- Arthritis (ARTHDX = 1) or joint pain in the last 12 months (JTPAIN31_M18 = 1 and/or JTPAIN53_M18 = 1)
- Asthma (ASTHDX = 1)
Race/ethnicity
MEPS respondents were asked if each family member was Hispanic or Latino and about each member's race. Based on this information, categories of race and Hispanic origin were constructed as follows:
- Hispanic
- White, non-Hispanic (no other races reported)
- Black, non-Hispanic (no other races reported)
- Asian, non-Hispanic (no other races reported); other, non-Hispanic (no other races reported); or multiple races, non-Hispanic
Sources of payment
- Out-of-pocket: Expenses paid by the patient or other family member.
- Private insurance: Payments made by insurance plans covering hospital and medical care (excluding payments from Medicare, Medicaid, and other public sources). Payments from Medigap plans or TRICARE (Armed Forces-related coverage) are included.
- Medicare: Payments made by Medicare, which is a federally financed health insurance plan for persons aged 65 and older, persons receiving Social Security disability payments, and persons with end-stage renal disease.
- Medicaid/CHIP: Payments made by Medicaid and the Children's Health Insurance Program (CHIP), which are means-tested government programs jointly financed by Federal and State funds that provide healthcare to those who are eligible. Medicaid is designed to provide health coverage to families and individuals who are unable to afford necessary medical care while CHIP provides coverage to additional low-income children who are not eligible for Medicaid. Eligibility criteria for both programs vary significantly by state.
- Other sources: Includes payments from the Department of Veterans Affairs; other Federal sources (Indian Health Service and other care provided by the Federal Government, except TRICARE); various State and local sources (community and neighborhood clinics, State and local health departments, and State programs other than Medicaid/CHIP); Workers' Compensation; and various unclassified sources (e.g., charity; automobile, homeowner's, or other liability insurance; and other miscellaneous or unknown sources).
Type of services
- Ambulatory: Includes office-based visits (visits to medical providers seen in office settings), hospital outpatient visits, and emergency room visits. Expenses for outpatient and emergency room visits include payments for services covered under the basic facility charge and those for separately billed physician services. Emergency room payments exclude expenses for emergency room services that are included in a hospital inpatient admission.
- Hospital inpatient: Includes room and board and all hospital diagnostic and laboratory expenses associated with the basic facility charge, payments for separately billed physician inpatient services, and some emergency room expenses incurred immediately prior to inpatient stays.
- Prescribed medicines: Includes expenses for all prescribed medications that were initially purchased or refilled during the year.
- Home health: Includes expenses for home care provided by agencies and independent providers.
- Dental and other: Includes payments for services to any type of dental care provider as well as expenses for care in all categories not specified as a separate category (e.g., vision aids, medical equipment and supplies).
About MEPS
The MEPS-HC is a nationally representative survey that collects detailed information on healthcare utilization and expenditures, health insurance, and health status, as well as a wide variety of social, demographic, and economic characteristics for the U.S. civilian noninstitutionalized population. The MEPS-HC is cosponsored by the AHRQ and the National Center for Health Statistics (NCHS). More information about the MEPS-HC can be found on the MEPS website at http://meps.ahrq.gov/.
The following methodology reports contain information on the survey and sample designs for the MEPS Household and Medical Provider Components (HC and MPC, respectively). Data collected in these two components are jointly used to derive MEPS healthcare expenditure data.
Cohen, J. Design and Methods of the Medical Expenditure Panel Survey Household Component. Medical Expenditure Panel Survey Methodology Report No. 1. AHCPR Pub. No. 97-0026. July 1997. Agency for Health Care Policy and Research (AHCPR), Rockville, MD. https://meps.ahrq.gov/data_files/publications/mr1/mr1.pdf
Chowdhury, S.R., Machlin, S.R., and Gwet, K.L. Sample Designs of the Medical Expenditure Panel Survey Household Component, 1996-2006 and 2007-2016. Methodology Report #33. January 2019. Agency for Healthcare Research and Quality, Rockville, MD. https://meps.ahrq.gov/data_files/publications/mr33/mr33.pdf
Machlin, S.R., Chowdhury, S.R., Ezzati-Rice, T., DiGaetano, R., Goksel, H., Wun, L.-M., Yu, W., and Kashihara, D. Estimation Procedures for the Medical Expenditure Panel Survey Household Component. Methodology Report #24. September 2010. Agency for Healthcare Research and Quality, Rockville, MD. https://meps.ahrq.gov/data_files/publications/mr24/mr24.shtml
Mitchell, E., Ahrnsbrak, R., Soni, A., and Machlin, S. Analyzing Medical Conditions in MEPS: User Guide (Part 1 of 2). Methodology Report #36. February 2023. Agency for Healthcare Research and Quality, Rockville, MD. https://meps.ahrq.gov/data_files/publications/mr36/mr36ug.shtml
Mitchell, E., Ahrnsbrak, R., Soni, A., and Machlin, S. Analyzing Medical Conditions in MEPS: Detailed Reference Guide (Part 2 of 2). Methodology Report #36. February 2023.Agency for Healthcare Research and Quality, Rockville, MD. https://meps.ahrq.gov/data_files/publications/mr36/mr36dr.shtml
Stagnitti, M.N., Machlin, S.R., Zodet, M.W., and Saleska, E. Design, Methods, and Field Results of the Medical Expenditure Panel Survey Medical Provider Component (MEPS MPC) including the Medical Organizations Survey (MOS) – 2016 Data Year. Methodology Report #32. October 2018. Agency for Healthcare Research and Quality, Rockville, MD. https://meps.ahrq.gov/data_files/publications/mr32/mr32.pdf
Cohen, S. Sample Design of the 1996 Medical Expenditure Panel Survey Household Component. MEPS Methodology Report No. 2. AHCPR Pub. No. 97-0027. July 1997. Agency for Health Care Policy and Research (AHCPR), Rockville, MD. https://meps.ahrq.gov/data_files/publications/mr2/mr2.pdf
References
1 Ni B, Gettler E, Stern R, et al. Disruption of medical care among individuals in the southeastern United States during the COVID-19 pandemic. J Public Health Res. 2022;11(1): 2497. doi:10.4081/jphr.2021.2497.
Suggested Citation
Hernandez-Viver, A., and Mitchell, E.M. Concentration of Healthcare Expenditures and Selected Characteristics of Persons with High Expenses, U.S. Civilian Noninstitutionalized Population, 2021. Statistical Brief #556. March 2024. Agency for Healthcare Research and Quality, Rockville, MD. https://meps.ahrq.gov/data_files/publications/st556/stat556.shtml
Notes
a Dollars were inflated to 2021 levels using the gross domestic product (GDP) price index (see https://meps.ahrq.gov/about_meps/Price_Index.shtml for more details).AHRQ welcomes questions and comments from readers of this publication who are interested in obtaining more information about access, cost, use, financing, and quality of healthcare in the United States. We also invite you to tell us how you are using this Statistical Brief and other MEPS data and tools and to share suggestions on how MEPS products might be enhanced to further meet your needs. Please email us at MEPSProjectDirector@ahrq.hhs.gov or send a letter to the address below:
Joel W. Cohen, PhD, Director
Center for Financing, Access and Cost Trends
Agency for Healthcare Research and Quality
5600 Fishers Lane, Mailstop 07W41A
Rockville, MD 20857
Figure 1. Concentration of healthcare expenditures by expenditure percentile, 2018-2021
| Year | Top 1% | Top 5% | Top 10% | Top 50% | Bottom 50% |
|---|---|---|---|---|---|
| 2021 | 24.0 | 51.2 | 66.9 | 97.2 | 2.8 |
| 2020 | 24.2 | 52.9 | 68.6 | 97.4 | 2.6 |
| 2019 | 20.7 | 48.8 | 65.0 | 97.0 | 3.0 |
| 2018 | 21.0 | 48.3 | 64.3 | 96.8 | 3.2 |
Source: Agency for Healthcare Research and Quality, Medical Expenditure Panel Survey, Household Component, 2018-2021.
Figure 2. Average expenditure per person by expenditure percentile, 2018-2021
| Year | Top 1% | Top 5% | Top 10% | Top 50% | Bottom 50% | Overall |
|---|---|---|---|---|---|---|
| 2021 | $166,980 | $71,067 | $46,367 | $13,484 | $385 | $6,934 |
| 2020 | $158,656 | $69,386 | $44,968 | $12,758 | $337 | $6,547 |
| 2019 | $137,757 | $64,604 | $43,034 | $12,845 | $391 | $6,620 |
| 2018 | $137,181 | $63,166 | $42,010 | $12,656 | $401 | $6,535 |
Source: Agency for Healthcare Research and Quality, Medical Expenditure Panel Survey, Household Component, 2018-2021.
Figure 3. Percentage of persons in each age group by expenditure percentile, 2021
| Age Group | Overall | Bottom 50% | Top 50% | Top 10% | Top 5% |
|---|---|---|---|---|---|
| 0-17 | 22.1 | 30.7 | 13.5 | 4.9 | 4.4 |
| 18-44 | 35.1 | 41.7 | 28.5 | 21.2 | 19.6 |
| 45-64 | 25.1 | 20.9 | 29.2 | 32.4 | 35.8 |
| 65+ | 17.7 | 6.7 | 28.8 | 41.5 | 40.2 |
Source: Agency for Healthcare Research and Quality, Medical Expenditure Panel Survey, Household Component, 2021.
Figure 4. Percentage of persons in each race/ethnicity group by expenditure percentile, 2021
| Race/Ethnicity | Overall | Bottom 50% | Top 50% | Top 10% | Top 5% |
|---|---|---|---|---|---|
| Hispanic | 19.0 | 26.0 | 11.9 | 9.3 | 8.4 |
| White Non-Hispanic | 58.6 | 47.5 | 69.6 | 72.8 | 74.1 |
| Black Non-Hispanic | 12.4 | 15.1 | 9.8 | 11.1 | 11.4 |
| Asian/Other/Multiracial Non-Hispanic | 10.0 | 11.4 | 8.7 | 6.9 | 6.2 |
Source: Agency for Healthcare Research and Quality, Medical Expenditure Panel Survey, Household Component, 2021.
Figure 5. Percentage of type of service used by expenditure percentile, 2021
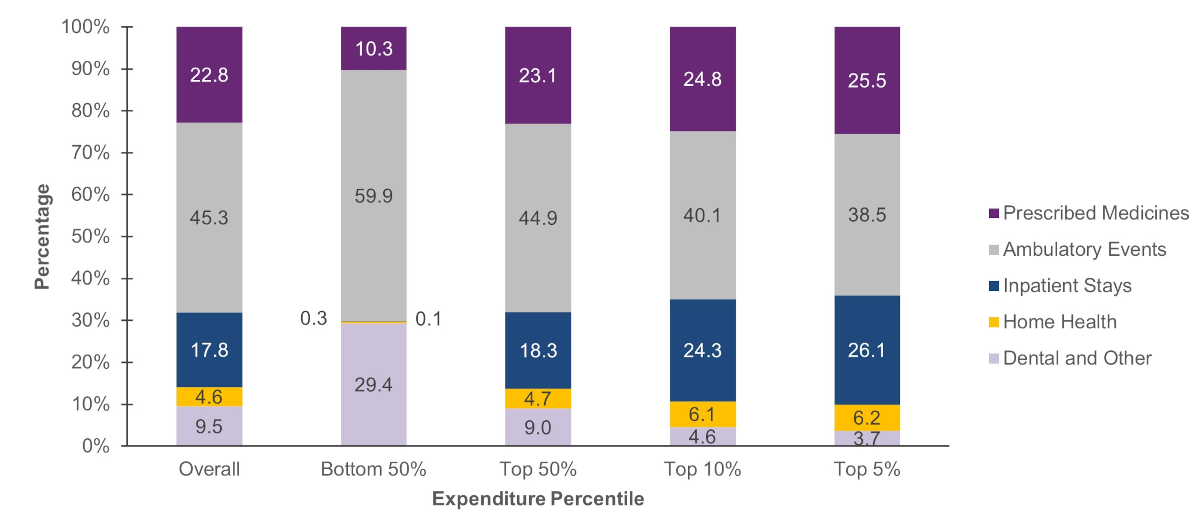
| Type of Service | Overall | Bottom 50% | Top 50% | Top 10% | Top 5% |
|---|---|---|---|---|---|
| Prescribed Medicines | 22.8 | 10.3 | 23.1 | 24.8 | 25.5 |
| Ambulatory Events | 45.3 | 59.9 | 44.9 | 40.1 | 38.5 |
| Inpatient Stays | 17.8 | 0.1 | 18.3 | 24.3 | 26.1 |
| Home Health | 4.6 | 0.3 | 4.7 | 6.1 | 6.2 |
| Dental and Other | 9.5 | 29.4 | 9.0 | 4.6 | 3.7 |
Source: Agency for Healthcare Research and Quality, Medical Expenditure Panel Survey, Household Component, 2021.
Figure 6. Percentage of expenditures by source of payment and expenditure percentile, 2021
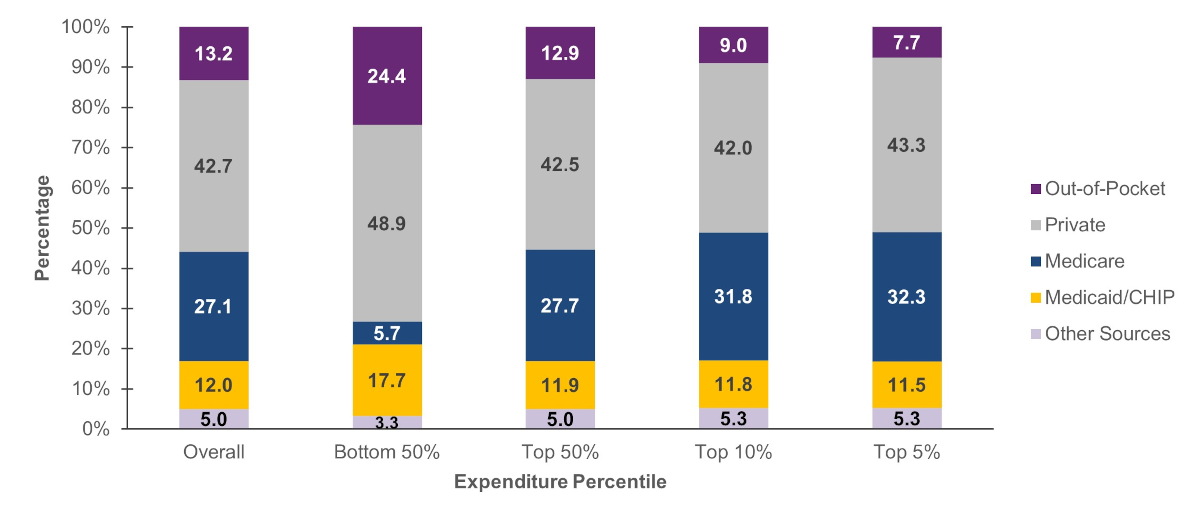
| Source of Payment | Overall | Bottom 50% | Top 50% | Top 10% | Top 5% |
|---|---|---|---|---|---|
| Out-of-Pocket | 13.2 | 24.4 | 12.9 | 9.0 | 7.7 |
| Private | 42.7 | 48.9 | 42.5 | 42.0 | 43.3 |
| Medicare | 27.1 | 5.7 | 27.7 | 31.8 | 32.3 |
| Medicaid/Children's Health Insurance Program (CHIP) | 12.0 | 17.7 | 11.9 | 11.8 | 11.5 |
| Other Sources | 5.0 | 3.3 | 5.0 | 5.3 | 5.3 |
Source: Agency for Healthcare Research and Quality, Medical Expenditure Panel Survey, Household Component, 2021.
Figure 7. Most commonly treated conditions among persons with top 5 percent of expenses: Percentage of persons treated, 2021
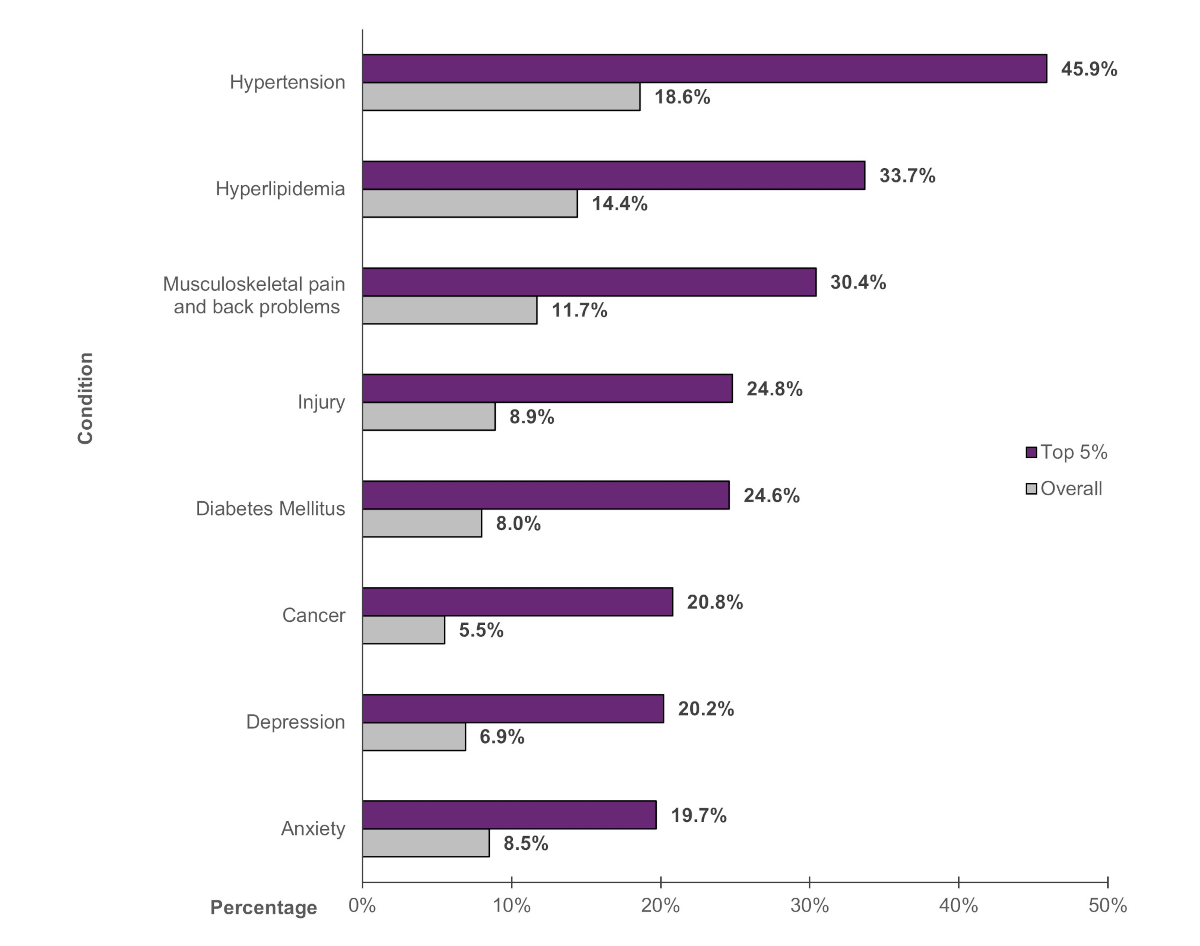
| Condition | Overall | Top 5% |
|---|---|---|
| Hypertension | 18.6% | 45.9% |
| Hyperlipidemia | 14.4% | 33.7% |
| Musculoskeletal pain and back problems | 11.7% | 30.4% |
| Injury | 8.9% | 24.8% |
| Diabetes Mellitus | 8.0% | 24.6% |
| Cancer | 5.5% | 20.8% |
| Depression | 6.9% | 20.2% |
| Anxiety | 8.5% | 19.7% |
Source: Agency for Healthcare Research and Quality, Medical Expenditure Panel Survey, Household Component, 2021.
Figure 8. Percentage of adults by number of priority conditions and expenditure percentile, 2021
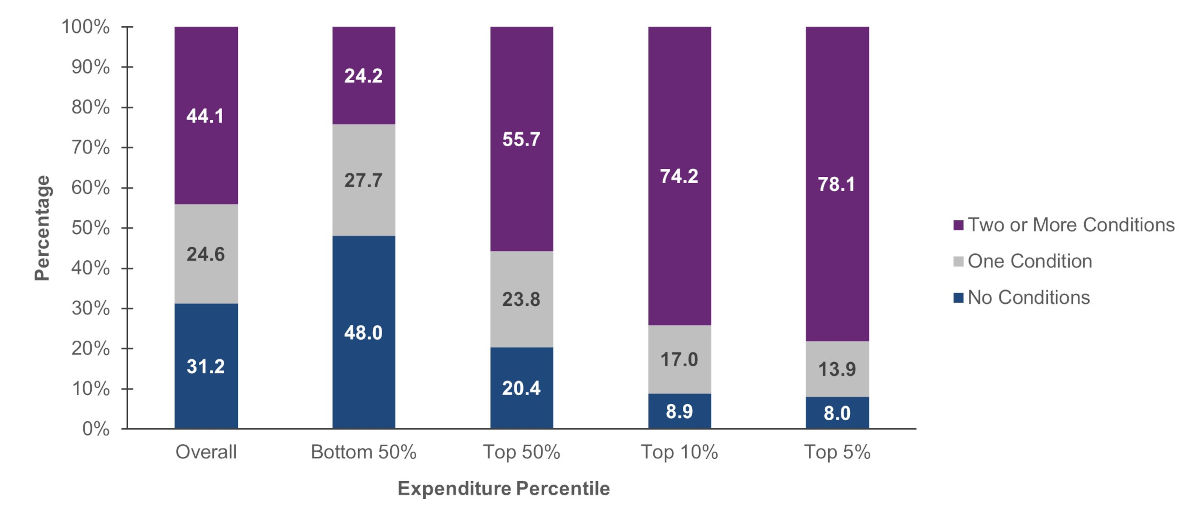
| Number of Priority Conditions | Overall | Bottom 50% | Top 50% | Top 10% | Top 5% |
|---|---|---|---|---|---|
| Two or More Conditions | 44.1 | 24.2 | 55.7 | 74.2 | 78.1 |
| One Condition | 24.6 | 27.7 | 23.8 | 17.0 | 13.9 |
| No Conditions | 31.2 | 48.0 | 20.4 | 8.9 | 8.0 |
Source: Agency for Healthcare Research and Quality, Medical Expenditure Panel Survey, Household Component, 2021.