MEPS Annual Methodology Report 2025
Final
July 1, 2026
Reference Number: 2-7-790
Deliverable Number: 121bG.102
Contract Number: 75Q80120D00024
Task Order Number: 75Q80120F32001
Prepared For
Agency for Healthcare Research and Quality
Center for Financing, Access and Cost Trends
560 Fishers Ln.
Rockville, MD 20850
Prepared By
Westat
7501 Wisconsin Ave.
Ste. 1000E
Bethesda, MD 20814-6527
301-251-1500
Table of Contents
Introduction1. Sample
1.1 Sample Composition
1.2 Sample Delivery and Processing
2. Instrument and Materials Design
2.1 Introduction
2.2 Overview of MEPS Instruments
2.3 Instrument Changes for 2025
2.4 Testing of the Instruments and Interviewer Management System
2.5 Changes to Materials and Procedures for 2025
2.5.1 Instructional Manuals
2.5.2 Electronic Case Materials
2.5.3 Respondent Materials
3. Recruiting and Training
3.1 Field Interviewer Recruiting for 2025
3.2 2025 Interviewer Training
3.2.1 Experienced Interviewer Training
3.2.2 Continuing Education for All Interviewers
4. Data Collection
4.1 Data Collection Procedures
4.2 Data Collection Results: Interviewing
4.2.1 Components of Response and Nonresponse
4.2.2 NHIS Completion Status
4.2.3 Sample Domain
4.2.4 Refusals and Refusal Conversion
4.2.5 Tracing and Locating
4.2.6 Interview Length
4.2.7 Mean Contact Attempts per Case
4.3 Data Collection Results: Authorization Form Signing Rates
4.4 Data Collection Results: Self-Administered Questionnaire and Diabetes Care Supplement Collection Rates
4.5 Quality Control
4.6 Security Incidents
4.7 Data Collection Results: Patient Profile Collection
5. Home Office Support of Field Activities
5.1 Preparation for Field Activities
5.2 Support During Data Collection
6. Data Processing and Data Delivery
6.1 Processing to Support Data Delivery
6.1.1 Schedules for Data Delivery
6.1.2 Data Quality Control System
6.1.3 Transformation
6.1.4 TeleForm/Data Editing of Scanned Forms
6.1.5 Coding
6.2 Data Delivery
6.2.1 Variable Construction
6.2.2 File Deliveries
Appendix
Appendix A Comprehensive Tables—Household Survey
Tables
Table 1.1. Initial MEPS sample size (reporting units [RUs]) and number of National Health Interview Survey (NHIS) primary sampling units (PSUs), Panels 1–30
Table 1.2. Data collection periods and starting reporting unit (RU)-level sample sizes, spring 2020–fall 2025
Table 1.3. Percentage of “White, other” households on the MEPS frame with partially completed interviews in National Health Interview Survey (NHIS) and sampling rates of these households in MEPS Panels 4–30
Table 1.4. Distribution of Panel 30 sampled reporting units (RUs) by sample domain
Table 2.1. Supplemental sections by round
Table 2.2. Authorization forms by round
Table 2.3. Supplemental self-administered questionnaires (SAQs) by 2025 field period and round
Table 3.1. Staffing for spring field period, 2021–2025
Table 3.2. Attrition rate among new and experienced interviewers, 2021–2025
Table 3.3. Annual attrition rate among new and experienced interviewers, 2021–2025
Table 4.1. Data collection schedule and number of weeks per round of data collection, 2025
Table 4.2. MEPS-HC data collection results, Panels 24–30
Table 4.3. Response rates by data collection year, 2015–2025
Table 4.4. Completed cases by mode of interviewing for Panels 28–30
Table 4.5. Summary of MEPS Round 1 response and nonresponse, 2020–2025 panels
Table 4.6. Summary of MEPS Round 1 response, 2020–2025 panels, by National Health Interview Survey (NHIS) completion status
Table 4.7. Summary of MEPS Panel 30, Round 1 response rates, by sample domain by National Health Interview Survey (NHIS) completion status
Table 4.8. Summary of MEPS Panel 30, Round 1 response by interview mode, sample domain, and National Health Interview Survey (NHIS) completion status
Table 4.9. Summary of MEPS Round 1 results for reporting units (RUs) who ever refused, Panels 25–30
Table 4.10. Summary of MEPS Round 1 results for reporting units (RUs) who were ever traced, Panels 25–30
Table 4.11. Interview timing comparison, Panels 25–30 (mean minutes per interview, single-session interviews)
Table 4.12. Interview timing comparison by interview mode for Panels 28–30 (mean minutes per interview, single-session interviews)
Table 4.13. Mean contact attempts by National Health Interview Survey (NHIS) completion status and interview mode, Round 1 of Panels 28–30
Table 4.14. Signing rates for medical provider authorization forms for Panels 23–30
Table 4.15. Signing rates for pharmacy authorization forms for Panels 23–30
Table 4.16. Results of self-administered questionnaire (SAQ) collection for Panels 23–30
Table 4.17. Results of Diabetes Care Supplement (DCS) collection for Panels 22–29
Table 4.18. Results of patient profile collection 2012–2025
Table 5.1. Number and percentage of respondents who called the respondent hotline, 2021–2025
Table 5.2. Calls to the respondent hotline, 2024 and 2025
Table 6.1. 2025 cases with comments or data check issues
Table 6.2. Total number of 2025 comments by category
Table A.1. Data collection periods and starting reporting unit (RU)-level sample sizes, all panels
Table A.2. MEPS household survey data collection results, all panels
Table A.3. Response rates by data collection year
Table A.4. Summary of MEPS Round 1 response and nonresponse
Table A.5. Summary of Round 1 response by National Health Interview Survey (NHIS) completion status
Table A.6. Summary of MEPS Round 1 results for all reporting units (RUs) who ever refused, Panels 15–30
Table A.7. Summary of MEPS Round 1 results for reporting units (RUs) who were ever traced, Panels 15–30
Table A.8. Interview timing comparison (mean minutes per interview, single-session interviews)
Table A.9. Mean contact attempts by National Health Interview Survey (NHIS) completion status, Round 1
Table A.10. Signing rates for medical provider authorization forms
Table A.11. Interview length by mode for Panels 24–30
Table A.12. Signing rates for pharmacy authorization forms
Table A.13. Results of self-administered questionnaire (SAQ) collection
Table A.14. Results of Diabetes Care Supplement (DCS) collection
Table A.15. Results of patient profile collection 2012–2025
Table A.16. Calls to respondent hotline
Figure
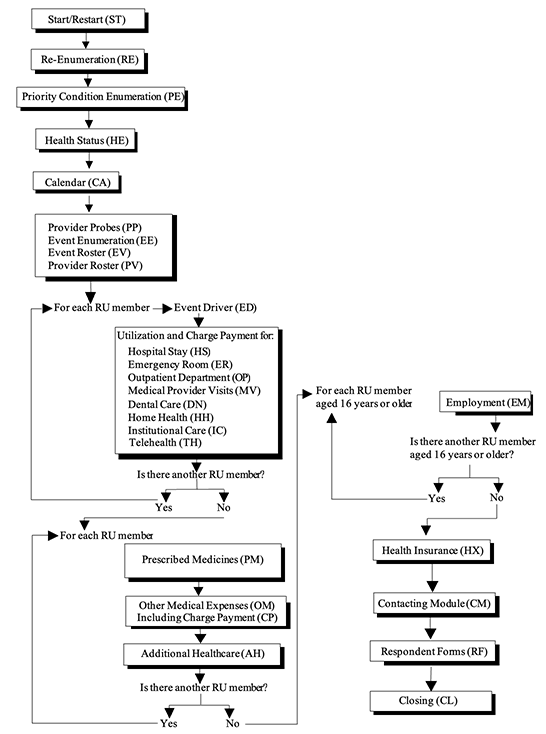
Figure 2.1 Round 1 interview flow
Figure 6.1. Blaise to DEX transformation
Introduction
The Medical Expenditure Panel Survey Household Component (MEPS-HC; contract 75Q80120D00024, awarded July 13, 2020, and contract 75Q80124D00001, awarded September 24, 2024) is the central component of the long-term research effort sponsored by the Agency for Healthcare Research and Quality (AHRQ) to provide timely and accurate data on access to, use of, and payments for healthcare services by the U.S. civilian noninstitutionalized population. The project has been in operation since 1996, producing a series of annual estimates of health insurance coverage, healthcare utilization, and healthcare expenditures. This report documents the principal design, training, data collection, and data processing activities of MEPS-HC for survey year 2025.
Data are collected for MEPS-HC through a series of overlapping household panels. The sample is drawn from the previous year’s National Household Interview Survey (NHIS). Each year, a new panel is enrolled for a series of five in-person or video interviews conducted over a 2.5-year period covering 2 calendar years of data. Supplemental self-administered questionnaires (SAQs) obtain additional information from adults in the household.
This report describes work performed for all panels active during calendar year 2025. Data collection operations in 2025 were for Panel 28, Round 5; Panel 29, Rounds 3 and 4; and Panel 30, Rounds 1 and 2. Data processing activity focused on delivery of full-year (FY) utilization and expenditure files for calendar year 2023. Tables in the body of the report highlight the 2025 results, with limited comparison to prior years. A set of tables showing data collection results over the history of the project is included in the appendix.
Chapter 1 of the report describes the 2025 sample and activities associated with preparing the sample for fielding. Chapters 2–5 discuss activities associated with data collection for 2025: updates to the survey questionnaire and field procedures, field staff recruiting and training, data collection operations and results, and home office support of field activities. Chapter 6 describes data processing and data delivery activities.
1. Sample
Each year, a new, nationally representative sample for the Medical Expenditure Panel Survey Household Component (MEPS-HC) is drawn from households that responded to the previous year’s National Health Interview Survey (NHIS). Households in a new panel typically participate in a series of five interviews that collect data covering 2 full calendar years. For each calendar year, the sample respondents from two panels—one completing its first year in the study (Round 3) and one completing its second year (Round 5)—are combined for analysis purposes, resulting in a series of annual estimation files.
The sample for the new MEPS panel in 2025, Panel 30, was selected from households that responded to NHIS in the preceding year, where the NHIS sample was based on the NHIS sample design initially implemented in 2016 (as were Panels 22–29). Specifically, the MEPS household sample was randomly selected from those who participated in NHIS during the first three quarters of 2024 and had been assigned to NHIS Panels 1 and 3, the NHIS panels designated for MEPS.
This chapter describes the 2025 MEPS sample drawn from 2024 NHIS-responding households as well as steps taken to prepare the new sample for fielding.
1.1 Sample Composition
Table 1.1 shows the starting sample sizes in terms of the number of reporting units (RUs) for all MEPS panels through Panel 30 and the number of MEPS primary sampling units (PSUs) from which each panel was drawn. Note that the change in the number of PSUs for Panel 12 reflects the redesign of the NHIS sample implemented in 2006 (thus affecting MEPS in 2007), following the 2000 Decennial Census. The number of PSUs for Panel 30 is based on the number of PSUs associated with MEPS after the 2016 NHIS sample redesign, the eighth such MEPS panel under this design. The reduction in the number of PSUs after Panel 22 stems from further modifications to the NHIS design. The MEPS sample units presented are RUs, each representing a set of related persons living together within the same NHIS-responding household selected for MEPS participation. Related members of the NHIS households sampled for MEPS who move as a unit during the MEPS data collection period (as well as separate individuals) form new RUs for interviewing purposes. Each new RU is followed over the course of the five MEPS data collection rounds and interviewed at their new address.
| Panel | Initial sample size (RUs) | MEPS PSUs |
|---|---|---|
| 1 | 10,799 | 195 |
| 2 | 6,461 | 195 |
| 3 | 5,410 | 195 |
| 4 | 7,103 | 100 |
| 5 | 5,533 | 100 |
| 6 | 11,026 | 195 |
| 7 | 8,339 | 195 |
| 8 | 8,706 | 195 |
| 9 | 8,939 | 195 |
| 10 | 8,748 | 195 |
| 11 | 9,654 | 195 |
| 12 | 7,467 | 183 |
| 13 | 9,939 | 183 |
| 14 | 9,899 | 183 |
| 15 | 8,968 | 183 |
| 16 | 10,417 | 183 |
| 17 | 9,931 | 183 |
| 18 | 9,950 | 183 |
| 19 | 9,970 | 183 |
| 20 | 10,854 | 183 |
| 21 | 9,851 | 183 |
| 22 | 9,835 | 168 |
| 23 | 9,960 | 143 |
| 24 | 9,976 | 139 |
| 25 | 10,008 | 139 |
| 26 | 9,674 | 150 |
| 27 | 9,700 | 150 |
| 28 | 9,800 | 139 |
| 29 | 10,424 | 146 |
| 30 | 7,879 | 139 |
MEPS data collection is conducted in two main fielding periods each year. Typically, during the January–June period, Round 1 of the new panel and Rounds 3 and 5 of the two continuing panels are fielded, with the panel in Round 5 retiring at midyear. Normally, during the July–December period, Round 2 of the new panel and Round 4 of the remaining continuing panel are fielded.
Table 1.2 summarizes the combined workload for the January–June and July–December periods from spring 2019 through fall 2025. These counts were calculated by adding all RUs sampled for Round 1 or rolled over from the previous round completions and to any split or student RUs generated during the field period. Spring includes all Round 1, 3, and 5 cases, and fall contains Round 2 and 4 cases.
Throughout the years shown in Table 1.2, the combined spring and fall workload has ranged from a low of 28,210 in 2025 to a high of 40,168 in 2021. Typically, the interviewing workload during the spring field period—when three panels are active—is substantially larger than during the fall, when only two are active. In 2025, there were three active panels in the spring field period and two in the fall field period. The spring field period had fewer cases, with a decrease in the Round 1 sample to 7,967. A total of 18,502 cases were fielded in the spring, while the fall workload had 9,708 RUs.
| Data collection period | RU-level sample size* |
|---|---|
| January – June 2020 | 22,667 |
| Panel 23, Round 5 | 6,413 |
| Panel 24, Round 3 | 6,382 |
| Panel 25, Round 1 | 9,872 |
| July – December 2020 | 15,633 |
| Panel 23, Round 6 | 5,264 |
| Panel 24, Round 4 | 5,574 |
| Panel 25, Round 2 | 4,795 |
| January-June 2021 | 23,340 |
| Panel 23, Round 7 | 4,624 |
| Panel 24, Round 5 | 4,879 |
| Panel 25, Round 3 | 4,328 |
| Panel 26, Round 1 | 9,509 |
| July-December 2021 | 16,828 |
| Panel 23, Round 8 | 4,093 |
| Panel 24, Round 6 | 4,048 |
| Panel 25, Round 4 | 3,768 |
| Panel 26, Round 2 | 4,919 |
| January – June 2022 | 24,465 |
| Panel 23, Round 9 | 3,673 |
| Panel 24, Round 7 | 3,573 |
| Panel 25, Round 5 | 3,339 |
| Panel 26, Round 3 | 4,180 |
| Panel 27, Round 1 | 9,700 |
| July – December 2022 | 12,491 |
| Panel 24, Round 8 | 3,174 |
| Panel 26, Round 4 | 3,866 |
| Panel 27, Round 2 | 5,451 |
| January – June 2023 | 18,155 |
| Panel 24, Round 9 | 3,019 |
| Panel 26, Round 5 | 3,585 |
| Panel 27, Round 3 | 4,882 |
| Panel 28, Round 1 | 6,669 |
| July – December 2023 | 10,411 |
| Panel 27, Round 4 | 4,564 |
| Panel 28, Round 2 | 5,847 |
| January – June 2024 | 20,678 |
| Panel 27, Round 5 | 4,497 |
| Panel 28, Round 3 | 5,757 |
| Panel 29, Round 1 | 10,424 |
| July – December 2024 | 11,654 |
| Panel 28, Round 4 | 5,127 |
| Panel 29, Round 2 | 6,527 |
| January – June 2025 | 18,502 |
| Panel 28, Round 5 | 4,822 |
| Panel 29, Round 3 | 6,773 |
| Panel 30, Round 1 | 7,967 |
| July – December 2025 | 13,403 |
| Panel 29, Round 4 | 4,928 |
| Panel 30, Round 2 | 4,780 |
* RU-level sample size for this table was derived from field management system counts and operational reports detailing the fielded sample.
Each new MEPS panel includes some oversampling of population groups of particular analytical interest. From 2010 (Panel 15) through 2025 (Panel 30), the set of sample domains included oversamples of Asian, Black, and Hispanic populations. All NHIS households on the MEPS sample frame that have at least one household member in any of these three categories (Asian, Black, or Hispanic) are included in the MEPS sample with certainty. “White and other race” households have been partitioned into two sample domains and subsampled at varying rates across the years. These domains reflect whether an NHIS-responding household characterized as “White or other race” provided “complete” information at the household level for NHIS or whether only “partially complete” information was provided. Oversampling of Asian, Black, and Hispanic domains was discontinued in 2026 (Panel 31).
For context, the partitioning of the “White, other” domain into these two domains began in 2011 (Panel 16). The partial completes were sampled at a lower rate than the full completes to lessen the impact on the field effort from the difficulty of gaining these households’ cooperation. The last two columns in Table 1.3 show the subsampling rates for the two groups since Panel 16. Before Panel 29, the partial completes in the “White, other” domain were subsampled at rates ranging from 40 percent (Panel 17) to 80 percent (Panel 27). For Panel 29, to maximize the sample size amid concerns about response rates, all partial completes in the “White, other” domain were kept in the sample. For Panel 30, according to the procedure in place since Panel 16, the partial completes in the “White, other” domain were subsampled at a lower rate than the full completes. Table 1.4 shows the Panel 30 sample distribution by domain. Of note, partial completes historically require more effort, are more likely to refuse, and result in a significantly lower response rate.
| Panel | Percentage with partially completed interviews among all “White, other”* | Subsampling rate for NHIS completes in “White, other” domain* |
Subsampling rate for NHIS partial completes in “White, other” domain* |
|---|---|---|---|
| 4 | 21 | ||
| 5 | 24 | ||
| 6 | 22 | ||
| 7 | 17 | ||
| 8 | 20 | ||
| 9 | 19 | ||
| 10 | 16 | ||
| 11 | 23 | ||
| 12 | 19 | ||
| 13 | 25 | ||
| 14 | 26 | ||
| 15 | 21 | ||
| 16 | 30 | 79 | 46 |
| 17 | 18 | 51 | 40 |
| 18 | 23 | 63 | 43 |
| 19 | 20 | 66 | 42 |
| 20 | 22 | 84 | 53 |
| 21 | 25 | 81 | 49 |
| 22 | 22 | 77 | 49 |
| 23 | 21 | 68 | 43 |
| 24 | 17 | 79 | 50 |
| 25 | 11 | 92 | 79 |
| 26** | 15 | ||
| 27 | 14 | 81 | 80 |
| 28 | 16 | 98 | 61 |
| 29 | 15 | 100 | 100 |
| 30 | 15 | 55 | 39 |
Note: Domains in this table did not apply to Panels 1–3.
* The figures in the second column of the table are the proportion of partial completes among all “White, other” in the delivered sample. The figures in the third and fourth columns are subsampling rates applied to the two “White, other” subdomains in Panels 16–30.
** Panel 26 rates were left blank because subsampling was done by size of state rather than the race/ethnicity domain.
| Sample domain | Number | Percentage |
|---|---|---|
| Asian | 814 | 10.33 |
| Black | 1,342 | 17.03 |
| Hispanic | 2,013 | 25.55 |
| White, other | 3,710 | 47.09 |
| NHIS complete | 3,284 | 41.68 |
| NHIS partial complete | 426 | 5.41 |
| Total | 7,879 |
1.2 Sample Delivery and Processing
The 2025 MEPS sample was received from the Agency for Healthcare Research and Quality (AHRQ) and the National Center for Health Statistics (NCHS) in two deliveries. The first delivery, containing households sampled from the first and second quarters of the 2024 NHIS, was received on September 13, 2024. The second delivery, containing households selected from the third quarter of NHIS, was received on November 26, 2024.
The September delivery of the majority of the new sample is instrumental to the project’s schedule for launching interviews in early January each year. The partial file gives insight into the demographic and geographic distribution of the households in the new panel. This information, combined with information on older panels continuing in the new year, guides project decisions on the number and location of new interviewers to recruit.
Upon receipt of the first portion of the 2025 sample, project staff also reviewed the NHIS sample file formats to identify any new variables or values and make any necessary changes to the project programs that use the sample file information. Following this initial review, staff proceeded with the standard processing through which the NHIS households are reconfigured to conform to MEPS RU definitions and prepared the files needed for advance mailouts and interviewer assignments. The early sample delivery also allows time to check and update NHIS addresses, improving the quality of the initial mailouts and identifying households that have moved since the NHIS interview.
2. Instrument and Materials Design
2.1 Introduction
This chapter describes the overall design of the instruments and materials used to collect MEPS-HC data. Notable changes made for 2025 are detailed, as well as the procedures for testing these changes before implementation.
2.2 Overview of MEPS Instruments
MEPS-HC interview data are collected through a computer-assisted personal interviewing (CAPI) instrument. Since 2018, the MEPS-HC CAPI instrument has been programmed in Blaise 4.8. Both English and Spanish versions of the instrument are available. The same CAPI instrument is also used for computer-assisted video interviewing (CAVI).
The MEPS-HC CAPI instrument is divided into sections that address specific topics such as medical conditions, visits with healthcare providers, hospital stays, health insurance, and prescribed medicines. Certain core questions are asked in every round of the study, while other questions are asked in specific rounds only. Information collected for a household in previous rounds is brought forward into the current round’s interview for updating, so that a complete picture of a household’s medical care and the cost for that care will be captured for a 2-year period over five rounds of interviewing. The CAPI instrument’s ability to tailor each interview to reflect the experiences of each household reduces the burden on interviewers and respondents and allows MEPS-HC interviews to proceed more smoothly.
The basic flow of the Round 1 MEPS-HC interview is displayed in Figure 2.1.
During Rounds 2–5, supplemental sections are added to the core MEPS-HC interview content. Table 2.1 lists the current supplemental sections as of 2025 and the rounds in which they are administered. Periodically, these supplemental sections will be updated or replaced.
| Supplemental section | Round 1 | Round 2 | Round 3 | Round 4 | Round 5 |
|---|---|---|---|---|---|
| Child Preventive Health | X | X | |||
| Quality Supplement | X | X | X | X | |
| Access to Care | X | X | |||
| Food Security | X | X | |||
| Financial Well-Being | X | X | |||
| Income | X | X | |||
| Assets | X |
In the Respondent Forms section of the CAPI instrument, authorization forms are collected, distributed, or both. MEPS collects signed medical provider authorization forms for key household members who received medical care from certain types of providers. MEPS also collects signed pharmacy authorization forms for key household members who obtained prescription drugs from a pharmacy or by mail order. These signed authorization forms allow the survey to contact healthcare providers directly for information to supplement the data collected during the household interview. Securing authorization to contact these providers is essential to MEPS’s success.
Table 2.2 lists the MEPS authorization forms and the rounds in which they are requested. During Round 1 interviews, medical provider authorization forms are requested only for hospital-based care, including hospital stay, emergency room, and outpatient department events. During Rounds 2–5 interviews, authorization forms are also requested for medical provider visits, home health, institutional care, telehealth events, and pharmacies.
| Authorization forms | Round 1 | Round 2 | Round 3 | Round 4 | Round 5 |
|---|---|---|---|---|---|
| Medical provider authorization forms for hospital stay (HS), emergency room (ER), and outpatient department (OP) events | X | X | X | X | X |
| Medical provider authorization forms for medical provider visits (MV), home health (HH), institutional care (IC), and telehealth (TH) events | X | X | X | X | |
| Pharmacy authorization forms | X | X | X | X |
To complement the main MEPS-HC interview, key adult household members are also asked to complete one or more supplemental self-administered questionnaires (SAQs). The topics of these SAQs rotate. In 2025, five unique SAQs were requested or underwent follow-up, as shown in Table 2.3.
| Self-administered questionnaires | Spring 2025 | Fall 2025 |
|---|---|---|
| “Understanding Your Health and Impacts of Healthcare Costs” (The Burden and Economic Impacts of Medical Care self-administered questionnaire [ESAQ]) | Rounds 3 and 5 | |
| “A Survey About Your Diabetes Care” (Diabetes Care Supplement [DCS]) | Rounds 3 and 5 | |
| “Your Health and Health Opinions” (preventive care self-administered questionnaire [PSAQ]) | Rounds 3 and 5 follow-up | |
| “Your Experiences with Cancer” (cancer self-administered questionnaire [CSAQ]) | Rounds 3 and 5 follow-up | |
| “Your Health and Health Opinions” (Adult self-administered questionnaire [SAQ]) | Rounds 2 and 4 |
SAQs are discussed and requested in the Quality Supplement (QS) section of the CAPI instrument. Most MEPS SAQs are available as multimode (web and paper) questionnaires, though the Diabetes Care Supplement (DCS) and follow-up for the cancer self-administered questionnaire (CSAQ) are available only as a paper questionnaire. All MEPS web SAQs are hosted at http://www.MEPSDocs.org/survey. Every invitation and reminder message about web SAQs includes this URL, as well as a unique personal identification number (PIN) the household member must use to log in to their survey.
2.3 Instrument Changes for 2025
For each data collection cycle, AHRQ and Westat work together to define a set of modifications to the CAPI instrument and SAQs. Some modifications are new items or new sections, whereas others are updates or fixes to existing items. The notable changes for 2025 are summarized in this section.
Hospital Stay Admissions and Discharges. For multiple items about hospital stays, the wording was updated to ask about “discharges” in addition to, or instead of, “admissions.” This change was intended to improve probing about and capturing details of hospital stay events, including those that began before the person’s reference period.
Home Health and Adult Daycare. At AHRQ’s request, several home health–related items and show cards were revised to explicitly include adult daycare services, ensuring these services are consistently reported in MEPS. Although adult daycare occurs outside the home, the services provided—such as personal care, skilled medical care, and companionship—are similar to those provided by home healthcare providers and, therefore, fall within the same conceptual domain. To reflect this, wording updates were made to items in the Provider Probes, Event Enumeration, and Event Roster sections. Because adult daycare is now treated as part of the home health event type, numerous home health (HH) utilization items were revised to be more general in scope. For example, HH90 previously asked whether someone “usually came to the home” to provide care, but the revised wording asks about “care usually provided by someone,” making the item inclusive of services received either at home or from an adult daycare provider.
Questions About Laboratory Testing. To increase the number and variety of laboratory tests reported by respondents, changes were made to items in the Provider Probes, Medical Provider Visit, and Event Follow-Up sections. Most notably, PP80 was updated specifically to refer to “medical testing, such as bloodwork, x-rays, or other tests,” as well as to mention “samples collected at home and returned to a lab.” The related show card (PP-10) was updated to begin with “Medical testing at places such as...”; common laboratory chains such as Quest or Labcorp were added as examples.
Medical Equipment and Disposable Supplies. In the Other Medical Expenses section, the order of items that ask about medical equipment and disposable supplies was revised so that equipment is now asked about first. Additionally, the related show cards (which list numerous examples of common medical equipment and supplies) were both updated. Some of the notable show card additions included infusion equipment, CPAP machines, and prosthetic devices (for medical equipment); supplies for oxygen and CPAP machines; and at-home testing supplies such as pregnancy or COVID-19 tests (for disposable supplies).
Provider Look-up. To include more customized and meaningful search results within the provider look-up, the maximum distance from the household was reduced for person–provider pairs. This assumes that people are generally willing to travel farther to receive care from hospitals or facilities than they are to see individual physicians. The new maximum distance for person–providers in the look-up varies based on urbanicity, according to the rural-urban commuting area code defined by the U.S. Department of Agriculture. For example, if the household is in a large city or metropolitan area, the look-up now includes person–providers within 25 miles. For a household in a rural area, the look-up now includes person–providers within 70 miles. Reducing the maximum distance means that fewer unlikely providers will be displayed in the look-up search results, making the search process more efficient.
Child Health. To mirror wording in the Consumer Assessment of Healthcare Providers and Systems (CAHPS) Health Plan 5.1 version, updates were made to various items in the child preventive health section (CS190, CS210, CS220, CS230) from which these questions were drawn.
Place Type for Usual Source of Care (USC). Data delivery review indicated that USC providers who were person–providers but were linked to facilities had associated missing data for type of facility (AC50-PlaceType), which required editing after data collection. Routing was updated so that these USC providers routed to AC50. This change routed more providers associated with facilities through AC50 and increased the amount of substantive data collected.
Health Insurance (HX) and Related Sections. To counter an observed issue where the dental insurer name was mistakenly reported in lieu of the insurance name for the hospital, physician, or Medicare supplement coverage, multiple changes were implemented. First, the questions in HX Loop_60 and OE Loop_10 were reordered, moving the item about separate dental coverage (HX625/OE135) to the end of each insurance policy loop. In addition, soft checks were added at multiple items where plan names are collected to flag entries that contain the word “dental.” When triggered, these checks prompt interviewers to confirm that the reported insurer actually provides hospital and physician coverage rather than dental-only benefits. All interviewers also received focused training on the revised series and how to correct prior-round errors. Together, these revisions were intended to improve data accuracy by preventing dental insurer names from being mistakenly recorded as the main medical insurance plan name.
Checks for Phone Numbers. To ensure consistent validation of phone numbers collected by MEPS, we updated instrument checks at multiple items. The updates affected eight items across the Reenumeration and Contacting Module sections. Under the revised rules, phone numbers must contain exactly 10 digits, cannot consist of the same digit repeated 10 times, and cannot begin with a zero. If these requirements are not met, the interviewer is prompted to correct the entry or enter “Don’t know” (F5) when the full phone number is unknown.
QS and SAQs. MEPS SAQ requests are introduced or undergo follow-up during the QS section of the main household interview. As previously summarized in Table 2.3, five MEPS SAQs were administered in 2025. The content of the “Your Health and Health Opinions” PSAQ (follow-up from fall 2024), cancer SAQ (follow-up from fall 2024), and DCS was unchanged from prior years.
“Understanding Your Health and Impacts of Healthcare Costs” (The Burdens and Economic Impacts of Medical Care SAQ [ESAQ]) was entirely new to MEPS for 2025. The web and paper instruments were developed based on content requirements from AHRQ. The final ESAQ instrument included 31 items, and completion time was estimated at 10 minutes. Content included questions about health-related quality of life, affordability of and access to care, time spent on care seeking and medical bills, work and lost productivity, and informal caregiving.
The 2025 “Your Health and Health Opinions” Adult SAQ was largely the same as in prior years, with a few new items added about height and weight (to allow for calculation of BMI), as well as use of e-cigarettes and vaping. Updates to the hard-copy and web versions of the SAQ CAHPS items (questions 11, 13, 14, and 15) were made to mirror the wording in the CAHPS Health Plan version 5.1.
2.4 Testing of the Instruments and Interviewer Management System
Testing for the spring 2025 (Rounds 1, 3, and 5) instruments was conducted between September and December 2024. Testing for the fall 2025 (Rounds 2 and 4) instruments was conducted between March and June 2025. Since 2018, many of the testing approaches and procedures used for the technical upgrade have been continued or adapted to maintain a comprehensive testing plan that supports the ongoing instrument development schedule.
CAPI instrument development and testing included multiple programming and testing iterations that each lasted several weeks. Testing was conducted by a mix of corporate testers, MEPS project staff, and trained programming staff. Project and systems staff performed all testing in close coordination with the design team. AHRQ was provided the opportunity to conduct testing on the alpha and beta releases.
The testing ensured that CAPI followed the design as intended and assessed whether the layout of the overall screen for a given question, and across questions, consistently met the requirements designed to minimize measurement error. Feature testing thoroughly tested all new features against specifications, including wording, text fills, legal and illegal responses, boundary conditions, and skip patterns. Testers validated every possible variation allowed by the specifications.
Both scripted and free-form testing were used throughout the development and testing process. A full suite of scripted test cases was defined by the design staff and analytical leads at Westat and is updated each cycle. These scripted test cases represent approximately 80 percent of the cases fielded, including common paths through the CAPI instrument across all panel rounds. The test script suite was executed through alpha and beta testing for the spring and fall testing cycles.
In contrast, free-form testing focused on design changes in the current instrument build and ensured that any reported instrument bugs had been fixed. Free-form testing was also used to ensure the stability of the CAPI data model and evaluate the stored data in new or unusual situations. Testers routinely pushed array limits, returned to previous screens, changed answers, and used break-off and restart cases to challenge performance boundaries.
Additional testing approaches, including enhanced integration testing and ad hoc/free-form testing, were also conducted. The enhanced integration testing allowed project staff to check electronic face sheet information, test the RU Information module and the Interviewer Assignment Sheet (IAS), and make entries in the electronic record of calls (EROCs) and refusal evaluation form. The ad hoc testing component used information derived from actual cases to verify that all management information was brought forward correctly from previous rounds. Using actual case data also allowed staff to check uncommon paths through the MEPS instrument so that specific changes to the questionnaire could be thoroughly tested.
The spring and fall 2025 development cycles also included extensive testing related to multimode SAQs. This included unit and integrated testing of the revised screens, as well as routing in the CAPI instrument and the web version of the Adult SAQ. The following were also tested: data entered via web, text and email invitations and reminders, the MEPSDocs website, and receipt procedures, including the use of various devices to access and complete the web surveys.
2.5 Changes to Materials and Procedures for 2025
The manuals and materials for the 2025 field effort were updated as needed to reflect changes to the questionnaire and management systems. This section describes the key changes to the materials and procedures.
2.5.1 Instructional Manuals
The electronic field interviewer procedures manual was updated to address changes in field procedures and updates to the Interviewer Management System (IMS).
2.5.2 Electronic Case Materials
To support preparation for upcoming interviews, the electronic face sheet in the IMS provides interviewers with information needed to contact their assigned households and familiarize themselves with the composition of the household and relevant details about their history with the survey. In spring 2025, the Advance Contact Record section of the Round 1 face sheet was updated to display additional information collected during advance calls. In fall 2025, the Review of RU Information section of the face sheet for later rounds was updated to display additional information collected in the RU Information module during the previous round.
To document activities while working their cases, interviewers enter EROCs; they can also update contact information and enter field notes in their IMS. In fall 2025, the EROC form was enhanced to better capture text and email exchanges between interviewers and respondents.
At the conclusion of the household interview, the respondent is given a $50 prepaid debit card to thank them for their participation. To activate the debit card, the interviewer completes a Payment module in the IMS by typing a unique activation code into the module twice. In fall 2025, the Payment module was updated for CAVI interviews to request the home office send debit cards, eliminating the need for the interviewer to mail a debit card and improving tracking.
After every interview, the interviewer completes an RU Information module to document operational information to help the next round’s interviewer effectively work each case. In spring 2025, new questions were added to collect details about the interview mode.
To support follow-up for authorization forms and SAQs not completed at the time of the interview, an online module in the Study Management System (SMS) provides interviewers with the needed information to follow up and the ability to document their follow-up efforts. In fall 2025, information about recent and scheduled reminders was added to improve interviewer follow-up. Interviewers continued to be equipped with iPhones and the mobile field operating system (MFOS) application for their MEPS work. Many of the same features available in the IMS are available in MFOS, including viewing face sheets, entering EROCs, updating contact information, taking notes, and completing the RU Information module. However, the Payment module and online follow-up module are not available in MFOS.
2.5.3 Respondent Materials
Annual updates were made to all respondent letters, the monthly planner, SAQs, and the Income Job Aid. In 2025, references to COVID-19 were removed from all respondent materials.
The MEPSDocs website continues to be available to respondents to boost cooperation, ease legitimacy concerns, and offer record-keeping tools. In addition, the MEPSDocs website has links to the show cards in both English and Spanish that interviewers can access during CAVI interviews (using Zoom in spring 2025 and then switching to Microsoft Teams in the fall to display the electronic show cards) and respondents can access during telephone interviews. The MEPSDocs website also hosts all web SAQs.
3. Recruiting and Training
3.1 Field Interviewer Recruiting for 2025
Overview. MEPS started spring 2025 data collection with 239 experienced interviewers. Only a single recruiting period was required for staffing 2025 data collection. Recruiting started in late 2024 with a goal of increasing staffing to about 300 interviewers by March 2025.
We calculated staffing needs based on projected completes and hours per complete (HPC), based on staff committing to a part-time schedule of 20 hours per week. In addition, MEPS collected data in 147 different PSUs, which can encompass multiple counties, including across state borders; multiple locations add to the complexity of estimating needed staff. The goal is not only to have enough staff to meet targets but also to reduce the need for travel and encourage respondent participation.
All MEPS staff are trained to conduct CAVI. Throughout 2025, MEPS also employed a team of interviewers—16 in the spring and 14 in the fall—who focused primarily on completing CAVI cases across the country; this group completed almost 1,400 interviews. To support unstaffed or understaffed PSUs, eight staff members were added to the MEPS travel team. This team helped MEPS attain its production goals and reduce costs in these unstaffed areas by providing coverage to respondents willing and able to participate using CAVI.
To put the recruiting and attrition numbers into historical perspective, Table 3.1 summarizes MEPS staffing for the period of 2021–2025.
| Data collection period | Experienced interviewers staffed | New interviewers staffed* | Total interviewers for spring data collection |
|---|---|---|---|
| Spring 2021 | 272 | 147 | 419 |
| Spring 2022 | 267 | 93 | 360 |
| Spring 2023 | 267 | 103 | 370 |
| Spring 2024 | 259 | 61 | 320 |
| Spring 2025 | 239 | 72 | 311 |
* The category “New interviewers staffed” includes the interviewers who were trained throughout the year’s attrition trainings. This column represents the total number of new interviewers staffed for the entire year shown.
Recruiting. Westat uses the Field Interviewer Recruitment Module (FIRM) software designed to manage the data collector recruiting process. This system works in conjunction with BrassRing, an online application system used to collect, track, and manage applications for all positions at Westat. The BrassRing system collects applications from both external (new to Westat) and internal (current or former Westat field data collectors) applicants.
Two recruiting and training periods were originally planned, with a goal of recruiting 40 new interviewers for the March training and another 40 during supplemental recruitment for an August training, aiming for a total of 80 new interviewers for 2025.
However, MEPS was able to take advantage of another Westat project with more experienced field interviewers than they would need for their upcoming data collection period. This list of staff was cross-referenced against locations where MEPS needed staff, and, following an interview with a MEPS field manager, a change of assignment was completed for 43 experienced Westat interviewers.
A recruiting process took place from mid-December 2024 to early February 2025. Forty-nine candidates accepted field interviewer positions.
Between the regular recruiting process and the available number of change-of-assignment staff, only one MEPS training session was conducted in March 2025, instead of two as originally planned (one in March; one in August).
A total of 92 people accepted the initial offer; of these, 73 attended training (1 interviewer did not complete the training), and 5 of the change-of-assignment interviewers and 14 of the other candidates withdrew prior to the start of new hire training.
Interviewer Attrition During 2025 Data Collection. During the spring data collection, 32 new interviewers and 38 experienced interviewers were lost to attrition. An additional 10 new interviewers and 23 experienced interviewers were lost during the fall round. The breakdown of 2025 interviewer attrition is shown in Table 3.2.
| Data collection period | New interviewers lost | Experienced interviewers lost | Total interviewers lost | |||
|---|---|---|---|---|---|---|
| Number | Percentage | Number | Percentage | Number | Percentage | |
| Spring 2021 | 64 | 40.8 | 33 | 12.1 | 97 | 22.6 |
| Spring 2022 | 38 | 36.2 | 32 | 12.0 | 70 | 18.8 |
| Spring 2023 | 30 | 29.1 | 40 | 15.0 | 70 | 18.9 |
| Spring 2024 | 17 | 29.0 | 43 | 16.6 | 60 | 18.9 |
| Spring 2025 | 32 | 44.4 | 38 | 16.0 | 70 | 22.5 |
| Fall 2020 | 16 | 19.5 | 8 | 3.7 | 24 | 8.0 |
| Fall 2021 | 30 | 31.6 | 27 | 11.3 | 57 | 17.1 |
| Fall 2022 | 13 | 19.4 | 26 | 11.0 | 39 | 12.9 |
| Fall 2023 | 18 | 24.6 | 22 | 9.7 | 40 | 13.3 |
| Fall 2024 | 22 | 30.6 | 21 | 9.7 | 43 | 14.9 |
| Fall 2025 | 10 | 25.0 | 23 | 11.4 | 33 | 13.7 |
Table 3.2 shows the overall attrition rate during the spring and fall data collection periods from 2021 through 2025. The total spring 2025 attrition rate of 22.5 percent is the highest since spring 2021 because of a very high attrition rate among the 2025 new hires. Many interviewers were recruited from the Population Assessment of Tobacco and Health (PATH) Study, and we suspect that the increased complexity associated with administering MEPS led to unexpectedly high attrition.
Table 3.2 also shows the overall attrition rate during the fall data collection period from 2021 through 2025. The total fall 2025 attrition rate was 13.7 percent, declining slightly from fall 2024; this reflects a lower attrition rate for experienced interviewers compared with fall 2024.
Total attrition for 2025 (as shown in Table 3.3) was 33.1 percent, the highest since 2021. This is mainly attributed to the very high attrition rate among new interviewers, which averaged 51.4 percent over the last five years and reached 58.3 percent in 2025, also the highest since 2021. Looking ahead to 2026, MEPS will again aim to expand the interviewing staff to approximately 300 interviewers, supported by recruitment strategies that emphasize better role fit and clearly define job expectations.
| Data collection period | New interviewers lost | Experienced interviewers lost | Total interviewers lost | |||
|---|---|---|---|---|---|---|
| Number | Percentage | Number | Percentage | Number | Percentage | |
| 2021 | 92 | 58.6 | 60 | 22.1 | 152 | 35.4 |
| 2022 | 51 | 48.6 | 57 | 21.4 | 108 | 29.0 |
| 2023 | 48 | 46.6 | 62 | 23.2 | 110 | 29.7 |
| 2024 | 41 | 45.1 | 64 | 24.7 | 105 | 30.0 |
| 2020 | 42 | 58.3 | 61 | 25.5 | 103 | 33.1 |
3.2 2025 Interviewer Training
The overall structure for training new interviewers in 2025 was drawn from the 2024 training plan. The goals of the 2025 trainings were to address the challenges associated with the recruitment and retention of field data collectors through several approaches, including engagement of new hires between the time of hire and in-person training, reduction of the length and complexity of training, and additional opportunities for interaction between new hires and existing field data collectors.
The 2025 training package reflected a blended training approach that included 5.5 days of in-person training focused on later-round interviewing, preceded by asynchronous and synchronous virtual content; CAVI training as part of in-person training, with post-training follow-up; a post-asynchronous training on additional topics; and a 2-day virtual training focused on Round 1 interviewing.
Westat piloted a redesigned training approach in 2024, launching its first fall cycle new hire training in August. This change moved onboarding out of the busy January schedule and allowed new field interviewers to start with later-round interviews, granting them several months of experience before transitioning to Round 1. The August 2024 new hire session, followed by Round 1 training in December, marked the first full implementation of this reimagined model. Building on this pilot, the 2025 shift moved the main new hire training from January to March 11–16, 2025, with Round 1 training in mid-April 2025.
Welcome to MEPS Pre-Training Activities. The package included a project laptop, phone equipment, and an interactive self-paced workbook with exercises and online modules, including videos and knowledge checks, administered through Westat’s Learning Management System (LMS). The LMS generated regular reports, allowing home office and field management staff to monitor each trainee’s progress.
New hires received their home study package early so they could complete all assignments before the in-person training, but not so early that key concepts and project terminology degraded before the in-person training began. The training also provided additional practice with the Zoom platform.
Before arriving for in-person training, new hires participated in a virtual Welcome to MEPS session. The goals of this session were to (1) further familiarize trainees with Zoom in preparation for CAVI interviewing and future Round 1 virtual sessions, and (2) help new hires understand what to expect during MEPS training through guidance from both training staff and experienced field staff.
In-Person Training. For the 5.5 days of project-specific training, each trainee was assigned to one of four training classrooms. Classrooms were staffed by a primary trainer, a support trainer, and one or two classroom runners. The selection of trainers for the 2025 new hire training was based on several criteria, including training experience, CAPI instrument experience, and overall project knowledge. Before in-person training, all training and support staff received instruction on the content, activities, procedures, roles, responsibilities, and coordination associated with the sessions.
The training sessions used a variety of formats for presenting material, including lecture, question-and-answer interactions, written exercises, group discussion of problems and resolutions, and activities in which trainees were required to seek answers by consulting project resource materials. Two full mock interviews, mini mock interviews, and dyad role-plays were used throughout the training, which were central to training on both the mechanics and substance of the CAPI instrument.
Mock interviews are scripted practice sessions led by a classroom trainer who serves as both the trainer and “respondent” while trainees take turns as the interviewer. A full mock interview covers the entire interview from Reenumeration through Closing. In contrast, a mini mock interview uses preloaded data so trainees can begin directly at the relevant questionnaire section.
Dyad role-plays paired trainees to conduct an interview with one in the role of interviewer and the other using a script to play the respondent. During dyad sessions, members of the classroom training team circulate to answer questions and work with individuals or pairs of trainees as needed. Dyads are an effective tool for reinforcing questionnaire concepts and building interviewer confidence in administering the instrument. They also provide trainers with an opportunity to assess each trainee’s interviewing skills and mastery of the questionnaire application.
To prepare new hires for CAVI interviewing, CAVI was integrated into the training program. Trainees had the opportunity to practice technical setup and cooperation techniques at in-person training. Enhancements were made to the CAVI lesson to streamline the content and add demonstration software to some of the more complex tasks associated with Zoom and Microsoft Outlook, so that the trainees were not reliant on depictions on paper and in Microsoft PowerPoint. Adjustments to the in-person training package included a revised approach to the health event typing task. Previous iterations of training focused on having trainees practice determining event type based on respondent prompts. To simplify the event typing task and encourage consistency in neutral probing, Westat switched the focus to helping respondents distinguish between hospital outpatient and medical provider events, and between hospital outpatient and hospital stay events. The Interview Quick Reference Guide was updated with prompts to make the distinctions and with definitions of all event types. The lesson on event typing was updated to reflect this approach.
The in-person Gaining Cooperation series included “lightning rounds” where trainees practice addressing respondent concerns in 3-minute intervals. Westat converted one of the sessions into a small group exercise where trainers are better able to hear their responses and give corrective feedback on the responses.
The in-person training component maintained the emphasis on interviewer behaviors and interviewing techniques that facilitate complete and accurate reporting. Trainers were instructed to reinforce good interviewing behaviors during mock interviews. Good interviewing behaviors include reading questions verbatim, training respondents to use records to aid recall, actively engaging respondents on using show cards, and using active listening and probing skills. Trainers called attention to instances in which interviewers demonstrated such behaviors. To enhance trainee awareness of behaviors that affect data quality, dyad scripts included instructions to take a “time-out” at certain interview items to highlight relevant data quality issues.
Trainees who required remedial practice worked one-on-one with training staff after the training day. Training staff provided focused practice based on the trainee’s needs.
Among new hires, 73 started training; 72 completed the in-person training.
Bilingual trainees received an additional half-day of bilingual training immediately following the completion of regular project training. Trainees completed a Round 3 dyad in Spanish. Additionally, trainees practiced advanced cooperation in Spanish. Eleven new interviewers completed the March in-person bilingual training.
MEPS Next Steps Post-Training Activities. After the successful completion of in-person training, new interviewers were required to successfully complete a post-classroom home study, MEPS Next Steps, before beginning fieldwork. It contained interactive exercises in the Advanced Field Operating System (AFOS), Basic Field Operating System Secure Messaging (BSM), and CAPI. The home study also included a memo from the field director reviewing their tasks in preparation for interviewing and provides an “early work period” documentation form to assist them in developing a work plan with their supervisor and completing tasks on time.
In addition to the home study, field supervisors engaged in additional post-training activities with new hires. New hires joined the report call of an experienced field interviewer, reviewed assigned cases, and reported the best contact strategy for each case to their supervisor. Field managers and field supervisors coordinated and implemented a mentoring/buddy plan that paired new hires with experienced field interviewers.
The post-training activities also included on-demand training modules on special topics. These optional modules were assigned to all new hires on the Westat LMS. The two topics, NHIS Students and MEPS Students, are typically relevant only for a few field interviewers. While any new field interviewer could review the material, the goal was to provide targeted training for staff who would encounter these situations.
After the successful completion of in-person training, new interviewers participated in CAVI practice sessions with Westat staff between March 24 and March 30, 2025.
2-Day Round 1 Virtual Training. Westat conducted 2-day trainings on Round 1 concepts in late April 2025. Trainees participated in one of three virtual classrooms. All training sessions contained two synchronous virtual sessions, as well as asynchronous sessions delivered by the LMS.
Day 1 of the training focused on the CAPI interview in Round 1, including how to educate MEPS respondents, important concepts in the Reenumeration section, and the differences from later-round interviewing and data quality compared with the Round 1 CAPI interview. The day 1 asynchronous assignments contained mini mock interviews that focused on the Reenumeration, Calendar, Employment, and Health Insurance sections.
Day 2 focused on the operational tasks associated with the Round 1 interview, including gaining cooperation in Round 1, practicing approaches at the door, and completing the tasks associated with locating Round 1 households. The asynchronous content on day 2 of the training focused on advanced cooperation skills, exercises on the EROCs, and data quality in Round 1.
Seventy-one new hires completed the April 2025 Round 1 training.
3.2.1 Experienced Interviewer Training
Spring 2025 Round 1/3/5 Home Study. The Round 1/3/5 home study in December 2024 was delivered as an e-course. The 3-hour self-paced program contained an instructional memo and a knowledge check. The home study covered spring field schedules, charge codes, mailing procedures, address entry reminders, debit card handling, personal protective equipment (PPE) availability, Zoom password and log-in instructions, and materials to discard or replace. It also provided updated contact procedures, interview modes, SAQ collection procedures, authorization form information, and AFOS and MFOS system changes. CAPI updates included procedures for collecting the one-time Economic Burden SAQ, multiple changes in question text and show cards for the provider probes section related to laboratory events and home health, and procedures for correcting health insurer names.
Fall 2025 Round 2/4 Home Study. The Round 2/4 home study in July 2025 was also delivered as an e-course. The 2-hour self-paced program contained an instructional memo and interactive self-paced modules on the LMS. The training covered updated contacting guidelines; offering and supporting both CAVI and in-person modes (including the transition from Zoom to Teams that began during the fall 2025 field period); high-quality data for MEPS, with a review of best practices; EROC management; debit card procedures; and updates to CAPI and the IMS. The home study included an optional mock interview that could be used at the discretion of field management.
Refresher Training. In 2025, Westat continued with the refresher training framework for interviewer continuous learning and quality improvement through distance learning. The framework draws on three levels of training components: universal, tailored, and targeted.
That year, Westat conducted computer-assisted recorded interviewing (CARI) Rapid Feedback, which personalizes training for experienced field interviewers. Using the CARI system, a group of trained quality control (QC) staff listen to random interviews throughout the field period. These staff code each interview for protocol issues such as reading verbatim, probing without leading, not using show cards, and not establishing professional rapport. All interviewers received both positive and negative feedback via email on every case coded. As needed, QC staff coached interviewers in retraining sessions on how to improve their performance and the importance of following protocols in maintaining high-quality data collection. In weekly meetings with their interviewers, field supervisors provided additional individualized instruction and one-on-one coaching.
Also in 2025, a targeted group of interviewers received training on providing actionable comments. The data quality control (DQC; see Section 6.1.2) home office staff identified interviewers responsible for a high percentage of nonactionable comments. Staff provided customized feedback for this group of interviewers, including specific examples of their comments (removing personally identifiable information [PII]), how each comment could be improved, or why it was unnecessary. Field directors provided tailored retraining incorporating this information to each interviewer. In 2025, Westat developed an e-learning training on complete household reporting. This lesson trains field interviewers on why full household reporting matters in MEPS and how to effectively secure cooperation from all household members while maintaining high-quality data. The lesson also demonstrates advanced CAPI tools that support complete reporting, including anonymous responses, item-level refusals, the Ctrl+S switch feature for flexible self-reporting, and the F2 off-path feature for adding or reviewing information.
3.2.2 Continuing Education for All Interviewers
Weekly Newsletter. In 2025, MEPS continued offering its field interviewer newsletter in a weekly format. The newsletter offers additional training opportunities and delivers content as needed to the field. Topics included CAPI questionnaire information, procedural content, and answers to field interviewer questions.
4. Data Collection
This chapter describes the MEPS-HC data collection operations and provides select results for the five rounds of MEPS-HC interviewing conducted in 2025. It also presents select comparisons with results from prior years. Tables showing results for all years of the study are provided in the appendix.
4.1 Data Collection Procedures
MEPS data collection management relies on a set of interrelated systems and procedures designed to accomplish three goals: efficiency, data quality, and cost containment. The primary MEPS management system is the AFOS, which facilitates case management through case assignment, case status and hours reporting, data quality reporting, and interviewer efficiency. Related systems include the CARI system and the Efficiency Analysis through Geospatial Location Evaluation (EAGLE) GPS validation tool. The CARI system enables review of audio recordings for select interview items to assist in assessing interviewer performance and question assessment. The EAGLE system evaluates the location of an interviewer relative to a respondent’s home, which permits verification that the interview occurred. These resources, along with the implementation of models designed to identify cases with a higher propensity for completion, form a comprehensive framework for the management of MEPS data collection.
As in prior years, respondent contact materials provided respondents with the link to the MEPS website; a toll-free number to Alex Scott, a study representative at Westat; and the link to the Westat website. Calls received to Alex Scott’s line were logged in the call-tracking system, and the appropriate supervisor was notified so that they could take the proper course of action.
For households selected to participate in MEPS, the first potential contact is an advance mailing package sent in waves before the start of Round 1 data collection. These mailings are followed closely by advance contact record (ACR). For Panel 30, Round 1 households, all ACR calls were made by a subset of experienced MEPS interviewers who called households to ask a few questions to determine whether the advance mailing was received and the best time to reach the respondent for an interview. The interviewer also assesses the household’s cooperation level.
Typically, for Round 1 households, interviewers are instructed to make initial contact with the household in person if the respondent was either not reached or demonstrated hesitancy during the ACR call. If a respondent expressed they were willing to make a tentative appointment or were agreeable to participation during the ACR call, the case was first contacted by telephone or text. During ACR calls for Panel 30, Round 1 households, 458 respondents made a tentative appointment, of which 363 completed interviews. Of the Panel 30, Round 1 households where a respondent was reached during the ACR call phase and was rated as more likely to participate, 77 percent ultimately completed an interview. As further evidence of the effectiveness of ACR calls, just under 1,100 Round 1 completed interviews were completed without an initial in-person contact. For later rounds, interviewers were allowed to make initial contacts to set appointments by telephone or text, as long as the household had been cooperative in prior rounds.
In 2025, MEPS interviews were conducted in three modes: in-person, CAVI, and telephone (limited). Interviewers were given guidance throughout each field period on which modes were appropriate for the cases, and interview modes were closely monitored. CAVI interviews were conducted via Zoom and Teams meetings hosted by the interviewer. Zoom was used exclusively during the spring 2025 field period. In fall 2025, the project moved exclusively to Teams to meet federal security requirements.
During CAVI interviews, both interviewer and respondent are visible and audible to one another. During certain parts of the interview, interviewers share show card images to allow respondents to select a response, and respondents may also share images of records. MEPS began offering CAVI interviewing in late spring 2022, which has since become increasingly common, accounting for over 35 percent of completed interviews in the spring 2025 round. Later-round cases were specifically targeted for CAVI interviews; however, CAVI interviews were also permissible for Round 1 cases after initial contact. Interviewers typically offered CAVI when respondents were unwilling to have an interviewer in their home or meet them at an appropriate alternative location. For the final round of data collection (Round 5), 51 percent of cases were completed via CAVI; for Round 3, 36 percent of cases were completed using this mode and, by design, only 18 percent of Round 1 cases were completed via Zoom. During fall 2025, 37 percent of all cases were completed with CAVI: 35 percent for Round 2 and 38 percent for Round 4.
In 2025, authorization forms were collected in one of three ways: eSignature, DocuSign, or paper (more details in Section 4.3). The authorization form procedures varied based on the interview mode and household contact information provided to MEPS. During in-person interviews, available household members signed using the interviewer’s laptop (eSignature). For household members not available during the in-person interview, or for CAVI or telephone interviews, respondents were sent a link via email or text to sign forms in DocuSign. Paper authorization forms were still used when requested or for household members unavailable and not eligible for DocuSign because they did not provide an email address or cellphone number.
The interview follow-up procedures also varied by mode. For CAVI and telephone interviews, the interviewer or home office mailed any paper authorization forms and SAQs (described in Section 2.2) shortly after the interview was completed, along with the MEPS incentive: a $50 prepaid debit card. Form pickup was arranged, or a business reply envelope (BRE) was enclosed to return the forms directly to the home office. Anytime authorization form or SAQs were requested and not collected during the interview, the interviewer made up to three follow-up calls to ensure these supplements were completed and returned.
MEPS field managers and directors continued to manage the field data collection in collaboration with the field supervisors, reinforcing the importance of balancing data quality with production and cost goals across regions.
Throughout the year, Westat continued to review data for all respondents reported to have been institutionalized in order to identify any individuals who might have been inappropriately classified and, as a result, treated as out of scope for MEPS data collection.
Data Collection Schedule. In accordance with changes made in the spring round of 2025, data collection began with Round 1, followed by Round 5 and then Round 3. For Round 1, the early starting date allowed several additional weeks of data collection.
Table 4.1 shows the field period dates for the rounds conducted in 2025.
| Round | Dates | Number of weeks in round |
|---|---|---|
| 1 | January 10–July 14 | 26 |
| 2 | July 28–December 8 | 19 |
| 3 | February 1–June 15 | 19 |
| 4 | July 19–December 8 | 20 |
| 5 | January 24–May 15 | 15 |
4.2 Data Collection Results: Interviewing
Table 4.2 provides an overview of the data collection results for Panels 24–30, including sample sizes, average interviewer hours per completed interview, and response rates. Table 4.3 shows the final response rates a second time, reformatted to facilitate round-by-round comparisons across panels and years. In addition to the main panel rounds, both tables display the extended panel round data for Panel 24.
Of the data collection rounds conducted in 2025, the response rates for Rounds 1–4 showed a slight decrease from 2024 while exhibiting a slight increase in Round 5. Response rates have not returned to pre-pandemic levels despite a return to in-person interviews. For Round 1, HPC decreased slightly, averaging almost 14.8 HPC, compared with 14.9 HPC the prior year. Though 0.1 hours may seem to be a minor difference, it means there were almost 500 fewer contacts. For Round 2, this metric decreased more significantly from 10.0 HPC in 2024 to 9.3 in 2025, reflecting almost 2,800 fewer contacts. These decreases can in part be attributed to the interviewer bonus program and operational clustering of contact attempts.
Overall, interviewer HPC have increased over time, largely due to greater difficulty reaching respondents because technology makes it easier to screen or block contact attempts (caller ID and Ring cameras), as well as heightened privacy concerns. While the total number of contacts has increased, in-person attempts now compose a lower share, with telephone and text accounting for 57 percent of contacts. Many respondents find in-person visits off-putting and are more amenable to initial contact through another mode.
| Panel/Round | Original sample | Split cases (movers) | Student cases | Out-of-scope cases | Net sample | Completes | Average interviewer hours/complete | Response rate (%) | Response rate goal | |
|---|---|---|---|---|---|---|---|---|---|---|
| Panel 24 | Round 1 | 9,976 | 153 | 43 | 82 | 10,090 | 7,186 | 11.8 | 71.2 | 80 |
| Round 2 | 7,211 | 98 | 19 | 5 | 7,323 | 6,777 | 7.9 | 92.5 | 95 | |
| Round 3 | 6,812 | 76 | 9 | 7 | 6,890 | 6,289 | 6.0 | 91.3 | 96 | |
| Round 4 | 6,335 | 44 | 4 | 13 | 6,370 | 5,446 | 5.1 | 85.5 | 97 | |
| Round 5 | 5,510 | 31 | 4 | 15 | 5,495 | 4,770 | 5.3 | 86.8 | 85 | |
| Round 6 | 4,816 | 22 | 8 | 8 | 4,808 | 3,959 | 5.7 | 82.3 | 80 | |
| Round 7 | 4,007 | 28 | 0 | 5 | 4,002 | 3,500 | 5.3 | 87.5 | 87 | |
| Round 8 | 3,528 | 14 | 0 | 9 | 3,519 | 3,121 | 5.9 | 88.7 | 85 | |
| Round 9 | 3,135 | 11 | 1 | 6 | 3,129 | 2,988 | 4.5 | 95.5 | 95 | |
| Panel 25 | Round 1 | 10,008 | 184 | 38 | 78 | 10,152 | 6,265 | 9.6 | 61.7 | 80 |
| Round 2 | 5,907 | 49 | 14 | 12 | 5,958 | 4,677 | 5.5 | 78.5 | 95 | |
| Round 3 | 5,191 | 38 | 5 | 2 | 5,189 | 4,230 | 6.1 | 81.5 | 80 | |
| Round 4 | 4,314 | 40 | 10 | 7 | 4,307 | 3,685 | 7.3 | 85.6 | 97 | |
| Round 5 | 3,712 | 11 | 5 | 6 | 3,706 | 3,278 | 5.3 | 88.4 | 85 | |
| Panel 26 | Round 1 | 9,674 | 160 | 29 | 68 | 9,795 | 5,882 | 11.1 | 60.1 | 70 |
| Round 2 | 6,047 | 83 | 11 | 2 | 6,045 | 4,799 | 9.0 | 79.4 | 95 | |
| Round 3 | 4,882 | 42 | 4 | 6 | 4,876 | 4,103 | 6.8 | 84.1 | 83 | |
| Round 4 | 4,165 | 30 | 10 | 4 | 4,161 | 3,805 | 7.6 | 91.4 | 97 | |
| Round 5 | 3,817 | 11 | 2 | 8 | 3,809 | 3,541 | 4.7 | 93.0 | 92 | |
| Panel 27 | Round 1 | 9,700 | 344 | 41 | 78 | 10,007 | 6,158 | 13.2 | 61.5 | 65 |
| Round 2 | 6,288 | 68 | 11 | 3 | 6,285 | 5,368 | 8.9 | 85.4 | 80 | |
| Round 3 | 5,434 | 37 | 6 | 5 | 5,429 | 4,818 | 7.1 | 88.8 | 90 | |
| Round 4 | 4,880 | 40 | 3 | 12 | 4,868 | 4,509 | 7.3 | 92.6 | 97 | |
| Round 5 | 4,551 | 21 | 4 | 7 | 4,544 | 4,262 | 5.5 | 93.8 | 94 | |
| Panel 28 | Round 1 | 9,800 | 280 | 31 | 75 | 10,038 | 6,527 | 13.7 | 65.0 | 68 |
| Round 2 | 6,640 | 62 | 7 | 5 | 6,635 | 5,766 | 8.7 | 86.9 | 95 | |
| Round 3 | 5,834 | 42 | 2 | 8 | 5,826 | 5,143 | 7.4 | 88.3 | 89 | |
| Round 4 | 5,193 | 51 | 5 | 11 | 5,182 | 4,812 | 7.6 | 92.9 | 94 | |
| Round 5 | 4,822 | 13 | 2 | 9 | 4,828 | 4,582 | 5.5 | 94.9 | 94 | |
| Panel 29 | Round 1 | 10,424 | 251 | 49 | 107 | 10,617 | 6,537 | 14.9 | 61.6 | 65 |
| Round 2 | 6,527 | 77 | 10 | 6 | 6,686 | 5,674 | 10.0 | 85.1 | 89 | |
| Round 3 | 5,713 | 40 | 1 | 6 | 5,748 | 4,894 | 7.5 | 85.1 | 87 | |
| Round 4 | 4,928 | 34 | 3 | 18 | 4,947 | 4,510 | 7.4 | 91.2 | 93 | |
| Round 5 | ||||||||||
| Panel 30 | Round 1 | 7,967 | 96 | 27 | 105 | 7,985 | 4,745 | 14.8 | 59.4 | 65 |
| Round 2 | 4,780 | 48 | 2 | 4 | 4,826 | 3,979 | 9.3 | 82.4 | 87 | |
| Round 3 | ||||||||||
| Round 4 | ||||||||||
| Round 5 | ||||||||||
| Year/panel | Round 1 | Round 2 | Round 3 | Round 4 | Round 5 | Round 6 | Round 7 | Round 8 | Round 9 |
|---|---|---|---|---|---|---|---|---|---|
| 2015 | |||||||||
| Panel 20 | 73.5 | 93.4 | |||||||
| Panel 19 | 94.7 | 96.7 | |||||||
| Panel 18 | 98.4 | ||||||||
| 2016 | |||||||||
| Panel 21 | 74.4 | 93.0 | |||||||
| Panel 20 | 95.1 | 96.8 | |||||||
| Panel 19 | 98.3 | ||||||||
| 2017 | |||||||||
| Panel 22 | 72.6 | 93.3 | |||||||
| Panel 21 | 94.1 | 96.8 | |||||||
| Panel 20 | 96.4 | ||||||||
| 2018 | |||||||||
| Panel 23 | 72.9 | 92.9 | |||||||
| Panel 22 | 95.0 | 96.7 | |||||||
| Panel 21 | 97.8 | ||||||||
| 2019 | |||||||||
| Panel 24 | 71.2 | 92.5 | |||||||
| Panel 23 | 94.6 | 96.2 | |||||||
| Panel 22 | 98.3 | ||||||||
| 2020 | |||||||||
| Panel 25 | 61.7 | 78.5 | |||||||
| Panel 24 | 91.3 | 85.5 | |||||||
| Panel 23 | 97.7 | 79.0 | |||||||
| 2021 | |||||||||
| Panel 26 | 60.1 | 79.4 | |||||||
| Panel 25 | 81.5 | 85.6 | |||||||
| Panel 24 | 86.8 | 82.3 | |||||||
| Panel 23 | 87.3 | 87.6 | |||||||
| 2022 | |||||||||
| Panel 27 | 61.5 | 85.4 | |||||||
| Panel 26 | 84.1 | 91.4 | |||||||
| Panel 25 | 88.6 | ||||||||
| Panel 24 | 87.5 | 88.7 | |||||||
| Panel 23 | 90.2 | ||||||||
| 2023 | |||||||||
| Panel 28 | 65.0 | 86.9 | |||||||
| Panel 27 | 88.8 | 92.6 | |||||||
| Panel 26 | 93.0 | ||||||||
| Panel 24 | 95.5 | ||||||||
| 2024 | |||||||||
| Panel 29 | 61.6 | 85.1 | |||||||
| Panel 28 | 88.3 | 92.9 | |||||||
| Panel 27 | 93.8 | ||||||||
| 2025 | |||||||||
| Panel 30 | 59.4 | 82.4 | |||||||
| Panel 29 | 85.1 | 91.2 | |||||||
| Panel 28 | 94.9 | ||||||||
Table 4.4 illustrates the mode of data collection for each of the 2025 data collection rounds. For Round 1, there is a special focus on in-person interviewing as much as possible to best introduce the study and encourage record-keeping for the entire study. For all other rounds, respondents could choose between CAVI and in person. Telephone was approved only if neither primary mode was feasible.
| Completes | Percentage of complete | In-person | Telephone | Computer-assisted video interviewing (CAVI) | |
|---|---|---|---|---|---|
| Panel 28 | Round 5 | 94.9 | 1,987 | 274 | 2,321 |
| Panel 29 | Round 3 | 85.1 | 2,934 | 217 | 1,743 |
| Round 4 | 91.2 | 2,615 | 172 | 1,723 | |
| Panel 30 | Round 1 | 59.4 | 3,656 | 221 | 868 |
| Round 2 | 82.4 | 2,394 | 195 | 1,390 | |
4.2.1 Components of Response and Nonresponse
Table 4.5 summarizes components of nonresponse associated with Round 1 households by panel beginning in 2020. Before 2020, the components of nonresponse remained relatively stable. The “Other nonresponse” category peaked in 2020, but it has slightly decreased since then. Increases and decreases in the percentage of refusals align closely with corresponding increases and decreases in the completion rate.
| Response and nonresponse components | 2020 Panel 25, Round 1 |
2021 Panel 26, Round 1 |
2022 Panel 27, Round 1 |
2023 Panel 28, Round 1 |
2024 Panel 29 Round 1 |
2025 Panel 30 Round 1 |
|---|---|---|---|---|---|---|
| Total sample | 10,230 | 9,863 | 10,085 | 10,116 | 10,724 | 8,090 |
| Out of scope (%) | 0.8 | 0.7 | 0.8 | 0.8 | 1.0 | 1.3 |
| Complete (%) | 61.2 | 59.6 | 61.1 | 64.5 | 61.0 | 58.7 |
| Nonresponse (%) | 38.0 | 39.7 | 38.2 | 34.7 | 38.0 | 40.0 |
| Refusal | 28.7 | 31.2 | 30.4 | 29.7 | 32.0 | 33.3 |
| Not located | 3.2 | 4.3 | 3.3 | 2.5 | 2.8 | 3.0 |
| Other nonresponse | 6.1 | 4.2 | 4.5 | 2.5 | 3.3 | 3.7 |
Tables 4.6–4.13 summarize results for additional aspects of the 2025 data collection. Because Round 1 is the most difficult of all the rounds, the presentation focuses primarily on Panel 30, Round 1.
4.2.2 NHIS Completion Status
Each year, the MEPS sample includes a number of households classified in NHIS as “partial completes,” in which the interviewer was able to complete part, but not all, of the full NHIS interview. For many of these partial complete NHIS cases, the difficulty experienced by the NHIS interviewer carries over to the MEPS interview—the MEPS response rate for the NHIS partial completes is substantially lower than for the NHIS completes. As noted in Chapter 1, for the 2025 sample, AHRQ implemented the approach applied in most years since 2012: sampling the NHIS partial completes in the “White, other” category at a lower rate than the NHIS completes.
The third row of Table 4.6 shows the proportion of partial completes in the sample over recent years. Since 2020, the proportion of partial completes has increased, but it remained stable in 2025. The proportion in 2025 is one percentage point lower than last year’s. The last two rows of the table show the persistent and substantial difference in response rate between these two components of the sample, with NHIS partial completes about 15 percentage points lower than NHIS completes. In 2025, there was a 15.9 percentage point difference in response rate for NHIS partial cases compared with NHIS complete cases.
| NHIS completion status | 2020 Panel 25, Round 1 |
2021 Panel 26, Round 1 |
2022 Panel 27, Round 1 |
2023 Panel 28, Round 1 |
2024 Panel 29, Round 1 |
2025 Panel 30, Round 1 |
|---|---|---|---|---|---|---|
| Original NHIS sample (N) | 10,224 | 9,863 | 10,085 | 10,110 | 10,724 | 8,090 |
| Percentage complete in NHIS | 89.1 | 85.2 | 83.0 | 84.9 | 81.4 | 82.4 |
| Percentage partial complete in NHIS | 10.9 | 14.8 | 17.0 | 15.1 | 18.6 | 17.6 |
| Percentage complete for NHIS completes | 62.9 | 62.2 | 63.4 | 66.8 | 64.5 | 61.4 |
| Percentage complete for NHIS partial completes | 47.3 | 44.5 | 49.4 | 51.5 | 45.1 | 45.5 |
Note: Figures shown are based on the original NHIS sample and exclude reporting units added to the sample as “splits” and “students.”
* Previously reported figures may be corrected based on the discovery of updated information.
4.2.3 Sample Domain
Table 4.7 presents response information for the NHIS completes and partial completes by sample domain categories for Panel 30. Unlike Table 4.6, Table 4.7 includes RUs added to the sample during Round 1 data collection; it shows the differential in response rates between the NHIS partial completes and full completes persisting across all domains. NHIS partial completes responded at a lower rate in all domains. Within the individual domains, the difference between the response rate for the NHIS completes and the NHIS partial completes was greatest for the “White, other” domain—19.4 percentage points.
| Domain/NHIS status | Net sample (N) | Complete (%) | Refusal (%) | Not located (%) | Other nonresponse (%) |
|---|---|---|---|---|---|
| Asian | 832 | 52.4 | 38.3 | 3.5 | 5.8 |
| NHIS complete | 653 | 57.6 | 33.4 | 3.2 | 5.8 |
| NHIS partial complete | 179 | 33.5 | 56.4 | 4.5 | 5.6 |
| Black | 1,353 | 66.8 | 26.8 | 3.4 | 3.0 |
| NHIS complete | 1,053 | 69.8 | 24.6 | 2.9 | 2.7 |
| NHIS partial complete | 300 | 56.3 | 34.3 | 5.0 | 4.3 |
| Hispanic | 2,062 | 59.6 | 31.0 | 4.7 | 4.8 |
| NHIS complete | 1,559 | 63.2 | 28.3 | 4.1 | 4.4 |
| NHIS partial complete | 503 | 48.1 | 39.4 | 6.6 | 6.0 |
| White, other | 3,738 | 58.2 | 36.8 | 1.9 | 3.1 |
| NHIS complete | 3,310 | 60.5 | 34.8 | 1.8 | 3.0 |
| NHIS partial complete | 428 | 41.1 | 52.1 | 2.8 | 4.0 |
| All groups | 7,985 | 58.7 | 33.3 | 3.0 | 3.7 |
| NHIS complete | 6,575 | 62.3 | 31.5 | 2.6 | 3.5 |
| NHIS partial complete | 1,410 | 45.9 | 44.3 | 4.8 | 5.0 |
Note: Includes reporting units added to the sample as “splits” and “students” from original NHIS households, which were given the same “complete” or “partial complete” designation as the original household.
Table 4.8 presents response information for Panel 30 by interview mode.
| Domain/NHIS status | In person | Telephone | Computer-assisted video interviewing (CAVI) |
|---|---|---|---|
| Asian | 297 | 19 | 120 |
| NHIS complete | 254 | 17 | 105 |
| NHIS partial complete | 43 | 2 | 15 |
| Black | 715 | 50 | 139 |
| NHIS complete | 584 | 35 | 116 |
| NHIS partial complete | 131 | 15 | 23 |
| Hispanic | 955 | 64 | 209 |
| NHIS complete | 770 | 45 | 171 |
| NHIS partial complete | 185 | 19 | 38 |
| White, other | 1,689 | 88 | 400 |
| NHIS complete | 1,571 | 74 | 356 |
| NHIS partial complete | 118 | 14 | 44 |
| All groups | 3,656 | 221 | 868 |
| NHIS complete | 3,179 | 171 | 748 |
| NHIS partial complete | 477 | 50 | 120 |
4.2.4 Refusals and Refusal Conversion
Table 4.9 summarizes the results of refusal conversion efforts by panel. For Panel 30, the rate of “ever refused” RUs increased to 40.7 percent, its highest level in recent years. Of those, 14 percent were ultimately converted.
| Panel | Net sample (N) | Ever refused (%) |
Converted (%) |
Final refusal rate (%) | Final response rate (%) |
|---|---|---|---|---|---|
| Panel 25 | 10,152 | 34.8 | 12.3 | 30.5 | 61.7 |
| Panel 26 | 9,795 | 40.5 | 19.3 | 32.6 | 60.1 |
| Panel 27 | 10,007 | 37.8 | 14.8 | 32.1 | 61.5 |
| Panel 28 | 10,035 | 36.8 | 16.3 | 30.7 | 65.0 |
| Panel 29 | 10,617 | 39.4 | 15.8 | 33.1 | 61.6 |
| Panel 30 | 7,985 | 40.7 | 14.0 | 34.8 | 59.4 |
4.2.5 Tracing and Locating
Table 4.10 shows locating effort results for households that required tracing during the Round 1 field period by panel. The percentage of households that required some tracing in 2025 (10.7%) increased by 1.3 percentage points from 2024 (9.4%). A total of 3.0 percent of households were not located after tracing efforts.
| Panel | Total sample (N) | Ever traced (%) | Not located (%) |
|---|---|---|---|
| Panel 25 | 10,230 | 11.1 | 3.2 |
| Panel 26 | 9,863 | 10.8 | 4.3 |
| Panel 27 | 10,085 | 10.6 | 3.3 |
| Panel 28 | 10,110 | 9.8 | 2.5 |
| Panel 29 | 10,724 | 9.4 | 2.8 |
| Panel 30 | 8,090 | 10.7 | 3.0 |
4.2.6 Interview Length
Table 4.11 shows the mean length (in minutes) for interviews conducted without interruption in a single session in Panels 25–30. There were a larger number of telephone interviews in 2020 and 2021 because of the pandemic shutdown. Additionally, these interviews took longer because interviewers had to read the show cards aloud, thus adding time to the interviews. Starting in 2022 (with Panel 27, Round 1; Panel 26, Round 3; and Panel 25, Round 5), interview times were notably reduced across all rounds. The reduction is largely attributable to the introduction of eSignature and DocuSign for authorization forms. In most cases, interviewers no longer have the burden of preparing paper authorization forms for household member signatures.
| Round | 2020 Panel 25 |
2021 Panel 26 |
2022 Panel 27 |
2023 Panel 28 |
2024 Panel 29 |
2025 Panel 30 |
|---|---|---|---|---|---|---|
| Round 1 | 89.1 | 93.0 | 82.7 | 80.9 | 81.1 | 81.8 |
| Round 2 | 89.7 | 93.3 | 79.3 | 79.7 | 88.2 | 91.1 |
| Round 3 | 99.6 | 90.1 | 86.5 | 89.8 | 93.9 | |
| Round 4 | 93.4 | 76.5 | 78.9 | 83.1 | 86.0 | |
| Round 5 | 75.6 | 74.3 | 75.4 | 77.8 |
Table 4.12 shows the mean length (in minutes) by interview mode conducted without interruption in a single session. While CAVI interviews tend to be slightly longer, some of this time is due to the equipment setup and procedures necessary to conduct a video interview.
| Panel/round | In person | Telephone | Computer-assisted video interviewing (CAVI) |
|---|---|---|---|
| Panel 28 | |||
| Round 1 | 79.8 | 80.2 | 89.2 |
| Round 2 | 80.2 | 68.5 | 78.1 |
| Round 3 | 89.3 | 82.7 | 93.1 |
| Round 4 | 82.3 | 73.9 | 85.3 |
| Round 5 | 78.2 | 72.4 | 78.0 |
| Panel 29 | |||
| Round 1 | 79.8 | 78.6 | 96.6 |
| Round 2 | 88.6 | 80.4 | 87.9 |
| Round 3 | 94.2 | 89.1 | 94.0 |
| Round 4 | 84.4 | 77.5 | 89.5 |
| Panel 30 | |||
| Round 1 | 80.4 | 86.5 | 87.5 |
| Round 2 | 90.1 | 79.9 | 94.6 |
4.2.7 Mean Contact Attempts per Case
Table 4.13 shows mean contact attempts by interview mode and NHIS completion status for all cases in Round 1 of Panels 28–30. Overall contact attempts increased slightly, though NHIS partial cases required more contacts. As noted previously, small increases in HPC across thousands of cases amount to high costs per completed interview. In the spring round, there were approximately 134,000 contacts for all three rounds; 32 percent of these were in person.
| Contact type | Panel 27, Round 1 | Panel 28, Round 1 | Panel 29, Round 1 | ||||||
|---|---|---|---|---|---|---|---|---|---|
| All RUs | Complete | Partial | All RUs | Complete | Partial | All RUs | Complete | Partial | |
| N | 10,110 | 8,579 | 1,531 | 10,724 | 8,729 | 1,995 | 8,090 | 6,670 | 1,420 |
| % of all reporting units (RUs) | 100.0 | 84.9 | 15.1 | 100.0 | 81.4 | 18.6 | 100.0 | 82.4 | 17.6 |
| In-person | 5.5 | 5.3 | 6.7 | 5.2 | 5.1 | 6.1 | 5.4 | 5.2 | 6.6 |
| Telephone | 13.3 | 13.1 | 14.1 | 14.3 | 14.0 | 16.0 | 15.4 | 15.2 | 16.2 |
| Computer-assisted video interviewing (CAVI) | 8.9 | 8.8 | 9.8 | 11.4 | 11.4 | 11.5 | 7.8 | 7.7 | 8.2 |
| Total | 8.5 | 8.1 | 10.3 | 8.8 | 8.5 | 10.3 | 8.8 | 8.4 | 10.4 |
4.3 Data Collection Results: Authorization Form Signing Rates
During the Respondent Forms section of the MEPS CAPI instrument, interviewers are prompted to ask respondents to sign the authorization forms needed to conduct the Medical Provider Component (MPC) of MEPS. They request authorization forms for each unique person–provider pair identified as a source of care for a key member of the household. Medical provider authorization forms are requested for the following: physicians seen in an office-based setting; inpatient, outpatient, or emergency room care received in a hospital; care received from a home health agency; telehealth; and certain stays in long-term care institutions. Pharmacy authorization forms are requested for each pharmacy from which a household member obtained prescription medicines.
There are three modes by which authorization forms can be signed. Respondents who are available at the time of the in-person interview may sign their forms electronically on the interviewer’s laptop (i.e., eSignature). If a respondent is not available or not willing to sign at the time of the in-person interview, or if the interview is being conducted by CAVI or telephone, the respondent can access a link via text or email to sign their forms electronically in DocuSign. Authorization forms may be signed on paper if a respondent is not available to sign on the laptop and does not have a cellphone or email address for DocuSign, if the respondent requests paper, or if the signer is outside the RU.
Table 4.14 shows round-by-round signing rates for the medical provider authorization forms for Panels 23–30. Before 2022, all authorization forms were paper. Starting with the rounds fielded in 2022, the rates are shown for each signature mode and combined across all modes. In 2025, combined rates remained steady for Rounds 3, 4, and 5, but they decreased in Panel 30, Rounds 1 and 2 compared with those rounds in the previous two panels.
| Panel/Round | Signature method | Authorization forms requested | Authorization forms signed | Signing rate (%) | |
|---|---|---|---|---|---|
| Panel 23 | Round 1 | 1,982 | 1,533 | 77.3 | |
| Round 2 | 29,576 | 21,850 | 73.9 | ||
| Round 3 | 23,365 | 14,575 | 62.4 | ||
| Round 4 | 19,220 | 13,483 | 70.2 | ||
| Round 5 | 17,569 | 10,903 | 62.1 | ||
| Round 6 | 12,701 | 8,002 | 63.0 | ||
| Round 7 | 13,254 | 8,108 | 61.2 | ||
| Round 8 | 11,589 | 7,624 | 65.8 | ||
| Round 9 | eSignature | 597 | 542 | 90.8 | |
| DocuSign | 5,867 | 4,528 | 77.2 | ||
| Paper | 2,601 | 1,172 | 45.1 | ||
| Combined | 9,065 | 6,242 | 68.9 | ||
| Panel 24 | Round 1 | 2,285 | 1,306 | 57.2 | |
| Round 2 | 24,755 | 15,865 | 64.1 | ||
| Round 3 | 22,657 | 11,522 | 50.9 | ||
| Round 4 | 14,612 | 7,716 | 52.8 | ||
| Round 5 | 15,992 | 8,941 | 55.9 | ||
| Round 6 | 11,366 | 6,658 | 58.6 | ||
| Round 7 | eSignature | 860 | 799 | 92.9 | |
| DocuSign | 6,856 | 4,997 | 72.9 | ||
| Paper | 3,032 | 1,254 | 41.4 | ||
| Combined | 10,748 | 7,050 | 65.6 | ||
| Round 8 | eSignature | 1,121 | 1,055 | 94.1 | |
| DocuSign | 4,997 | 3,500 | 70.0 | ||
| Paper | 1,625 | 661 | 40.7 | ||
| Combined | 7,743 | 5,216 | 67.4 | ||
| Round 9 | eSignature | 520 | 497 | 95.6 | |
| DocuSign | 4,718 | 3,171 | 67.2 | ||
| Paper | 1,946 | 733 | 37.7 | ||
| Combined | 7,184 | 4,401 | 61.3 | ||
| Panel 25 | Round 1 | 3,110 | 1,242 | 39.9 | |
| Round 2 | 15,259 | 7,292 | 47.8 | ||
| Round 3 | 15,932 | 8,100 | 50.8 | ||
| Round 4 | 11,252 | 7,204 | 64.0 | ||
| Round 5 | eSignature | 3,796 | 3,570 | 94.0 | |
| DocuSign | 3,336 | 2,339 | 70.1 | ||
| Paper | 1,877 | 431 | 23.0 | ||
| Combined | 9,009 | 6,340 | 70.4 | ||
| Panel 26 | Round 1 | 2,432 | 1,151 | 47.3 | |
| Round 2 | 17,765 | 10,564 | 59.5 | ||
| Round 3 | eSignature | 7,510 | 7,043 | 93.8 | |
| DocuSign | 4,668 | 2,980 | 63.8 | ||
| Paper | 2,964 | 419 | 14.1 | ||
| Combined | 15,142 | 10,442 | 69.0 | ||
| Round 4 | eSignature | 6,494 | 6,195 | 95.4 | |
| DocuSign | 2,544 | 1,420 | 55.8 | ||
| Paper | 1,351 | 184 | 13.6 | ||
| Combined | 10,389 | 7,799 | 75.1 | ||
| Round 5 | eSignature | 946 | 893 | 94.4 | |
| DocuSign | 6,057 | 4,250 | 70.2 | ||
| Paper | 1,827 | 461 | 25.2 | ||
| Combined | 8,830 | 5,604 | 63.5 | ||
| Panel 27 | Round 1 | eSignature | 1,222 | 1,147 | 93.9 |
| DocuSign | 523 | 285 | 54.5 | ||
| Paper | 477 | 39 | 8.2 | ||
| Combined | 2,222 | 1,471 | 66.2 | ||
| Round 2 | eSignature | 10,831 | 10,286 | 95.0 | |
| DocuSign | 4,744 | 2,026 | 42.7 | ||
| Paper | 2,855 | 192 | 6.7 | ||
| Combined | 18,430 | 12,504 | 67.8 | ||
| Round 3 | eSignature | 8,199 | 7,648 | 93.3 | |
| DocuSign | 4,961 | 2,651 | 53.4 | ||
| Paper | 2,941 | 197 | 6.7 | ||
| Combined | 16,101 | 10,496 | 56.2 | ||
| Round 4 | eSignature | 7,345 | 7,120 | 96.9 | |
| DocuSign | 3,378 | 2,296 | 68.0 | ||
| Paper | 1,773 | 197 | 11.1 | ||
| Combined | 12,496 | 9,613 | 76.9 | ||
| Round 5 | eSignature | 2,413 | 2,237 | 92.7 | |
| DocuSign | 5,926 | 4,396 | 74.2 | ||
| Paper | 1,932 | 206 | 10.7 | ||
| Combined | 10,271 | 6,839 | 66.6 | ||
| Panel 28 | Round 1 | eSignature | 1,539 | 1,451 | 94.3 |
| DocuSign | 469 | 241 | 51.4 | ||
| Paper | 609 | 22 | 3.6 | ||
| Combined | 2,617 | 1,714 | 65.5 | ||
| Round 2 | eSignature | 1,3940 | 13,318 | 95.5 | |
| DocuSign | 3,794 | 2,015 | 53.1 | ||
| Paper | 3,442 | 135 | 3.9 | ||
| Combined | 21,176 | 15,468 | 73.0 | ||
| Round 3 | eSignature | 10,886 | 10,195 | 93.7 | |
| DocuSign | 4,271 | 2,491 | 58.3 | ||
| Paper | 3,479 | 117 | 3.4 | ||
| Combined | 18,636 | 12,803 | 68.7 | ||
| Round 4 | eSignature | 6,965 | 6,650 | 95.5 | |
| DocuSign | 5,376 | 3,894 | 72.4 | ||
| Paper | 1,875 | 132 | 7.0 | ||
| Combined | 14,216 | 10,676 | 75.1 | ||
| Round 5 | eSignature | 3,707 | 3,522 | 95.0 | |
| DocuSign | 5,989 | 4,357 | 72.8 | ||
| Paper | 2,274 | 140 | 6.2 | ||
| Combined | 11,970 | 8,019 | 67.0 | ||
| Panel 29 | Round 1 | eSignature | 1,489 | 1,422 | 95.5 |
| DocuSign | 490 | 268 | 54.7 | ||
| Paper | 511 | 29 | 5.7 | ||
| Combined | 2,490 | 1,719 | 69.0 | ||
| Round 2 | eSignature | 13,455 | 12,744 | 94.7 | |
| DocuSign | 5,182 | 2,758 | 53.2 | ||
| Paper | 3,473 | 116 | 3.3 | ||
| Combined | 22,110 | 15,618 | 70.6 | ||
| Round 3 | eSignature | 8,097 | 7,662 | 94.6 | |
| DocuSign | 6,822 | 4,391 | 64.4 | ||
| Paper | 3,172 | 100 | 3.2 | ||
| Combined | 18,091 | 12,153 | 67.2 | ||
| Round 4 | eSignature | 6,220 | 6,010 | 96.6 | |
| DocuSign | 5,594 | 4,228 | 75.6 | ||
| Paper | 1,900 | 95 | 5.0 | ||
| Combined | 13,714 | 10,333 | 75.3 | ||
| Panel 30 | Round 1 | eSignature | 773 | 742 | 96.0 |
| DocuSign | 362 | 206 | 56.9 | ||
| Paper | 358 | 16 | 4.5 | ||
| Combined | 1,493 | 964 | 64.5 | ||
| Round 2 | eSignature | 6,337 | 6,061 | 95.6 | |
| DocuSign | 5,676 | 3,481 | 61.3 | ||
| Paper | 2,465 | 104 | 4.2 | ||
| Combined | 14,478 | 9,646 | 66.6 | ||
Calculation of the round-by-round collection rate for the medical provider authorization forms is based on all forms requested during a round. For later rounds (i.e., rounds after Round 1), this includes forms fielded but not signed in an earlier round (nonresponse) as well as forms that were signed in an earlier round but rendered obsolete because the person had another health event with the provider after the date on which the original form was signed.
Table 4.15 shows signing rates for pharmacy authorization forms for Panels 23–30. Pharmacy authorization forms are requested starting in Round 2, with follow-up for nonresponse in subsequent rounds similar to the follow-up process for medical provider authorization forms. As with the medical provider authorization forms, the signature rate for Panel 30 pharmacy authorization forms in Round 2 decreased over the same round in previous panels. Other rounds remained about the same.
| Panel/Round | Signature method | Authorization forms requested | Authorization forms signed | Signing rate (%) | |
|---|---|---|---|---|---|
| Panel 23 | Round 2 | 8,834 | 6,514 | 73.8 | |
| Round 3 | 9,614 | 6,205 | 64.5 | ||
| Round 4 | 8,486 | 5,900 | 69.5 | ||
| Round 5 | 8,067 | 5,101 | 63.2 | ||
| Round 6 | 5,668 | 3,418 | 60.3 | ||
| Round 7 | 5,417 | 3,345 | 61.8 | ||
| Round 8 | 5,182 | 3,341 | 64.5 | ||
| Round 9 | eSignature | 303 | 269 | 88.8 | |
| DocuSign | 2,587 | 1,983 | 76.7 | ||
| Paper | 1,240 | 563 | 45.4 | ||
| Combined | 4,130 | 2,815 | 68.2 | ||
| Panel 24 | Round 2 | 10,265 | 6,676 | 65.0 | |
| Round 3 | 9,096 | 4,831 | 53.1 | ||
| Round 4 | 7,100 | 3,636 | 51.2 | ||
| Round 5 | 6,528 | 3,682 | 56.4 | ||
| Round 6 | 4,783 | 2,663 | 55.7 | ||
| Round 7 | eSignature | 336 | 310 | 92.3 | |
| DocuSign | 2,763 | 2,073 | 75.0 | ||
| Paper | 1,279 | 547 | 42.8 | ||
| Combined | 4,378 | 2,930 | 66.9 | ||
| Round 8 | eSignature | 480 | 449 | 93.5 | |
| DocuSign | 2,238 | 1,527 | 68.2 | ||
| Paper | 798 | 299 | 37.5 | ||
| Combined | 3,516 | 2,275 | 64.7 | ||
| Round 9 | eSignature | 235 | 222 | 94.5 | |
| DocuSign | 2,217 | 1,511 | 68.2 | ||
| Paper | 887 | 345 | 38.9 | ||
| Combined | 3,339 | 2,078 | 62.2 | ||
| Panel 25 | Round 2 | 6,783 | 3,180 | 46.9 | |
| Round 3 | 6,114 | 3,146 | 51.5 | ||
| Round 4 | 4,640 | 2,888 | 62.2 | ||
| Round 5 | eSignature | 1,667 | 1,572 | 94.3 | |
| DocuSign | 1,416 | 983 | 69.4 | ||
| Paper | 787 | 181 | 23.0 | ||
| Combined | 3,870 | 2,736 | 70.7 | ||
| Panel 26 | Round 2 | 6,961 | 4,105 | 59.0 | |
| Round 3 | eSignature | 2,916 | 2,725 | 93.4 | |
| DocuSign | 1,749 | 1,121 | 64.1 | ||
| Paper | 1,156 | 181 | 15.7 | ||
| Combined | 5,821 | 4,027 | 69.2 | ||
| Round 4 | eSignature | 2,848 | 2,710 | 95.2 | |
| DocuSign | 1,212 | 652 | 53.8 | ||
| Paper | 659 | 60 | 9.1 | ||
| Combined | 4,719 | 3,422 | 72.5 | ||
| Round 5 | eSignature | 446 | 422 | 94.6 | |
| DocuSign | 2,853 | 1,945 | 68.2 | ||
| Paper | 933 | 228 | 24.4 | ||
| Combined | 4,232 | 2,595 | 61.3 | ||
| Panel 27 | Round 2 | eSignature | 4,412 | 4,178 | 94.7 |
| DocuSign | 1,972 | 842 | 42.7 | ||
| Paper | 1,272 | 73 | 5.7 | ||
| Combined | 7,656 | 5,093 | 66.5 | ||
| Round 3 | eSignature | 3,420 | 3,215 | 94.0 | |
| DocuSign | 1,973 | 1,028 | 52.1 | ||
| Paper | 1,151 | 66 | 5.7 | ||
| Combined | 6,544 | 4,309 | 65.8 | ||
| Round 4 | eSignature | 3,115 | 3,008 | 96.6 | |
| DocuSign | 1,638 | 1,078 | 65.8 | ||
| Paper | 821 | 68 | 8.3 | ||
| Combined | 5,574 | 4,154 | 74.5 | ||
| Round 5 | eSignature | 1,202 | 1,136 | 94.5 | |
| DocuSign | 2,935 | 2,144 | 73.0 | ||
| Paper | 850 | 95 | 11.2 | ||
| Combined | 4,987 | 3,375 | 67.7 | ||
| Panel 28 | Round 2 | eSignature | 5,716 | 5,445 | 95.3 |
| DocuSign | 1,669 | 853 | 51.1 | ||
| Paper | 1,370 | 34 | 2.5 | ||
| Combined | 8,755 | 6,332 | 72.3 | ||
| Round 3 | eSignature | 4,329 | 4,088 | 94.4 | |
| DocuSign | 1,761 | 1,033 | 58.7 | ||
| Paper | 1,226 | 36 | 2.9 | ||
| Combined | 7,316 | 5,157 | 70.5 | ||
| Round 4 | eSignature | 2,944 | 2,816 | 95.7 | |
| DocuSign | 2,425 | 1,737 | 71.6 | ||
| Paper | 809 | 45 | 5.6 | ||
| Combined | 6,178 | 4,598 | 74.4 | ||
| Round 5 | eSignature | 1,756 | 1,678 | 95.6 | |
| DocuSign | 2,820 | 2,054 | 72.8 | ||
| Paper | 885 | 64 | 7.2 | ||
| Combined | 6,178 | 4,598 | 74.4 | ||
| Panel 29 | Round 2 | eSignature | 5,335 | 5,092 | 95.4 |
| DocuSign | 2,122 | 1,088 | 51.3 | ||
| Paper | 1,309 | 48 | 3.7 | ||
| Combined | 8,766 | 6,228 | 71.0 | ||
| Round 3 | eSignature | 3,152 | 3,017 | 95.7 | |
| DocuSign | 2,803 | 1,819 | 64.9 | ||
| Paper | 1,096 | 48 | 4.4 | ||
| Combined | 7,051 | 4,884 | 69.3 | ||
| Round 4 | eSignature | 2,639 | 2,539 | 96.2 | |
| DocuSign | 2,490 | 1,826 | 73.3 | ||
| Paper | 820 | 45 | 5.5 | ||
| Combined | 5,949 | 4,410 | 74.1 | ||
| Panel 30 | Round 2 | eSignature | 2,542 | 2,439 | 95.9 |
| DocuSign | 2,400 | 1,422 | 59.3 | ||
| Paper | 970 | 32 | 3.3 | ||
| Combined | 5,912 | 3,893 | 65.8 | ||
4.4 Data Collection Results: Self-Administered Questionnaire and Diabetes Care Supplement Collection Rates
SAQs are requested from key adult household members in Rounds 2 and 4. We continued to offer multimode (web and paper) collection for SAQs, providing respondents with the opportunity to complete their SAQ via either mode regardless of their assigned contact mode. In 2024, the follow-up in Rounds 3 and 5 was paper only; however, for the initial request in Rounds 2 and 4, we continued to offer multimode (web and paper) collection for SAQs. Invitations to complete the Adult SAQ on the web were included with the advance mailing, giving household members the opportunity to complete SAQs before their household interview. During the CAPI interview, interviewers followed up with eligible household members who had not yet completed the web Adult SAQ. Paper Adult SAQs were offered during the interview if the household member did not provide an email address, cellphone number, or both to which a link to the web SAQ could be sent. Everyone who did not complete their Adult SAQ within a certain time frame after completing the household interview was sent a nonresponse mailing that included a paper SAQ. Adult SAQs that were not collected in Rounds 2 and 4 were requested again in Rounds 3 and 5. In 2025, we introduced multimode (web and paper) follow-up in Rounds 3 and 5. Previously, the Rounds 3 and 5 follow-up was paper only.
Table 4.16 shows the SAQ response rates, including both the round-specific rates and the combined rates after the follow-up round was completed. This is shown by survey contact mode for the SAQs requested starting in 2023. There were some mixed results for SAQ collection in 2025. The response rate increased for the initial request in Round 4, from 55.1 percent in 2024 to 61.0 percent in 2025. However, for Round 2, the rate decreased from 52.1 percent to 49.8 percent, following the same downward trend for Panel 30 as seen in the signature rate for authorization forms.
Incorporating web collection during the follow-up in Rounds 3 and 5 appeared to be more successful than the paper-only follow-up approach used in 2024, increasing the overall response rate for the combined 2024 collection.
| Panel/Round | Survey mode | SAQs requested | SAQs completed | SAQs refused | Other nonresponse | Response rate (%) | |
|---|---|---|---|---|---|---|---|
| Panel 23 | Round 2 | 12,349 | 8,711 | 1,364 | 1,289 | 70.5 | |
| Round 3 | 2,364 | 819 | 907 | 638 | 34.6 | ||
| Combined, 2018 | 12,349 | 9,530 | - | - | 77.2 | ||
| Round 4 | 11,290 | 8,554 | 1,515 | 1,221 | 75.8 | ||
| Round 5 | 2,711 | 983 | 923 | 805 | 36.3 | ||
| Combined, 2019 | 11,290 | 9,537 | - | - | 84.5 | ||
| Round 6 | 8,537 | 4,732 | 682 | 3,123 | 55.4 | ||
| Round 7 | 3,229 | 1,123 | 707 | 1,399 | 34.8 | ||
| Combined, 2020 | 8,537 | 5,855 | - | - | 68.6 | ||
| Round 8 | 6,446 | 3,377 | 799 | 2,270 | 52.4 | ||
| Round 9 | 2,654 | 724 | 633 | 1,297 | 27.3 | ||
| Combined, 2021 | 6,446 | 4,101 | - | - | 63.6 | ||
| Panel 24 | Round 2 | 12,027 | 8,726 | 1,641 | 1,660 | 72.6 | |
| Round 3 | 2,810 | 860 | 832 | 1,118 | 30.6 | ||
| Combined, 2019 | 12,027 | 9,586 | - | - | 79.7 | ||
| Round 4 | 9,257 | 4,247 | 786 | 4,224 | 45.9 | ||
| Round 5 | 4,224 | 1,476 | 838 | 1,910 | 34.9 | ||
| Combined, 2020 | 9,257 | 5,723 | - | - | 61.8 | ||
| Round 6 | 6,440 | 3,196 | 819 | 2,425 | 49.6 | ||
| Round 7 | 2,695 | 696 | 628 | 1,371 | 25.8 | ||
| Combined, 2021 | 6,440 | 3,892 | - | - | 60.4 | ||
| Round 8 | 4,906 | 2,347 | 634 | 1,925 | 47.8 | ||
| Round 9 | 2,415 | 413 | 632 | 1,730 | 17.1 | ||
| Combined, 2022 | 4,906 | 2,760 | - | - | 56.2 | ||
| Panel 25 | Round 2 | 8,109 | 3,555 | 529 | 4,025 | 43.8 | |
| Round 3 | 4,016 | 1,322 | 717 | 1,977 | 32.9 | ||
| Combined, 2020 | 8,109 | 4,877 | - | - | 60.1 | ||
| Round 4 | 6,089 | 3,309 | 850 | 1,930 | 54.3 | ||
| Round 5 | 2,325 | 655 | 583 | 1,087 | 28.2 | ||
| Combined, 2021 | 6,089 | 3,964 | - | - | 65.1 | ||
| Panel 26 | Round 2 | 8,419 | 4,609 | 1,009 | 2,801 | 54.7 | |
| Round 3 | 2,950 | 853 | 732 | 1,365 | 28.9 | ||
| Combined, 2021 | 8,419 | 5,462 | - | - | 64.9 | ||
| Round 4 | 6,370 | 3,399 | 898 | 2,073 | 53.4 | ||
| Round 5 | 2,665 | 551 | 720 | 1,394 | 20.7 | ||
| Combined, 2022 | 6,370 | 3,950 | - | - | 62.0 | ||
| Panel 27 | Round 2 | 9,690 | 4,669 | 1,529 | 3,492 | 48.2 | |
| Round 3 | 4,258 | 865 | 1,190 | 2,203 | 20.3 | ||
| Combined, 2022 | 9,690 | 5,534 | - | - | 57.1 | ||
| Round 4 | Web | 5,497 | 2,898 | 21 | 2,578 | 52.7 | |
| Paper | 2,400 | 671 | 1,104 | 625 | 28.0 | ||
| Combined | 7,897 | 3,569 | 1,125 | 3,203 | 45.2 | ||
| Round 5 | Paper | 4,073 | 1,059 | 1,258 | 1,759 | 26.0 | |
| Combined, 2023 | 7,897 | 4,628 | - | - | 58.6 | ||
| Panel 28 | Round 2 | Web | 7,108 | 3,597 | 22 | 3,489 | 50.6 |
| Paper | 3,237 | 890 | 1,530 | 817 | 27.5 | ||
| Combined | 10,345 | 4,487 | 1,552 | 4,306 | 43.4 | ||
| Round 3 | Paper | 4,974 | 1,566 | 1,599 | 1,809 | 31.5 | |
| Combined, 2023 | 10,345 | 6,053 | - | - | 58.5 | ||
| Round 4 | Web | 5,978 | 3,774 | 6 | 2,198 | 63.1 | |
| Paper | 2,409 | 847 | 1,189 | 373 | 35.2 | ||
| Combined | 8,387 | 4,621 | 1,195 | 2,571 | 55.1 | ||
| Round 5 | Web | 2,420 | 1,330 | 1 | 1,089 | 55.0 | |
| Paper | 1,039 | 133 | 556 | 350 | 12.8 | ||
| Combined | 3,459 | 1,463 | 557 | 1,439 | 42.3 | ||
| Combined, 2024 | 3,387 | 6,084 | - | - | 72.5 | ||
| Panel 29 | Round 2 | Web | 7,116 | 4,252 | 1 | 2,863 | 59.8 |
| Paper | 2,992 | 1,016 | 1,397 | 579 | 34.0 | ||
| Combined | 10,108 | 5,268 | 1,398 | 3,442 | 52.1 | ||
| Round 3 | Web | 2,697 | 1,302 | 7 | 1,388 | 48.3 | |
| Paper | 1,035 | 139 | 495 | 401 | 13.4 | ||
| Combined | 3,732 | 1,441 | 502 | 1,789 | 38.6 | ||
| Combined, 2024 | 10,108 | 6,708 | - | - | 66.4 | ||
| Round 4 | Web | 6,048 | 4,108 | 7 | 1,933 | 67.9 | |
| Paper | 1,627 | 573 | 821 | 233 | 35.2 | ||
| Combined | 7,675 | 4,681 | 828 | 2,166 | 61.0 | ||
| Panel 30 | Round 2 | Web | 5,517 | 3,097 | 8 | 2,412 | 56.1 |
| Paper | 1,717 | 505 | 869 | 343 | 29.4 | ||
| Combined | 7,234 | 3,602 | 877 | 2,755 | 49.8 | ||
In Rounds 3 and 5, key adult household members diagnosed with diabetes were asked to complete a short paper questionnaire called the DCS. If forms were not completed before the interviewer’s visit, the interviewer followed up by telephone in the latter stages of Rounds 3 and 5. However, unlike the SAQ, there was no follow-up in the subsequent round if the DCS was not collected in the round when first requested. Response rates for the DCS for Panels 22–29 are shown in Table 4.17. There was no significant change in DCS response rate from 2024 to 2025.
| Panel/Round | DCSs requested | DCSs completed | Response rate (%) | |
|---|---|---|---|---|
| Panel 22 | Round 3 | 1,453 | 1,177 | 81.0 |
| Round 5 | 1,348 | 1,018 | 75.5 | |
| Panel 23 | Round 3 | 1,464 | 1,101 | 75.2 |
| Round 5 | 1,350 | 933 | 69.1 | |
| Round 7 | 1,018 | 648 | 63.7 | |
| Round 9 | 813 | 446 | 54.9 | |
| Panel 24 | Round 3 | 1,350 | 843 | 62.4 |
| Round 5 | 1,082 | 599 | 55.4 | |
| Round 7 | 817 | 443 | 54.2 | |
| Round 9 | 687 | 324 | 47.2 | |
| Panel 25 | Round 3 | 963 | 514 | 53.4 |
| Round 5 | 758 | 419 | 55.3 | |
| Panel 26 | Round 3 | 894 | 516 | 57.7 |
| Round 5 | 746 | 360 | 48.3 | |
| Panel 27 | Round 3 | 1,146 | 523 | 45.6 |
| Round 5 | 982 | 475 | 48.4 | |
| Panel 28 | Round 3 | 1,220 | 629 | 51.6 |
| Round 5 | 1,070 | 523 | 48.9 | |
| Panel 29 | Round 3 | 1,225 | 608 | 49.6 |
4.5 Quality Control
Interviewer performance was monitored through validation case review using GPS, CARI, and telephone and mail validation. The two main purposes of validation are to verify that (1) the correct individual was contacted for the interview, and (2) the interview was conducted according to MEPS-approved procedures.
Generally, all completed cases were validated by first examining the GPS data stored and encrypted on the laptop and through the MFOS app on the project-issued iPhone. If the case could not be sufficiently validated via these methods, it was then reviewed in the CARI system. This most frequently occurred when there were missing data, or the GPS information did not match the respondent address or another documented location at the time of the interview. If a case could not be validated by CARI because of poor quality or missing CARI data, the case was referred for telephone validation. All interviews completed in less than 30 minutes were also referred for telephone validation. Finally, for cases assigned to telephone validation, if the household could not be reached, a paper validation questionnaire was mailed with a return envelope.
In both the spring and fall rounds of 2025, over 95 percent of completed cases were validated. In both rounds, a majority of cases were validated using GPS data: about 53 percent in the spring and 52 percent in the fall. CARI was used to validate 43 percent of spring and 40 percent of fall cases, particularly interviews completed via CAVI or telephone. A small percentage (4% in the spring and 8% in the fall) were validated by telephone, and less than 0.5 percent of cases were validated by mail.
In addition to validation, a percentage of all interviews are reviewed in CARI by QC staff to ensure that protocols are closely followed. During the review process, each case is assigned an overall score on a 5-point scale from Excellent to Poor. When a case receives an overall score of Fair or Poor, the interviewer receives a rapid feedback session that provides retraining on general interviewing techniques and MEPS-specific procedures. A key part of this process involves the interviewer logging in to the CARI system and listening to their own recordings, allowing them to reflect on their behaviors and respondent interactions. After retraining, the interviewer’s next case is automatically reviewed, and a higher percentage of that interviewer’s subsequent cases are also manually reviewed. Interviewers who do not improve are placed on formal action plans and ultimately released if they do not show marked improvement. Interviewers who receive an overall score of Excellent, Very Good, or Good receive feedback via an email with any applicable notes.
In 2025, Westat implemented a major upgrade to the CARI system to enhance functionality and modernize the underlying architecture. The redesigned system supports more granular, question-by-question review, allowing QC staff to assess interviewer performance more precisely. These improvements enable the generation of comprehensive case- and interviewer-level reports that summarize adherence to protocol, identify patterns requiring coaching, and provide a more robust evidentiary basis for retraining and supervisor feedback. The upgraded architecture also improves system stability, data security, and integration with other MEPS monitoring tools, creating a more streamlined quality assurance workflow across the project.
In addition to validating cases, MEPS field supervisors and managers conduct observations as part of a comprehensive mentoring process. MEPS typically uses technical solutions instead of in-person observations; however, some needs require specialized observation. Feedback is provided after each observation, including ways to improve specific interviewing skills. Observations can have a high impact on interviewers who are struggling with administering the interview, staying organized, or applying at-the-door skills.
Each week, field managers and supervisors are provided with an interviewer-level QC report. Report metrics include various aspects of interview quality, such as interview timing (too short or too long), missing GPS data, cases without audio, CARI consent rates, average case-level scores for CARI cases reviewed by coding staff, average case-level scores predicted by machine learning processes for all cases with CARI recordings, and other items. Outliers and anomalies are highlighted, and interviewers receive feedback. This report helps field management quickly identify issues or areas for concern requiring further investigation.
4.6 Security Incidents
To comply with the requirement to report incidents involving the loss or theft of hard-copy materials with a respondent’s PII or laptops, field staff continued to use an automated Initial Loss Reporting System (ILRS) to report confirmed incidents. Incidents were entered in the MEPS Help Desk Incident Tracking System, investigated, and closed upon resolution. Results were recorded in an annual MEPS PII log. A security incident report was submitted to the Westat Institutional Review Board (IRB) for each confirmed incident.
In 2025, five security incidents were reported. The help desk performed an immediate GPS search for last known location, and four of the devices were located by the interviewer. One interviewer iPhone was never recovered. Over the course of the year, other iPhones were reported to the MEPS Help Desk as lost but were then found by the interviewer using tools to track last known location.
MEPS iPhones are password-protected, and all MEPS content can be deleted through remote management when the phone is turned on. Interviewers were counseled about keeping MEPS equipment secure at all times.
The password-protected laptops were shut down at the time of the loss. Because MEPS laptops are full-disk encrypted, respondent identity was not at risk.
4.7 Data Collection Results: Patient Profile Collection
The pharmacy component of the MPC collects information about MEPS participants’ prescription medicine usage as captured on the summary patient profile form generated by pharmacies. The patient profile lists the prescriptions filled or refilled for the patient during the year. Per previously established procedure, the project sends a mailed request to household respondents who have reported using certain pharmacies, asking them to contact those pharmacies to request a copy of their patient profile. The procedure serves as a backup effort to obtain information from pharmacies that do not participate when contacted by representatives from the MPC. In 2025, the collection of profiles by the MEPS household component operation was limited to respondents in Panel 29, Round 5 households. These respondents had completed their full cycle household interviews, and no follow-up efforts were made for those who did not respond to the mailed request.
For the 2025 effort, summarized in Table 4.18, patient profile requests were sent to patient–pharmacy pairs in reporting units. Despite the overall low rate of return over time, the effort does allow the study to include some prescription profile data for patients associated with pharmacies whose data would otherwise be totally unrepresented in the MEPS pharmacy estimates.
| Pharmacy | Total number | Total received | Percentage received | Total complete | Completes as a percentage of total |
|---|---|---|---|---|---|
| 2025—P28R5 all mail collection | |||||
| Total RUs | 143 | 19 | 13.29 | 14 | 9.79 |
| Total pairs | 214 | 28 | 13.08 | 24 | 11.21 |
| 2024—P27R5 all mail collection | |||||
| Total RUs | 229 | 29 | 12.66 | 24 | 10.48 |
| Total pairs | 335 | 33 | 9.85 | 33 | 9.85 |
| 2023—P26R5 all mail collection | |||||
| Total RUs | 473 | 68 | 14.38 | 48 | 10.15 |
| Total pairs | 682 | 86 | 12.61 | 72 | 10.56 |
| 2022—P25R5 all mail collection | |||||
| Total RUs | 511 | 76 | 14.87 | 58 | 11.35 |
| Total pairs | 720 | 93 | 12.92 | 80 | 11.11 |
5. Home Office Support of Field Activities
The home office supports the data collection effort in several important ways, which can be described in two phases. One phase of activity supports the launch of each new round of data collection; another phase supports the field operation while data collection is in progress. These two phases of activity are described in this chapter.
5.1 Preparation for Field Activities
Prior to the start of data collection for each period, interviewers connected remotely to the home office to download the CAPI software update for the upcoming rounds and received a home study training package to prepare them for interviewing. Field interviewers also received replenished supplies at the start of the rounds.
Home office staff prepared and mailed advance mailings to all respondent households before the start of data collection. Addresses were first standardized and sent through the National Change of Address (NCOA) database to obtain the most current addresses for mailing. SAQs requested in fall 2024 that were not completed were included in the advance mailing for Round 3 and Round 5 cases in the spring 2025 advance mailing. Any mail returned as undeliverable was recorded, and the appropriate supervisor was notified. Home office staff also prepared and re-mailed the Round 1 advance package to households who reported not receiving it.
For each wave of cases, supervisors received a Supervisor Assignment Log listing all cases to be released in their region and assigned to their interviewers. Supervisors entered the ID of the interviewer assigned to each case and sent the log back to the home office. The logs with assignments were then used to make the electronic assignments in the AFOS. Cases became available to be picked up after the assigned field interviewer completed transmission on the first day of data collection for the round.
5.2 Support During Data Collection
Respondent Contacts. Respondent contacts are an important component of home office support for the MEPS data collection effort. Printed materials mailed to respondents contain an email address and toll-free phone number that respondents can use to contact the project representative with questions, request or cancel interview appointments, or decline study participation. Home office staff forwarded information received from respondent calls to the field supervisors, who initiated the appropriate follow-up and informed the home office of the results within 24 hours of notification. Table 5.1 shows the number and percentage of RUs that made calls to the respondent hotline in the spring and fall rounds of 2021–2025. The percentage of households that called the hotline continued to decline in 2025.
| Round/panel | Original sample size | Number of calls | Calls as a percentage of sample size |
|---|---|---|---|
| Round 1 | |||
| 2021—Panel 26, Round 1 | 9,509 | 335 | 3.5 |
| 2022—Panel 27, Round 1 | 9,700 | 426 | 4.4 |
| 2023—Panel 28, Round 1 | 9,800 | 347 | 3.5 |
| 2024—Panel 29, Round 1 | 10,424 | 294 | 2.8 |
| 2025—Panel 30, Round 1 | 7,879 | 203 | 2.6 |
| Rounds 3 and 5 | |||
| 2021—Panel 23, Round 7/Panel 24, Round 5/Panel 25, Round 3 | 15,616 | 555 | 3.6 |
| 2022—Panel 23, Round 9/Panel 24, Round 7/Panel 25, Round 5/Panel 26, Round 3 | 16,399 | 818 | 5.0 |
| 2023—Panel 24, Round 9/Panel 26, Round 5/Panel 27, Round 3 | 12,267 | 569 | 4.6 |
| 2024—Panel 27, Round 5/Panel 28, Round 3 | 10,255 | 386 | 3.8 |
| 2025—Panel 28, Round 5/Panel 29, Round 3 | 10,479 | 262 | 2.5 |
| Rounds 2 and 4 | |||
| 2021—Panel 23, Round 8/Panel 24, Round 6/Panel 25, Round 4/Panel 26, Round 2 | 19,339 | 848 | 4.4 |
| 2022—Panel 24, Round 8/Panel 26, Round 4/Panel 27, Round 2 | 13,735 | 584 | 4.3 |
| 2023—Panel 27, Round 4/Panel 28, Round 2 | 11,323 | 211 | 1.9 |
| 2024—Panel 28, Round 4/Panel 29, Round 2 | 11,656 | 327 | 2.8 |
| 2025—Panel 29, Round 4/Panel 30, Round 2 | 9,634 | 211 | 2.2 |
Table 5.2 shows the number and types of calls received on the respondent hotline during 2024 and 2025. As in prior years, a substantial portion of the Round 1 calls were for refusals. We continue to see a decline in calls for appointments and an overall decline in the number of calls.
| Reason for call | Spring 2024 (Panel 29, Round 1/Panel 28, Round 3/Panel 27, Round 5) | Fall 2024 (Panel 29, Round 2/ Panel 28, Round 4) | ||||
|---|---|---|---|---|---|---|
| Round 1 | Rounds 3 and 5 | Rounds 2 and 4 | ||||
| N | Percentage | N | Percentage | N | Percentage | |
| Address/telephone change | 1 | 0.3 | 12 | 3.1 | 15 | 4.6 |
| Authorization form help | 0 | 0.0 | 0 | 0.0 | 1 | 0.3 |
| Appointment | 57 | 19.4 | 108 | 28.0 | 39 | 11.9 |
| Request callback | 83 | 28.2 | 127 | 32.9 | 115 | 35.2 |
| No message | 11 | 3.7 | 9 | 2.3 | 5 | 1.5 |
| Other | 14 | 4.8 | 96 | 24.9 | 88 | 26.9 |
| Proxy needed | 2 | 0.7 | 1 | 0.3 | 0 | 0.0 |
| Request SAQ help | 0 | 0.0 | 0 | 0.0 | 0 | 0.0 |
| SAQ refusal | 0 | 0.0 | 0 | 0.0 | 0 | 0.0 |
| Special needs | 0 | 0.0 | 0 | 0.0 | 0 | 0.0 |
| Refusal | 93 | 31.6 | 33 | 8.5 | 64 | 19.6 |
| Willing to participate | 33 | 11.2 | 0 | 0.0 | 0 | 0.0 |
| Total | 294 | 386 | 327 | |||
| Reason for call | Spring 2025 (Panel 30, Round 1/Panel 29, Round 3/Panel 28, Round 5) | Fall 2025 (Panel 30, Round 2/ Panel 29, Round 4) | ||||
|---|---|---|---|---|---|---|
| Round 1 | Rounds 3 and 5 | Rounds 2 and 4 | ||||
| N | Percentage | N | Percentage | N | Percentage | |
| Adress/telephone change | 1 | 0.5 | 6 | 2.3 | 3 | 1.4 |
| Authorization form help | 7 | 3.4 | 69 | 26.3 | 44 | 20.9 |
| Appointment | 32 | 15.8 | 29 | 11.1 | 20 | 9.5 |
| Request callback | 46 | 22.7 | 67 | 25.6 | 45 | 21.3 |
| No message | 3 | 1.5 | 6 | 25.6 | 45 | 21.3 |
| Other | 23 | 11.3 | 47 | 17.9 | 63 | 29.9 |
| Proxy needed | 2 | 1.0 | 1 | 0.4 | 0 | 0.0 |
| Request SAQ help | 0 | 0.0 | 3 | 1.1 | 0 | 0.0 |
| SAQ refusal | 0 | 0.0 | 0 | 0.0 | 0 | 0.0 |
| Special needs | 0 | 0.0 | 0 | 0.0 | 0 | 0.0 |
| Refusal | 65 | 32.0 | 26 | 9.9 | 32 | 15.2 |
| Willing to participate | 24 | 11.8 | 8 | 3.1 | 3 | 1.4 |
| Total | 203 | 262 | 211 | |||
Monitoring Production. Home office staff monitored production, cost, and data quality and provided reports and feedback to field managers and supervisors for review and follow-up. Reports were generated weekly and distributed to AHRQ, showing weekly and cumulative field production data, response rates, and costs. AFOS and dashboard use increased our capabilities to monitor production and cost more effectively.
Home Office Support. Home office staff generated and mailed refusal letters, as requested by the field. Home office staff also responded to supply requests from the field, replenishing interviewer and supervisor stocks of materials, including project pamphlets and incentive debit cards, as needed.
Receipt Control. As interviewers completed cases, they transmitted the data electronically and shipped any hard-copy documents collected from respondents to the home office for TeleForm processing. Interviewers shipped all hard-copy material containing PII via FedEx, which tracks late or lost shipments. When preparing a shipment to the home office, interviewers used the Ship to Receipt module in AFOS to indicate exactly what materials were included in the package and record the FedEx tracking number. For interviews with hard-copy documents not collected by the interviewer, the interviewer provided the respondent with a BRE to send their documents directly to the home office. Authorization forms signed electronically, either on the laptop or in DocuSign, were uploaded to a secure server to be accessed for receipt. Paper authorization forms were scanned and uploaded to the secure server, then receipt staff reviewed them for accuracy. When a problem was found in an authorization form, it was documented, and feedback was sent to the field supervisor to review with the interviewer. All hard-copy SAQs, including the Adult SAQs/preventive care self-administered questionnaires (PSAQs) and DCSs, were processed in TeleForm and assigned a receipt status based on completion. Statuses for SAQs completed on the web were processed through the MEPS receipt control system.
Help Desk Support. The MEPS Help Desk continued to provide technical support for field interviewing activities during 2025. Help desk staff were available 7 days a week to help field staff resolve CAPI, field management system, transmission, laptop, and iPhone problems. Incoming calls were documented for follow-up, as needed, to resolve individual issues and identify issues reported by multiple interviewers. The MEPS Help Desk coordinated the tracking and shipment of all field laptops, field laptop assignments, and laptop and phone repair.
6. Data Processing and Data Delivery
This chapter briefly describes the activities that supported Westat’s data delivery work during the year and identifies the principal files related to data year 2023, which were delivered in 2025.
6.1 Processing to Support Data Delivery
6.1.1 Schedules for Data Delivery
Adhering to the delivery schedule for key MEPS public-use files (PUFs) is of paramount importance to the project. Throughout calendar year 2025, data processing activities to support the major file deliveries for the year proceeded simultaneously with processing activities focused separately on each of the panels for the annual FY files. As in past years, the project used a set of comprehensive data delivery schedules to guide management of the effort. The schedules integrate key dates for the data collection, data capture, coding, editing and imputation, weights construction, and documentation production tasks. These schedules provide a framework for assessing the potential impact of proposed changes at the start of each processing cycle and for coordinating the succession of processes that comprise the delivery effort.
6.1.2 Data Quality Control System
The DQC system consists of both a consolidated database that preserves data as returned from the field and a DQC-specific database that shows the current values of data following any required updates. DQC technicians access the data through a secure portal.
Technicians review and edit the data using the Blaise database model used in the field for data collection. All DQC work occurs at a “case” level. The DQC system automatically creates a unique “issue” for each instance of text entered as a comment and includes the comment category selected by the field interviewer associated with the text entry. As cases are loaded into DQC, each comment and category is checked by an NLP algorithm that identifies the most likely category. During processing, data technicians can accept or update this category. Technicians then follow standardized procedures for data review and editing based on the comment category.
The DQC system also runs a series of programmatic checks and assigns a new “issue” for each instance that triggers a consistency or edit check. These checks are designed to ensure that data changed during editing conform fully to the rules of the CAPI instrument before the data are released. On rare occasions, DQC staff use MEPS Help Desk reports to manually add issues to individual cases, such as when a name or email address is discovered to be misspelled after completion of the interview; these issues are included among the number of cases with at least one interviewer comment. During spring 2025, 12.6 percent of cases received from the field included a comment (Table 6.1). Cases with any issues, a field comment, or a consistency check totaled 32.3 percent in spring 2025. For fall 2025, 16.3 percent of cases received from the field included a comment, while cases with any issues totaled 31.3 percent.
| Field period | Cases processed | Cases with at least one comment |
% of cases with comments | Cases with at least one issue | % of cases with issues | Total number of comments | Not actionable comments | % not actionable comments |
|---|---|---|---|---|---|---|---|---|
| Spring 2025 | 14,266 | 1,802 | 12.6 | 4,602 | 32.3 | 2,619 | 1,398 | 53.4 |
| Fall 2025 | 8,497 | 1,385 | 16.3 | 2,662 | 31.3 | 2,155 | 1,032 | 47.9 |
| 2025 Total | 22,763 | 3,187 | 14.0 | 7,264 | 31.9 | 4,774 | 2,430 | 50.9 |
Field interviewers must select 1 of 10 categories for each comment text string. After they select a category, CAPI provides category-specific guidance on information to include in the comment (e.g., RU member name, event date). Field interviewers receive training to help identify the most meaningful category and avoid overuse of the category “Other.” Table 6.2 shows the number of comments that interviewers made in each category; categories were assigned by the natural language processing (NLP) algorithm and confirmed by the data technicians.
| Category | Number | Percentage |
|---|---|---|
| 1. Reporting Unit (RU)/RU Member | 275 | 5.8 |
| 2. RU Member Refusal | 104 | 2.2 |
| 3. Condition | 91 | 1.9 |
| 4. Healthcare Events | 2,569 | 53.8 |
| 5. Glasses/Contact Lenses | 34 | 0.7 |
| 6. Other Medical Expenses | 56 | 1.2 |
| 7. Prescribed Medicines | 466 | 9.8 |
| 8. Employment | 294 | 6.2 |
| 9. Health Insurance | 526 | 11.0 |
| 10. Other | 359 | 7.5 |
| Total | 4,774 |
6.1.3 Transformation
Transformation is the process of extracting data from the Blaise data models optimized for data collection and writing them to the data exchange format (DEX) required by the data delivery teams. Transformation has two logical activities: (1) transforming the structure of the data from data collection to DEX, followed by (2) transforming the format of the data from Blaise to Oracle. The resulting data, now stored in Oracle using the DEX structure, serve as input to the analytical editing, variable construction, PUFs, and other file deliveries.
As shown in Figure 6.1, data transformation has four distinct layers. The metadata layer contains all the variable definitions—including names, tables, and segments or blocks—and transformation logic, sometimes known as “plain-language transformation specifications.” The analytical group leads at Westat are typically responsible for the metadata and the transformation logic.
Figure 6.1. Blaise to Dex transformation
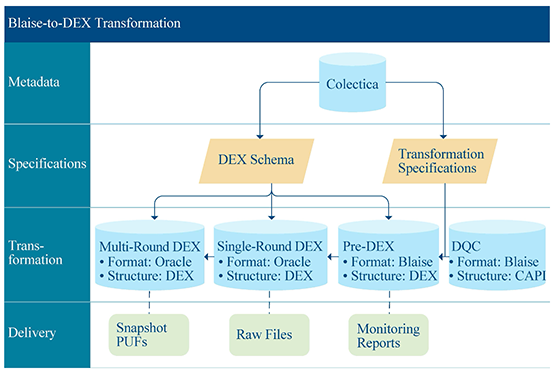
Note: DEX = data exchange format; DQC = data quality control; CAPI = computer-assisted personal interviewing;
PUFs = public-use files.
Based on the metadata, two specifications are developed. The first describes the DEX structure using a formal schema, which is expressed as a set of SQL statements to create the empty Oracle DEX database. The second specification is the detailed transformation specification. Each variable is assigned to a set of similar variables called a “transformation class.” A unique transformation class is defined by the information needed to specify the transformation. For instance, some variables simply need to be copied to an appropriate location in the DEX. These are known as passthrough variables and belong to the “passthrough” class. “Code All That Apply” variables are transformed based on the value(s) selected by the interviewer, so the specification requires an additional DEX variable for each possible value. “Code All That Apply” is another transformation class.
The third layer is the transformation (or programming) layer (Figure 6.1). Using the specifications just described, the data are read from the Blaise database in the data collection structure, the transformation logic is applied, and a data file for each DEX table is written. Next, the format is transformed from the Blaise format to Oracle, writing to the single-round database (SRD). The single-round structure is necessary because the data collection instrument does not contain all data for all rounds for a given case; rather, only the data required to field the case in that specific round are included. The SRD data are then merged into the existing data, yielding a cumulative multi-round database (MRD).
The final layer relates the different databases to select key deliverables. This layer is intentionally general. For example, while the MRD is the source for the PUF deliveries, there are many additional steps to edit the data, construct variables, and deliver a data file and codebook.
6.1.4 TeleForm/Data Editing of Scanned Forms
TeleForm, a commercial off-the-shelf software system for intelligent data capture and image processing, was used in 2025 to capture data collected in the DCS and the Adult SAQ, as well as in an SAQ focused on cancer (CSAQ) and economic data (ESAQ). Note that AHRQ decided to cease DCS collection, so the hard-copy data did not enter downstream processing. TeleForm software reads the form image files and extracts data according to the project specifications. Supporting software checks the data for conformity with project specifications and flags data values that violate validation rules for review and resolution.
With the incorporation of web SAQ data collection, it is necessary to harmonize both the metadata and the data across the different data collection modes. Harmonization begins with questionnaire development to standardize metadata assignment and skip patterns. Incorporating harmonization before fielding decreases the level of effort to fully harmonize post-data collection.
Hard-copy data collection allows the respondent more flexibility in answering questions. For example, providing more than one response to a code-one question and not complying with the questionnaire flow. It is necessary to apply missing value recoding (MVR) across the modes of data collection and enforce skip patterns in the data so the data patterns are identical across modes. Once finished, the harmonized data enter the remaining data processing stream as a single data entity.
6.1.5 Coding
Coding refers to the process of converting data items collected in text format to prespecified numeric codes. For MEPS-HC, five types of information require coding:
- Medical conditions
- Prescribed medicines
- Source of payment (SOP) for medical events and prescriptions
- Industry and occupation
- Geographic identifiers
6.1.5.1 Medical Conditions and Prescribed Medicine Coding
In 2025, coding was performed on the medical conditions and prescribed medicine text strings reported by household respondents for calendar year 2024. An automated system enabled coders to easily search for and assign the appropriate International Classification of Diseases, Tenth Revision, Clinical Modification (ICD-10-CM) code (for conditions) or Generic Product Identifier (GPI) code (for medicines). The system supports the verifier’s review of all codes and, as needed, correction of the coder’s initial decision. For the prescribed medicine coding, a pharmacy reviewer provided a further review of text strings questioned by the verifier, uncodeable text strings, foreign medicines, and compound drugs. All coding actions were tracked in the systems, and error rates were calculated weekly. Both the condition and prescribed medicine coding efforts were conducted by three coders.
Medical conditions text strings for data year 2024 were coded to include the greatest specificity indicated by the text string. The fully specified ICD-10 code was needed to accurately match to the Clinical Classification Software Refined (CCSR) diagnosis codes. A total of 2,925 unique strings were manually coded, and the authority table was constructed with AHRQ-approved code assignments. The overall error rate for coders was 2.0 percent, which did not exceed the contractual error rate goal of 2.0 percent.
Prescription medicine text strings for data year 2024 were coded to the set of GPI codes, associated with the Master Drug Data Base (MDDB) maintained by Medi-Span, a part of Wolters Kluwer. The codes characterize medicines by therapeutic class, form, and dosage. To augment the assignment of codes to less specified and ambiguous text strings, AHRQ developed procedures for assigning partial GPI codes and higher level drug categories that were implemented in 2017 and continued through subsequent coding cycles.
AHRQ also developed a set of exact and inexact matching programs to reduce the number of prescribed medicine strings sent for manual coding. Westat’s implementation of these matching programs reduces the number of prescribed medicine text strings sent for manual coding by approximately 50 percent each year. The matching programs are reviewed and approved each year. A total of 2,141 strings were manually coded from the 2024 data year.
In a process similar to condition text strings, the prescription medicine text strings undergo two rounds of deduplication to identify the unique strings to be coded. AHRQ’s exact and inexact matching programs are then run to further reduce the number of strings to be coded. In spring 2022, the prescribed medicine pick list and search tool was integrated into the CAPI instrument, which impacted the number of strings that needed manual coding in 2025. The overall coding error rate (across all coders) was less than 1.0 percent, which is lower than the contractual goal of 2.0 percent. As with conditions, all prescription text strings/codes were reviewed by a verifier, with additional review of select strings by a pharmacy reviewer.
6.1.5.2 Source of Payment Coding
SOP information is collected in both the HC and the MPC. In the Charge Payment section of the HC, the names of the sources of payment are collected in three places: when the bill was paid by a source identified in response to a direct question about payment (REIMNAM); when the bill was sent to a source other than the respondent and the respondent names that source (WHOBILL1); and in response to a question about a direct payment source for prescription medicines (SRCNAME). The responses are coded to one of the sources of payment options in which healthcare expenditures are reported in the MEPS PUFs. These payment sources include the following:
- Out of pocket
- Medicare
- Medicaid
- Private health insurance
- Veterans Administration
- TRICARE
- Other federal
- Other state and local
- Workers’ compensation
- Uncollected liability
- Indian Health Service
- Contractual allowance
- Charity or free care
The SOP Coding Guidelines is a manual updated each year before the start of the annual coding cycle, submitted for AHRQ approval, and distributed to the coders. Health insurance show cards and data from the health insurance plan file for CAPI are available to coders as resource materials. Because the MPC of MEPS uses the same set of SOP codes as the HC, coding rules and decisions are coordinated with the MPC contractor (RTI) to ensure consistency in the coding. Before the start of the coding cycle, Westat compares RTI’s authority tables with its own to identify any inconsistencies. AHRQ adjudicates any inconsistencies to ensure the authority tables from each contractor are aligned.
Each year, the SOP text strings extracted from the reference year data are matched to a historical file of previously coded SOP text strings to create a file of matched strings with suggested or “matched” codes. These match-coded strings are reviewed by coders and verified or modified as needed. This review is required because insurance companies change their product lines and coverage offerings very frequently, and, as a result, the SOP code for a given text string (e.g., the name of an insurance company or plan) can change from year to year. For example, from one year to the next, an insurer or insurance product may participate in or drop out of state exchanges; may offer Medicare Part D or dental or vision insurance, or may drop it; may add Medicare Advantage plans in addition to Medicaid health maintenance organizations (HMOs); or may gain or lose state contracts as Medicaid service providers. As a result of these changes, the appropriate code for a company or specific plan may also change from year to year. Strings that do not match to a string in the history table are researched and have an appropriate SOP code assigned by coding staff.
During 2025, SOP coding was for the payment sources reported for 2024 events. For cases when the bill was paid by a source identified in response to a direct question about payment (REIMNAM), a total of 1,644 previously coded sources of payment text strings were reviewed and updated as needed. After deduplication of the strings reported for 2024, coders reviewed and coded 1,492 strings. If the bill was sent to a source other than the respondent and the respondent named that source (WHOBILL1), coders reviewed and coded 3,145 strings. For text strings reported as direct payers for prescription medicine (SRCNAME), 412 new text strings were reviewed and coded by coders.
6.1.5.3 Industry and Occupation Coding
Industry and occupation coding is performed for MEPS by the Census Bureau using the U.S. Census Bureau’s Demographic Surveys Division’s computer-assisted industry and occupation (I&O) codes, which can be cross-walked to the 2017 North American Industrial Classification System (NAICS) and the 2018 Standard Occupational Classifications (SOC) system. The codes characterize the jobs reported by household respondents and are released annually on the FY Jobs file. During 2025, 10,636 jobs were coded for the 2024 Jobs file.
6.1.5.4 Geographic Coding
The Westat Geographic Information Systems (GIS) division geocodes household addresses, assigning the latitude and longitude coordinates as well as other variables such as county and state Federal Information Processing Standards (FIPS) codes, Metropolitan Statistical Area (MSA) status, Designated Market Area, Census Place, and county. RU-level data are expanded to the person level and delivered to AHRQ as part of the set of “master files” sent yearly. These data are not included in a PUF, but some variables are used for the FY weights processing.
During the calendar year 2025 coding cycle, 13,785 unique address records for FY RUs were processed.
6.2 Data Delivery
The primary objective of MEPS is to produce a series of data files for public release each calendar year. The inter-round processing, editing, and variable construction tasks all serve to prepare these PUFs. Each file addresses one or more aspects of the U.S. civilian noninstitutional population’s access to, use of, and payments for healthcare.
The Oracle system has a separate database for each data year. The MEPS 2025 database, developed in fall 2025, contains Panels 29 and 30. The bulk of data year 2025 activities will occur in 2026. The MEPS 2024 database, fully developed in spring 2025, contains Panels 28 and 29. Editing activities and much of the variable construction for data year 2024 occurred in 2025 and will continue in 2026. Finally, the MEPS 2023 database containing Panels 27 and 28 supported PUF and other internal use deliveries that occurred in 2025.
After the data are in the Oracle delivery database, each analytical team performs basic edit checks on the data to begin the data delivery process. These edits ensure the data conform to the CAPI instrument’s flow as well as AHRQ’s analytical needs. These edits can be run in SAS by using SAS datasets extracted from the delivery database, or in SQL directly on the delivery database. Problems identified through the basic edits process may require data updates. Updates can be implemented in one of two ways:
- Programmatic updates can correct problems affecting a large volume of cases that fail a basic edit.
- Manual updates can be set up with audit trails maintained to correct data anomalies.
Once an analytical team has completed all edits and QC frequencies and univariate analyses have been approved, notification is sent to all other analytical teams so that work can be coordinated in those areas.
6.2.1 Variable Construction
Analytical groups at AHRQ work with Westat analysts to define the variables of interest for inclusion on the PUF and other key data deliveries. Documentation about individual PUFs is available on the MEPS website. Variables are named according to standard naming conventions; once the list is approved, descriptive specifications are written to define each variable and provide detailed information for programming.
Specifications are written at two levels. The high-level, descriptive specification is intended to document the concept of the variable and provide high-level information regarding the variable construction requirements. The detail-level specifications contain the details required to develop programming code to build the variables. Specifications are written and sent to AHRQ for approval. Once approval is received for the specification, program development can proceed for that variable. Specifications guide programming development. Once programs have been written, code reviewers compare newly developed code against specifications to identify problems in either the code or the specifications. This program development process includes a number of steps and checkpoints to ensure that all new programs meet all specification requirements:
- Review approved high- and detailed-level specifications
- Write programs for each specification using SAS or SQL
- Test all programmed code for accuracy
- Conduct detailed code reviews to review specifications and code
- Test code on SAS production files or the Oracle database without committing to changes
- Construct variables either in SAS (and either load variables to Oracle or continue development in SAS, depending on the file) or directly in the Oracle production database
- Review frequencies and cross-tabulations for accuracy
This model is followed for the development of all new programs required for data delivery. For mature programs that are reused in subsequent deliveries with only minor modifications, the process is appropriately streamlined to ensure both accuracy and efficiency for all programs.
6.2.2 File Deliveries
6.2.2.1 Public-Use File Deliveries
The following principal files were delivered during calendar year 2025:
- Full-Year 2023 Population Characteristics file
- Full-Year 2023 Consolidated Data file
- Full-Year 2023 Expenditure Event files for events included in the MPC data collection, including hospital inpatient, outpatient, and emergency room events; office-based physician visits; and home health agency events
- Full-Year 2023 Expenditure Event files for events not included in the MPC data collection, including dental events, office-based nonphysician events, and other medical expenses
- Full-Year 2023 Prescribed Medicines Expenditure file
- Full-Year 2023 Medical Conditions file
- Full-Year 2023 Jobs file
- Full-Year 2023 Appendix to MEPS Event files
- Full-Year 2023 Person Round Plan file
6.2.2.2 Ancillary File Deliveries
In addition to the principal data files delivered for public release each year, the project also produces a number of ancillary files for delivery to AHRQ. These include an extensive series of person- and family-level weights, “raw” data files reflecting MEPS data at intermediate stages of capture and editing, and files generated at the end of each round or as needed to support analysis of both substantive and methodological topics.
6.2.2.3 Medical Provider Component Files
During each year’s processing cycle, Westat creates files for the MPC contractor and, in turn, receives data files from the MPC. As in prior years, Westat provided sample files for the MPC in three waves; the first two waves were delivered while HC data collection was still in progress. In preparing the sample files to be delivered in 2025 for MPC data collection on 2024 health events, Westat again deduplicated the sample of providers. This process, developed in consultation with AHRQ, was designed to reduce the number of duplicate providers reported from the household data collection.
Late in 2024, following the completion of MPC data collection and processing for 2023 events, Westat received the files containing data collected in the MPC, including linkages between events collected in the MPC with matching events collected in the HC. In processing at Westat, matched events from the MPC served as the primary source for imputing expenditure variables for the 2023 events. A similar file of prescribed medicines was also delivered to support matching and imputation of expenditures for the prescribed medicines at AHRQ. Timely and well-coordinated data handoffs between Westat and the MPC are critical to the timely delivery of the FY expenditure files. With each additional year of interaction and cooperation, the handoffs between the MPC and HC have become increasingly smooth. This vital exchange of files fed into imputation activities that occurred in 2025.
Appendix A
Comprehensive Tables – Household Survey
| Data collection period | RU-level sample size* |
|---|---|
| January-June 1996 | 10,799 |
| Panel 1 Round 1 | 10,799 |
| July-December 1996 | 9,485 |
| Panel 1 Round 2 | 9,485 |
| January-June 1997 | 15,689 |
| Panel 1 Round 3 | 9,228 |
| Panel 2 Round 1 | 6,461 |
| July-December 1997 | 14,657 |
| Panel 1 Round 4 | 9,019 |
| Panel 2 Round 2 | 5,638 |
| January-June 1998 | 19,269 |
| Panel 1 Round 5 | 8,477 |
| Panel 2 Round 3 | 5,382 |
| Panel 3 Round 1 | 5,410 |
| July-December 1998 | 9,871 |
| Panel 2 Round 4 | 5,290 |
| Panel 3 Round 2 | 4,581 |
| January-June 1999 | 17,612 |
| Panel 2 Round 5 | 5,127 |
| Panel 3 Round 3 | 5,382 |
| Panel 4 Round 1 | 7,103 |
| July-December 1999 | 10,161 |
| Panel 3 Round 4 | 4,243 |
| Panel 4 Round 2 | 5,918 |
| January-June 2000 | 15,447 |
| Panel 3 Round 5 | 4,183 |
| Panel 4 Round 3 | 5,731 |
| Panel 5 Round 1 | 5,533 |
| July-December 2000 | 10,222 |
| Panel 4 Round 4 | 5,567 |
| Panel 5 Round 2 | 4,655 |
| January-June 2001 | 21,069 |
| Panel 4 Round 5 | 5,547 |
| Panel 5 Round 3 | 4,496 |
| Panel 6 Round 1 | 11,026 |
| July-December 2001 | 13,777 |
| Panel 5 Round 4 | 4,426 |
| Panel 6 Round 2 | 9,351 |
| January-June 2002 | 21,915 |
| Panel 5 Round 5 | 4,393 |
| Panel 6 Round 3 | 9,183 |
| Panel 7 Round 1 | 8,339 |
| July-December 2002 | 15,968 |
| Panel 6 Round 4 | 8,977 |
| Panel 7 Round 2 | 6,991 |
| January-June 2003 | 24,315 |
| Panel 6 Round 5 | 8,830 |
| Panel 7 Round 3 | 6,779 |
| Panel 8 Round 1 | 8,706 |
| July-December 2003 | 13,814 |
| Panel 7, Round 4 | 6,655 |
| Panel 8, Round 2 | 7,159 |
| January-June 2004 | 22,552 |
| Panel 7 Round 5 | 6,578 |
| Panel 8 Round 3 | 7,035 |
| Panel 9 Round 1 | 8,939 |
| July-December 2004 | 14,068 |
| Panel 8, Round 4 | 6,878 |
| Panel 9, Round 2 | 7,190 |
| January-June 2005 | 22,548 |
| Panel 8 Round 5 | 6,795 |
| Panel 9 Round 3 | 7,005 |
| Panel 10 Round 1 | 8,748 |
| July-December 2005 | 13,991 |
| Panel 9, Round 4 | 6,843 |
| Panel 10, Round 2 | 7,148 |
| January-June 2006 | 23,278 |
| Panel 9 Round 5 | 6,703 |
| Panel 10 Round 3 | 6,921 |
| Panel 11 Round 1 | 9,654 |
| July-December 2006 | 14,280 |
| Panel 10 Round 4 | 6,708 |
| Panel 11 Round 2 | 7,572 |
| January-June 2007 | 21,326 |
| Panel 10 Round 5 | 6,596 |
| Panel 11 Round 3 | 7,263 |
| Panel 12 Round 1 | 7,467 |
| July-December 2007 | 12,906 |
| Panel 11 Round 4 | 7,005 |
| Panel 12 Round 2 | 5,901 |
| January-June 2008 | 22,414 |
| Panel 11 Round 5 | 6,895 |
| Panel 12 Round 3 | 5,580 |
| Panel 13 Round 1 | 9,939 |
| July-December 2008 | 13,384 |
| Panel 12 Round 4 | 5,376 |
| Panel 13 Round 2 | 8,008 |
| January-June 2009 | 22,960 |
| Panel 12 Round 5 | 5,261 |
| Panel 13 Round 3 | 7,800 |
| Panel 14 Round 1 | 9,899 |
| July-December 2009 | 15,339 |
| Panel 13 Round 4 | 7,670 |
| Panel 14 Round 2 | 7,669 |
| January-June 2010 | 23,770 |
| Panel 13 Round 5 | 7,576 |
| Panel 14 Round 3 | 7,226 |
| Panel 15 Round 1 | 8,968 |
| July-December 2010 | 13,785 |
| Panel 14 Round 4 | 6,974 |
| Panel 15 Round 2 | 6,811 |
| January-June 2011 | 23,693 |
| Panel 14 Round 5 | 6,845 |
| Panel 15 Round 3 | 6,431 |
| Panel 16 Round 1 | 10,417 |
| July-December 2011 | 14,802 |
| Panel 15 Round 4 | 6,254 |
| Panel 16 Round 2 | 8,548 |
| January-June 2012 | 24,247 |
| Panel 15 Round 5 | 6,156 |
| Panel 16 Round 3 | 8,160 |
| Panel 17 Round 1 | 9,931 |
| July-December 2012 | 16,161 |
| Panel 16 Round 4 | 8,048 |
| Panel 17 Round 2 | 8,113 |
| January-June 2013 | 25,788 |
| Panel 16 Round 5 | 7,969 |
| Panel 17 Round 3 | 7,869 |
| Panel 18 Round 1 | 9,950 |
| July-December 2013 | 15,347 |
| Panel 17 Round 4 | 7,656 |
| Panel 18 Round 2 | 7,691 |
| January-June 2014 | 24,857 |
| Panel 17 Round 5 | 7,485 |
| Panel 18 Round 3 | 7,402 |
| Panel 19 Round 1 | 9,970 |
| July-December 2014 | 14,665 |
| Panel 18 Round 4 | 7,203 |
| Panel 19 Round 2 | 7,462 |
| January-June 2015 | 25,185 |
| Panel 18 Round 5 | 7,163 |
| Panel 19 Round 3 | 7,168 |
| Panel 20 Round 1 | 10,854 |
| July-December 2015 | 15,247 |
| Panel 19 Round 4 | 6,946 |
| Panel 20 Round 2 | 8,301 |
| January-June 2016 | 24,694 |
| Panel 19 Round 5 | 6,856 |
| Panel 20 Round 3 | 7,987 |
| Panel 21 Round 1 | 9,851 |
| July-December 2016 | 15,390 |
| Panel 20 Round 4 | 7,729 |
| Panel 21 Round 2 | 7,661 |
| January-June 2017 | 24,774 |
| Panel 20 Round 5 | 7,611 |
| Panel 21 Round 3 | 7,327 |
| Panel 22 Round 1 | 9,835 |
| July-December 2017 | 14,396 |
| Panel 21 Round 4 | 7,025 |
| Panel 22 Round 2 | 7,370 |
| January-June 2018 | 223,573 |
| Panel 21 Round 5 | 6,842 |
| Panel 22 Round 3 | 6,892 |
| Panel 23 Round 1 | 9,839 |
| July-December 2018 | 13,766 |
| Panel 22 Round 4 | 6,726 |
| Panel 23 Round 2 | 7,040 |
| January-June 2019 | 23,261 |
| Panel 22 Round 5 | 6,624 |
| Panel 23 Round 3 | 6,773 |
| Panel 24 Round 1 | 9,864 |
| July-December 2019 | 13,403 |
| Panel 23 Round 4 | 6,569 |
| Panel 24 Round 2 | 6,8348 |
| January-June 2020 | 22,667 |
| Panel 23 Round 5 | 6,413 |
| Panel 24 Round 3 | 6,382 |
| Panel 25 Round 1 | 9,872 |
| July-December 2020 | 15,633 |
| Panel 23 Round 6 | 5,264 |
| Panel 24 Round 4 | 5,574 |
| Panel 25 Round 2 | 4,795 |
| January-June 2021 | 23,340 |
| Panel 23 Round 7 | 4,624 |
| Panel 24 Round 5 | 4,879 |
| Panel 25 Round 3 | 4,328 |
| Panel 26 Round 1 | 9,509 |
| July-December 2021 | 16,828 |
| Panel 23 Round 8 | 4,093 |
| Panel 24 Round 6 | 4,048 |
| Panel 25 Round 4 | 3,768 |
| Panel 26 Round 2 | 4,919 |
| January-June 2022 | 24,465 |
| Panel 23 Round 9 | 3,673 |
| Panel 24 Round 7 | 3,573 |
| Panel 25 Round 5 | 3,339 |
| Panel 26 Round 3 | 4,180 |
| Panel 27 Round 1 | 9,700 |
| July-December 2022 | 12,491 |
| Panel 24 Round 8 | 3,174 |
| Panel 26 Round 4 | 3,866 |
| Panel 27 Round 2 | 5,451 |
| January-June 2023 | 18,155 |
| Panel 24 Round 9 | 3,019 |
| Panel 26 Round 5 | 3,585 |
| Panel 27 Round 3 | 4,882 |
| Panel 28 Round 1 | 6,669 |
| July-December 2023 | 10,411 |
| Panel 27 Round 4 | 4,564 |
| Panel 28 Round 2 | 5,847 |
| January-June 2024 | 20,678 |
| Panel 27 Round 5 | 4,497 |
| Panel 28 Round 3 | 5,757 |
| Panel 29 Round 1 | 10,424 |
| July-December 2024 | 11,654 |
| Panel 28 Round 4 | 5,127 |
| Panel 29 Round 2 | 6,527 |
| January-June 2025 | 18,502 |
| Panel 28 Round 5 | 4,822 |
| Panel 29 Round 3 | 5,713 |
| Panel 30 Round 1 | 7,967 |
| July-December 2025 | 9,708 |
| Panel 29 Round 4 | 4,928 |
| Panel 30 Round 2 | 4,780 |
* RU-level sample size for this table derived from the field management system counts and operational reports detailing the fielded sample.
| Panel/Round | Original sample | Split cases (movers) | Student cases | Out-of-scope cases | Net sample | Completes | Average interviewer hours/ complete | Response rate (%) | |
|---|---|---|---|---|---|---|---|---|---|
| Panel 1 | Round 1 | 10,799 | 675 | 125 | 165 | 11,434 | 9,496 | 10.4 | 83.1 |
| Round 2 | 9,485 | 310 | 74 | 101 | 9,768 | 9,239 | 8.7 | 94.6 | |
| Round 3 | 9,228 | 250 | 28 | 78 | 9,428 | 9,031 | 8.6 | 95.8 | |
| Round 4 | 9,019 | 261 | 33 | 89 | 9,224 | 8,487 | 8.5 | 92.0 | |
| Round 5 | 8,477 | 80 | 5 | 66 | 8,496 | 8,369 | 6.5 | 98.5 | |
| Panel 2 | Round 1 | 6,461 | 431 | 71 | 151 | 6,812 | 5,660 | 12.9 | 83.1 |
| Round 2 | 5,638 | 204 | 27 | 54 | 5,815 | 5,395 | 9.1 | 92.8 | |
| Round 3 | 5,382 | 166 | 15 | 52 | 5,511 | 5,296 | 8.5 | 96.1 | |
| Round 4 | 5,290 | 105 | 27 | 65 | 5,357 | 5,129 | 8.3 | 95.7 | |
| Round 5 | 5,127 | 38 | 2 | 56 | 5,111 | 5,049 | 6.7 | 98.8 | |
| Panel 3 | Round 1 | 5,410 | 349 | 44 | 200 | 5,603 | 4,599 | 12.7 | 82.1 |
| Round 2 | 4,581 | 106 | 25 | 39 | 4,673 | 4,388 | 8.3 | 93.9 | |
| Round 3 | 4,382 | 102 | 4 | 42 | 4,446 | 4,249 | 7.3 | 95.5 | |
| Round 4 | 4,243 | 86 | 17 | 33 | 4,313 | 4,184 | 6.7 | 97.0 | |
| Round 5 | 4,183 | 23 | 1 | 26 | 4,181 | 4,114 | 5.6 | 98.4 | |
| Panel 4 | Round 1 | 7,103 | 371 | 64 | 134 | 7,404 | 5,948 | 10.9 | 80.3 |
| Round 2 | 5,918 | 197 | 47 | 40 | 6,122 | 5,737 | 7.2 | 93.7 | |
| Round 3 | 5,731 | 145 | 10 | 39 | 5,847 | 5,574 | 6.9 | 95.3 | |
| Round 4 | 5,567 | 133 | 35 | 39 | 5,696 | 5,540 | 6.8 | 97.3 | |
| Round 5 | 5,547 | 52 | 4 | 47 | 5,556 | 5,500 | 6.0 | 99.0 | |
| Panel 5 | Round 1 | 5,533 | 258 | 62 | 103 | 5,750 | 4,670 | 11.1 | 81.2 |
| Round 2 | 4,655 | 119 | 27 | 27 | 4,774 | 4,510 | 7.7 | 94.5 | |
| Round 3 | 4,496 | 108 | 17 | 24 | 4,597 | 4,437 | 7.2 | 96.5 | |
| Round 4 | 4,426 | 117 | 20 | 41 | 4,522 | 4,396 | 7.0 | 97.2 | |
| Round 5 | 4,393 | 47 | 12 | 32 | 4,420 | 4,357 | 5.5 | 98.6 | |
| Panel 6 | Round 1 | 11,026 | 595 | 135 | 200 | 11,556 | 9,382 | 10.8 | 81.2 |
| Round 2 | 9,351 | 316 | 49 | 50 | 9,666 | 9,222 | 7.2 | 95.4 | |
| Round 3 | 9,183 | 215 | 23 | 41 | 9,380 | 9,001 | 6.5 | 96.0 | |
| Round 4 | 8,977 | 174 | 32 | 66 | 9,117 | 8,843 | 6.6 | 97.0 | |
| Round 5 | 8,830 | 94 | 14 | 46 | 8,892 | 8,781 | 5.6 | 98.8 | |
| Panel 7 | Round 1 | 8,339 | 417 | 76 | 122 | 8,710 | 7,008 | 10.0 | 80.5 |
| Round 2 | 6,991 | 190 | 40 | 24 | 7,197 | 6,802 | 7.2 | 94.5 | |
| Round 3 | 6,779 | 169 | 21 | 32 | 6,937 | 6,673 | 6.5 | 96.2 | |
| Round 4 | 6,655 | 133 | 17 | 34 | 6,771 | 6,593 | 7.0 | 97.4 | |
| Round 5 | 6,578 | 79 | 11 | 39 | 6,629 | 6,529 | 5.7 | 98.5 | |
| Panel 8 | Round 1 | 8,706 | 441 | 73 | 175 | 9,045 | 7,177 | 10.0 | 79.3 |
| Round 2 | 7,159 | 218 | 52 | 36 | 7,393 | 7,049 | 7.2 | 95.4 | |
| Round 3 | 7,035 | 150 | 13 | 33 | 7,165 | 6,892 | 6.5 | 96.2 | |
| Round 4 | 6,878 | 149 | 27 | 53 | 7,001 | 6,799 | 7.3 | 97.1 | |
| Round 5 | 6,795 | 71 | 8 | 41 | 6,833 | 6,726 | 6.0 | 98.4 | |
| Panel 9 | Round 1 | 8,939 | 417 | 73 | 179 | 9,250 | 7,205 | 10.5 | 77.9 |
| Round 2 | 7,190 | 237 | 40 | 40 | 7,427 | 7,027 | 7.7 | 94.6 | |
| Round 3 | 7,005 | 189 | 24 | 31 | 7,187 | 6,861 | 7.1 | 95.5 | |
| Round 4 | 6,843 | 142 | 23 | 44 | 6,964 | 6,716 | 7.4 | 96.5 | |
| Round 5 | 6,703 | 60 | 8 | 43 | 6,728 | 6,627 | 6.1 | 98.5 | |
| Panel 10 | Round 1 | 8,748 | 430 | 77 | 169 | 9,086 | 7,175 | 11.0 | 79.0 |
| Round 2 | 7,148 | 219 | 36 | 22 | 7,381 | 6,940 | 7.8 | 94.0 | |
| Round 3 | 6,921 | 156 | 10 | 31 | 7,056 | 6,727 | 6.8 | 95.3 | |
| Round 4 | 6,708 | 155 | 13 | 34 | 6,842 | 6,590 | 7.3 | 96.3 | |
| Round 5 | 6,596 | 55 | 9 | 38 | 6,622 | 6,461 | 6.2 | 97.6 | |
| Panel 11 | Round 1 | 9,654 | 399 | 81 | 162 | 9,972 | 7,585 | 11.5 | 76.1 |
| Round 2 | 7,572 | 244 | 42 | 24 | 7,834 | 7,276 | 7.8 | 92.9 | |
| Round 3 | 7,263 | 170 | 15 | 25 | 7,423 | 7,007 | 6.9 | 94.4 | |
| Round 4 | 7,005 | 139 | 14 | 36 | 7,122 | 6,898 | 7.2 | 96.9 | |
| Round 5 | 6,895 | 51 | 7 | 44 | 6,905 | 6,781 | 5.5 | 98.2 | |
| Panel 12 | Round 1 | 7,467 | 331 | 86 | 172 | 7,712 | 5,901 | 14.2 | 76.5 |
| Round 2 | 5,901 | 157 | 27 | 27 | 6,058 | 5,584 | 9.1 | 92.2 | |
| Round 3 | 5,580 | 105 | 13 | 12 | 5,686 | 5,383 | 8.1 | 94.7 | |
| Round 4 | 5,376 | 102 | 12 | 16 | 5,474 | 5,267 | 8.8 | 96.2 | |
| Round 5 | 5,261 | 50 | 8 | 21 | 5,298 | 5,182 | 6.4 | 97.8 | |
| Panel 13 | Round 1 | 9,939 | 502 | 97 | 213 | 10,325 | 8,017 | 12.2 | 77.6 |
| Round 2 | 8,008 | 220 | 47 | 23 | 8,252 | 7,809 | 9.0 | 94.6 | |
| Round 3 | 7,802 | 204 | 14 | 38 | 7,982 | 7,684 | 7.2 | 96.2 | |
| Round 4 | 7,670 | 162 | 17 | 40 | 7,809 | 7,576 | 7.5 | 97.0 | |
| Round 5 | 7,576 | 70 | 15 | 38 | 7,623 | 7,461 | 6.1 | 97.9 | |
| Panel 14 | Round 1 | 9,899 | 394 | 74 | 140 | 10,227 | 7,650 | 12.3 | 74.8 |
| Round 2 | 7,669 | 212 | 29 | 27 | 7,883 | 7,239 | 8.3 | 91.8 | |
| Round 3 | 7,226 | 144 | 23 | 34 | 7,359 | 6,980 | 7.3 | 94.9 | |
| Round 4 | 6,974 | 112 | 23 | 30 | 7,079 | 6,853 | 7.7 | 96.8 | |
| Round 5 | 6,845 | 55 | 9 | 30 | 6,879 | 6,761 | 6.2 | 98.3 | |
| Panel 15 | Round 1 | 8,968 | 374 | 73 | 157 | 9,258 | 6,802 | 13.2 | 73.5 |
| Round 2 | 6,811 | 171 | 19 | 21 | 6,980 | 6,435 | 8.9 | 92.2 | |
| Round 3 | 6,431 | 134 | 23 | 22 | 6,566 | 6,261 | 7.2 | 95.4 | |
| Round 4 | 6,254 | 116 | 15 | 26 | 6,359 | 6,165 | 7.8 | 97.0 | |
| Round 5 | 6,156 | 50 | 5 | 19 | 6,192 | 6,078 | 6.0 | 98.2 | |
| Panel 16 | Round 1 | 10,417 | 504 | 98 | 555 | 10,940 | 8,553 | 11.4 | 78.2 |
| Round 2 | 8,353 | 248 | 40 | 32 | 8,821 | 8,351 | 7.6 | 94.7 | |
| Round 3 | 8,160 | 223 | 19 | 27 | 8,375 | 8,236 | 6.4 | 96.1 | |
| Round 4 | 8,048 | 151 | 16 | 13 | 8,390 | 8,162 | 6.6 | 97.3 | |
| Round 5 | 7,969 | 66 | 13 | 25 | 8,198 | 7,998 | 5.5 | 97.6 | |
| Panel 17 | Round 1 | 9,931 | 490 | 92 | 127 | 10,386 | 8,121 | 11.7 | 78.2 |
| Round 2 | 8,113 | 230 | 35 | 19 | 8,359 | 7,874 | 7.9 | 94.2 | |
| Round 3 | 7,869 | 180 | 15 | 15 | 8,049 | 7,663 | 6.3 | 95.2 | |
| Round 4 | 7,656 | 199 | 19 | 30 | 7,844 | 7,494 | 7.4 | 95.5 | |
| Round 5 | 7,485 | 87 | 10 | 23 | 7,559 | 7,445 | 6.1 | 98.5 | |
| Panel 18 | Round 1 | 9,950 | 435 | 83 | 111 | 10,357 | 7,683 | 12.3 | 74.2 |
| Round 2 | 7,691 | 264 | 32 | 16 | 7,971 | 7,402 | 9.2 | 92.9 | |
| Round 3 | 7,402 | 235 | 21 | 22 | 7,635 | 7,213 | 7.6 | 94.5 | |
| Round 4 | 7,203 | 189 | 14 | 22 | 7,384 | 7,172 | 7.5 | 97.1 | |
| Round 5 | 7,163 | 94 | 12 | 15 | 7,254 | 7,138 | 6.2 | 98.4 | |
| Panel 19 | Round 1 | 9,970 | 492 | 70 | 115 | 10,417 | 7,475 | 13.5 | 71.8 |
| Round 2 | 7,460 | 222 | 23 | 24 | 7,681 | 7,188 | 8.4 | 93.6 | |
| Round 3 | 7,168 | 187 | 12 | 17 | 7,350 | 6,962 | 7.0 | 94.7 | |
| Round 4 | 6,946 | 146 | 20 | 23 | 7,089 | 6,858 | 7.4 | 96.7 | |
| Round 5 | 6,856 | 75 | 7 | 24 | 6,914 | 6,794 | 5.9 | 98.3 | |
| Panel 20 | Round 1 | 10,854 | 496 | 85 | 117 | 11,318 | 8,318 | 12.5 | 73.5 |
| Round 2 | 8,301 | 243 | 39 | 22 | 8,561 | 7,998 | 8.3 | 93.4 | |
| Round 3 | 7,987 | 173 | 17 | 26 | 8,151 | 7,753 | 6.8 | 95.1 | |
| Round 4 | 7,729 | 161 | 19 | 31 | 7,878 | 7,622 | 7.2 | 96.8 | |
| Round 5 | 7,611 | 99 | 13 | 23 | 7,700 | 7,421 | 6.0 | 96.4 | |
| Panel 21 | Round 1 | 9,851 | 462 | 92 | 89 | 10,316 | 7,674 | 12.6 | 74.4 |
| Round 2 | 7,661 | 207 | 32 | 17 | 7,883 | 7,327 | 8.5 | 93.0 | |
| Round 3 | 7,327 | 166 | 14 | 19 | 7,488 | 7,043 | 7.2 | 94.1 | |
| Round 4 | 7,025 | 119 | 14 | 20 | 7,138 | 6,907 | 7.0 | 96.8 | |
| Round 5 | 6,914 | 42 | 8 | 34 | 6,930 | 6,778 | 5.9 | 97.8 | |
| Panel 22 | Round 1 | 9,835 | 352 | 68 | 86 | 10,169 | 7,381 | 12.8 | 72.6 |
| Round 2 | 7,371 | 166 | 19 | 11 | 7,545 | 7,039 | 8.5 | 93.3 | |
| Round 3 | 7,071 | 100 | 12 | 19 | 7,164 | 6,808 | 6.7 | 95.0 | |
| Round 4 | 6,815 | 91 | 13 | 18 | 6,901 | 6,672 | 6.8 | 96.7 | |
| Round 5 | 6,670 | 35 | 7 | 12 | 6,700 | 6,584 | 5.3 | 98.3 | |
| Panel 23 | Round 1 | 9,960 | 1,931 | 46 | 110 | 10,089 | 7,351 | 12.5 | 72.9 |
| Round 2 | 7,387 | 106 | 14 | 15 | 7,492 | 6,960 | 8.2 | 92.9 | |
| Round 3 | 6,987 | 102 | 11 | 18 | 7,082 | 6,703 | 6.1 | 94.6 | |
| Round 4 | 6,704 | 74 | 10 | 12 | 6,776 | 6,522 | 6.6 | 96.2 | |
| Round 5 | 6,503 | 34 | 4 | 5 | 6,536 | 6,383 | 5.3 | 97.7 | |
| Round 6 | 6,498 | 90 | 10 | 18 | 6,480 | 5,120 | 4.8 | 79.0 | |
| Round 7 | 5,176 | 36 | 5 | 6 | 5,170 | 4,513 | 5.2 | 87.3 | |
| Round 8 | 4,558 | 27 | 3 | 10 | 4,548 | 3,984 | 5.8 | 87.6 | |
| Round 9 | 4,006 | 10 | 4 | 10 | 3,996 | 3,603 | 4.7 | 90.2 | |
| Panel 24 | Round 1 | 9,976 | 153 | 43 | 82 | 10,090 | 7,186 | 11.8 | 71.2 |
| Round 2 | 7,211 | 98 | 19 | 5 | 7,323 | 6,777 | 7.9 | 92.5 | |
| Round 3 | 6,812 | 76 | 9 | 7 | 6,890 | 6,289 | 6.0 | 91.3 | |
| Round 4 | 6,335 | 44 | 4 | 13 | 6,370 | 5,446 | 5.1 | 85.5 | |
| Round 5 | 5,510 | 31 | 4 | 15 | 5,495 | 4,770 | 5.3 | 86.8 | |
| Round 6 | 4,816 | 22 | 8 | 8 | 4,808 | 3,959 | 5.7 | 82.3 | |
| Round 7 | 4,007 | 28 | 0 | 5 | 4,002 | 3,500 | 5.3 | 87.5 | |
| Round 8 | 3,528 | 14 | 0 | 9 | 3,519 | 3,121 | 5.9 | 88.7 | |
| Round 9 | 3,135 | 11 | 1 | 6 | 3,129 | 2,988 | 4.5 | 95.5 | |
| Panel 25 | Round 1 | 10,008 | 184 | 38 | 78 | 10,152 | 6,265 | 10.8 | 61.7 |
| Round 2 | 5,907 | 49 | 14 | 12 | 5,958 | 4,677 | 5.5 | 78.5 | |
| Round 3 | 5,191 | 38 | 5 | 2 | 5,189 | 4,230 | 6.1 | 81.5 | |
| Round 4 | 4,314 | 40 | 10 | 7 | 4,307 | 3,685 | 7.3 | 85.6 | |
| Round 5 | 3,712 | 11 | 5 | 6 | 3,706 | 3,278 | 5.3 | 88.4 | |
| Panel 26 | Round 1 | 9,674 | 160 | 29 | 68 | 9,795 | 5,882 | 11.1 | 60.1 |
| Round 2 | 6,047 | 83 | 11 | 2 | 6,045 | 4,799 | 9.0 | 79.4 | |
| Round 3 | 4,882 | 42 | 4 | 6 | 4,876 | 4,103 | 6.8 | 84.1 | |
| Round 4 | 4,165 | 30 | 11 | 4 | 4,161 | 3,805 | 7.6 | 94.4 | |
| Round 5 | 3,817 | 11 | 2 | 8 | 3,809 | 3,541 | 4.7 | 93.0 | |
| Panel 27 | Round 1 | 10,085 | 193 | 28 | 78 | 10,007 | 6,158 | 13.2 | 61.5 |
| Round 2 | 6,288 | 68 | 11 | 3 | 6,285 | 5,368 | 8.9 | 85.4 | |
| Round 3 | 5,434 | 37 | 6 | 5 | 5,429 | 4,818 | 7.1 | 88.8 | |
| Round 4 | 4,880 | 40 | 3 | 12 | 4,868 | 4,509 | 7.3 | 92.6 | |
| Round 5 | 4,551 | 21 | 4 | 7 | 4,544 | 4,262 | 5.5 | 93.8 | |
| Panel 28 | Round 1 | 10,110 | 175 | 19 | 75 | 10,035 | 6,527 | 13.7 | 65.0 |
| Round 2 | 6,640 | 62 | 7 | 5 | 6,635 | 5,766 | 8.7 | 86.9 | |
| Round 3 | 5,834 | 42 | 2 | 8 | 5,826 | 5,143 | 7.4 | 88.3 | |
| Round 4 | 5,193 | 51 | 5 | 11 | 5,182 | 4,812 | 7.6 | 92.9 | |
| Round 5 | 4,822 | 13 | 2 | 9 | 4,828 | 4,582 | 5.5 | 94.9 | |
| Panel 29 | Round 1 | 10,424 | 251 | 49 | 107 | 10,617 | 6,537 | 14.9 | 61.6 |
| Round 2 | 6,527 | 77 | 10 | 6 | 6,686 | 5,674 | 10.0 | 85.1 | |
| Round 3 | 5,713 | 40 | 1 | 6 | 5,748 | 4,894 | 7.5 | 85.1 | |
| Round 4 | 4,928 | 34 | 3 | 18 | 4,947 | 4,510 | 7.4 | 91.2 | |
| Round 5 | |||||||||
| Panel 30 | Round 1 | 7,967 | 96 | 27 | 105 | 7,985 | 4,745 | 14.8 | 59.4 |
| Round 2 | 4,780 | 48 | 2 | 4 | 4,826 | 3,979 | 9.3 | 82.4 | |
| Round 3 | |||||||||
| Round 4 | |||||||||
| Round 5 | |||||||||
* Figures in the table are weighted to reflect results of the interim nonresponse subsampling procedure implemented in the first Round of Panel 16.
| Year/Panel | Round 1 | Round 2 | Round 3 | Round 4 | Round 5 | Round 6 | Round 7 | Round 8 | Round 9 |
|---|---|---|---|---|---|---|---|---|---|
| 2010 | |||||||||
| Panel 15 | 73.5 | 92.2 | |||||||
| Panel 14 | 94.9 | 96.8 | |||||||
| Panel 13 | 97.9 | ||||||||
| 2011 | |||||||||
| Panel 16 | 78.2 | 94.8 | |||||||
| Panel 15 | 95.4 | 97.0 | |||||||
| Panel 14 | 98.3 | ||||||||
| 2012 | |||||||||
| Panel 17 | 78.2 | 94.2 | |||||||
| Panel 16 | 96.1 | 97.3 | |||||||
| Panel 15 | 98.2 | ||||||||
| 2013 | |||||||||
| Panel 18 | 74.2 | 92.9 | |||||||
| Panel 17 | 95.2 | 95.5 | |||||||
| Panel 16 | 97.6 | ||||||||
| 2014 | |||||||||
| Panel 19 | 71.8 | 93.6 | |||||||
| Panel 18 | 94.5 | 97.1 | |||||||
| Panel 17 | 98.5 | ||||||||
| 2015 | |||||||||
| Panel 20 | 73.5 | 93.4 | |||||||
| Panel 19 | 94.7 | 96.7 | |||||||
| Panel 18 | 98.4 | ||||||||
| 2016 | |||||||||
| Panel 21 | 74.4 | 93.0 | |||||||
| Panel 20 | 95.1 | 96.8 | |||||||
| Panel 19 | 98.3 | ||||||||
| 2017 | |||||||||
| Panel 22 | 72.6 | 93.3 | |||||||
| Panel 21 | 94.1 | 96.8 | |||||||
| Panel 20 | 96.4 | ||||||||
| 2018 | |||||||||
| Panel 23 | 72.9 | 92.9 | |||||||
| Panel 22 | 95.0 | 96.7 | |||||||
| Panel 21 | 97.8 | ||||||||
| 2019 | |||||||||
| Panel 24 | 71.2 | 92.5 | |||||||
| Panel 23 | 94.6 | 96.2 | |||||||
| Panel 22 | 98.3 | ||||||||
| 2020 | |||||||||
| Panel 25 | 61.7 | 78.5 | |||||||
| Panel 24 | 91.3 | 85.5 | |||||||
| Panel 23 | 97.7 | 79.0 | |||||||
| 2021 | |||||||||
| Panel 26 | 60.1 | 79.4 | |||||||
| Panel 25 | 81.5 | 85.6 | |||||||
| Panel 24 | 86.8 | 82.3 | |||||||
| Panel 23 | 87.3 | 87.6 | |||||||
| 2022 | |||||||||
| Panel 27 | 61.5 | 85.4 | |||||||
| Panel 26 | 84.1 | 91.4 | |||||||
| Panel 25 | 88.6 | ||||||||
| Panel 24 | 87.5 | 88.7 | |||||||
| Panel 23 | 90.2 | ||||||||
| 2023 | |||||||||
| Panel 28 | 65.0 | 86.9 | |||||||
| Panel 27 | 88.8 | 92.6 | |||||||
| Panel 26 | 93.0 | ||||||||
| Panel 24 | 95.5 | ||||||||
| 2024 | |||||||||
| Panel 29 | 61.6 | 85.1 | |||||||
| Panel 28 | 88.3 | 92.9 | |||||||
| Panel 27 | 93.8 | ||||||||
| 2025 | |||||||||
| Panel 30 | 59.4 | 82.4 | |||||||
| Panel 29 | 85.1 | 91.2 | |||||||
| Panel 28 | 94.9 | ||||||||
| Response and nonresponse components | 2014 P19R1 |
2015 P20R1 |
2016 P21R1 |
2017 P22R1 |
2018 P23R1 |
2019 P24R1 |
2020 25R1 |
2021 P26R1 |
2022 P27R1 |
2023 P28R1 |
2024 P29R1 |
2025 P30R1 |
|---|---|---|---|---|---|---|---|---|---|---|---|---|
| Total sample | 10,532 | 11,435 | 10,405 | 10,255 | 10,199 | 10,172 | 10,230 | 9,863 | 10,085 | 10,116 | 10,724 | 8,090 |
| Out of scope (%) | 1.1 | 1.0 | 0.9 | 0.8 | 1.1 | 0.8 | 0.8 | 0.7 | 0.8 | 0.8 | 1.0 | 1.3 |
| Complete (%) | 71.8 | 73.5 | 74.4 | 72.6 | 72.1 | 70.6 | 61.2 | 59.6 | 61.1 | 64.5 | 61.0 | 58.7 |
| Nonresponse (%) | 28.2 | 26.5 | 25.6 | 27.4 | 26.9 | 28.6 | 38.0 | 39.7 | 38.2 | 34.7 | 38.0 | 40.0 |
| Refusal (%) | 22.4 | 21.0 | 20.2 | 21.8 | 22.1 | 24.0 | 28.7 | 31.2 | 30.4 | 29.7 | 32.0 | 33.3 |
| Not located (%) | 4.2 | 4.3 | 3.7 | 3.9 | 3.1 | 3.1 | 3.2 | 4.3 | 3.3 | 2.5 | 2.8 | 3.0 |
| Other nonresponse (%) | 1.6 | 1.2 | 1.7 | 1.7 | 1.7 | 1.5 | 6.1 | 4.2 | 4.5 | 2.5 | 3.3 | 3.7 |
| NHIS completion status | 2014 P19R1 |
2015 P20R1 |
2016 P21R1 |
2017 P22R1 |
2018 P23R1 |
2019 P24R1 |
2020 P25R1 |
2021 P26R1 |
2022 P27R1 |
2023 P28R1 |
2024 P29R1 |
2025 P30R1 |
|---|---|---|---|---|---|---|---|---|---|---|---|---|
| Original NHIS sample (N) | 9,970 | 10,854 | 9,851 | 9,835 | 9,839 | 9,864 | 10,224 | 9,863 | 10,085 | 10,110 | 10,724 | 8,090 |
| Percentage complete in NHIS | 81.9 | 80.6 | 77.6 | 81.0 | 80.4 | 84.2 | 89.1 | 85.2 | 83.0 | 84.9 | 81.4 | 82.4 |
| Percentage partial complete in NHIS | 18.1 | 19.4 | 22.4 | 19.0 | 19.6 | 15.8 | 10.9 | 14.8 | 17.0 | 15.1 | 18.6 | 17.6 |
| Percentage complete for NHIS completes | 74.5 | 75.9 | 77.3 | 75.4 | 75.4 | 73.5 | 62.9 | 62.2 | 63.4 | 66.8 | 64.5 | 61.4 |
| Percentage complete for NHIS partial completes | 58.9 | 63.1 | 64.8 | 62.0 | 63.6 | 60.3 | 47.3 | 44.5 | 49.4 | 51.5 | 45.1 | 45.5 |
Note: Figures shown are based on original NHIS sample and exclude reporting units added to the sample as “splits” and “students.”
| Panel | Net sample (N) | Ever refused (%) | Converted (%) | Final refusal rate (%) | Final response rate (%) |
|---|---|---|---|---|---|
| Panel 15 | 9,258 | 29.4 | 26.6 | 21.0 | 73.5 |
| Panel 16 | 10,940 | 26.3 | 30.9 | 17.6 | 78.2 |
| Panel 17 | 10,386 | 25.3 | 30.2 | 17.2 | 78.2 |
| Panel 18 | 10,357 | 25.5 | 25.0 | 18.1 | 74.2 |
| Panel 19 | 10,418 | 30.1 | 23.3 | 22.4 | 71.8 |
| Panel 20 | 11,318 | 30.1 | 29.2 | 21.0 | 73.5 |
| Panel 21 | 10,316 | 29.1 | 29.0 | 20.2 | 74.4 |
| Panel 22 | 10,169 | 30.1 | 27.6 | 21.8 | 72.6 |
| Panel 23 | 10,089 | 31.3 | 25.6 | 22.4 | 72.9 |
| Panel 24 | 10,090 | 32.6 | 23.4 | 24.2 | 71.2 |
| Panel 25 | 10,152 | 34.8 | 12.3 | 30.5 | 61.7 |
| Panel 26 | 9,795 | 40.5 | 19.3 | 32.6 | 60.1 |
| Panel 27 | 10,007 | 37.8 | 14.8 | 32.1 | 61.5 |
| Panel 28 | 10,035 | 36.8 | 16.3 | 30.7 | 65.0 |
| Panel 29 | 10,617 | 39.4 | 15.8 | 33.1 | 61.6 |
| Panel 30 | 7,985 | 40.7 | 14.0 | 34.8 | 59.4 |
| Panel | Total sample (N) | Ever traced (%) | Not located (%) |
|---|---|---|---|
| Panel 15 | 9,415 | 16.7 | 4.1 |
| Panel 16 | 11,019 | 18.2 | 3.0 |
| Panel 17 | 10,513 | 18.7 | 3.6 |
| Panel 18 | 10,468 | 16.0 | 4.3 |
| Panel 19 | 10,532 | 19.5 | 4.1 |
| Panel 20 | 11,435 | 14.0 | 4.3 |
| Panel 21 | 10,405 | 12.8 | 3.7 |
| Panel 22 | 10,228 | 13.0 | 3.9 |
| Panel 23 | 10,199 | 12.7 | 3.0 |
| Panel 24 | 10,172 | 12.6 | 3.0 |
| Panel 25 | 10,230 | 11.1 | 3.2 |
| Panel 26 | 9,863 | 10.8 | 4.3 |
| Panel 27 | 10,085 | 10.6 | 3.3 |
| Panel 28 | 10,110 | 9.8 | 2.5 |
| Panel 29 | 10,724 | 9.4 | 2.8 |
| Panel 30 | 8,090 | 10.7 | 3.0 |
| Round | 2012 Panel 17 | 2013 Panel 18 | 2014 Panel 19 | 2015 Panel 20 | 2016 Panel 21 | 2017 Panel 22 | 2018 Panel 23 | 2019 Panel 24 | 2020 Panel 25 | 2021 Panel 26 | 2022 Panel 27 | 2023 Panel 28 | 2024 Panel 29 | 2025 Panel 30 |
|---|---|---|---|---|---|---|---|---|---|---|---|---|---|---|
| Round 1 | 67.8 | 78.0 | 85.5 | 76.4 | 75.5 | 79.9 | 78.1 | 79.5 | 89.1 | 93.0 | 82.7 | 80.9 | 81.1 | 81.8 |
| Round 2 | 90.2 | 102.9 | 92.3 | 86.3 | 85.3 | 88.8 | 88.2 | 87.0 | 89.7 | 93.3 | 79.3 | 79.7 | 88.2 | 91.1 |
| Round 3 | 94.3 | 103.1 | 94.5 | 89.7 | 93.4 | 93.0 | 92.6 | 98.5 | 99.6 | 90.1 | 86.5 | 89.8 | 93.9 | |
| Round 4 | 99.6 | 89.0 | 84.6 | 80.5 | 82.7 | 84.3 | 86.8 | 86.2 | 93.4 | 76.5 | 78.9 | 83.1 | 86.0 | |
| Round 5 | 92.2 | 87.4 | 84.1 | 85.3 | 76.0 | 78.8 | 78.7 | 97.1 | 75.6 | 74.3 | 75.4 | 77.8 | ||
| Round 6 | 88.4 | 89.7 | ||||||||||||
| Round 7 | 96.6 | 85.4 | ||||||||||||
| Round 8 | 90.1 | 78.5 | ||||||||||||
| Round 9 | 76.5 | 73.1 |
| Contact type | Panel 21, Round 1 | Panel 22, Round 1 | Panel 23, Round 1 | Panel 24, Round 1 | Panel 25, Round 1 | Panel 26, Round 1 | Panel 27, Round 1 | Panel 28, Round 1 | Panel 29, Round 1 | Panel 30, Round 1 | ||||||||||||||||||||
|---|---|---|---|---|---|---|---|---|---|---|---|---|---|---|---|---|---|---|---|---|---|---|---|---|---|---|---|---|---|---|
| All RUs | Complete | Partial | All RUs | Complete | Partial | All RUs | Complete | Partial | All RUs | Complete | Partial | All RUs | Complete | Partial | All RUs | Complete | Partial | All RUs | Complete | Partial | All RUs | Complete | Partial | All RUs | Complete | Partial | All RUs | Complete | Partial | |
| N | 9,851 | 7,645 | 2,206 | 9,835 | 7,963 | 1,872 | 9,839 | 7,913 | 1,926 | 9,864 | 8,306 | 1,558 | 9,866 | 8,814 | 1,052 | 9,509 | 8,113 | 1,396 | 9,700 | 8,077 | 1,623 | 10,110 | 8,579 | 1,531 | 10,724 | 8,729 | 1,995 | 8,090 | 6,670 | 1,420 |
| % of all reporting units (RUs) | 100 | 77.6 | 22.4 | 100 | 81.0 | 19.0 | 100 | 80.4 | 19.6 | 100 | 84.2 | 15.8 | 100 | 89.3 | 10.7 | 100 | 85.3 | 14.7 | 100 | 83.3 | 16.7 | 100 | 84.9 | 15.1 | 100 | 81.4 | 18.6 | 100 | 82.4 | 17.6 |
| In-person | 7.0 | 6.9 | 8.3 | 6.3 | 6.1 | 7.3 | 6.2 | 6.0 | 7.2 | 5.5 | 5.4 | 6.3 | 2.6 | 2.5 | 2.6 | 2.4 | 2.3 | 3.1 | 5.6 | 6.1 | 5.7 | 5.5 | 5.3 | 6.7 | 5.2 | 5.1 | 6.1 | 5.4 | 5.2 | 6.6 |
| Telephone | 2.0 | 1.9 | 2.4 | 1.5 | 1.5 | 1.7 | 1.5 | 1.4 | 1.7 | 1.3 | 1.2 | 1.6 | 9.7 | 9.5 | 11.6 | 8.8 | 8.7 | 9.8 | 8.7 | 8.7 | 9.4 | 13.3 | 13.1 | 14.4 | 14.3 | 14.0 | 16.0 | 15.4 | 15.2 | 16.2 |
| CAVI | - | - | - | - | - | - | - | - | - | - | - | - | - | - | - | - | - | - | 10.6 | 10.6 | 11.3 | 8.9 | 8.8 | 9.8 | 11.4 | 11.4 | 11.5 | 7.8 | 7.7 | 8.2 |
| Total | 9.3 | 8.9 | 11.0 | 8.4 | 8.1 | 9.6 | 8.2 | 7.9 | 9.5 | 7.3 | 7.1 | 8.5 | 14.4 | 14.1 | 17.0 | 13.1 | 12.8 | 14.9 | 8.4 | 8.2 | 9.3 | 8.5 | 8.1 | 10.3 | 8.8 | 8.5 | 10.3 | 8.8 | 8.4 | 10.4 |
| Panel/round | Signature method | Authorization forms requested | Authorization forms signed | Signing rate (%) | |
|---|---|---|---|---|---|
| Panel 1 | Round 1 | 3,562 | 2,624 | 73.7 | |
| Round 2 | 19,874 | 14,145 | 71.2 | ||
| Round 3 | 17,722 | 12,062 | 68.1 | ||
| Round 4 | 17,133 | 10,542 | 61.5 | ||
| Round 5 | 12,544 | 6,763 | 53.9 | ||
| Panel 2 | Round 1 | 2,735 | 1,788 | 65.4 | |
| Round 2 | 13,461 | 9,433 | 70.1 | ||
| Round 3 | 11,901 | 7,537 | 63.3 | ||
| Round 4 | 11,164 | 6,485 | 58.1 | ||
| Round 5 | 8,104 | 4,244 | 52.4 | ||
| Panel 3 | Round 1 | 2,078 | 1,349 | 64.9 | |
| Round 2 | 10,335 | 6,463 | 62.5 | ||
| Round 3 | 8,716 | 4,797 | 55.0 | ||
| Round 4 | 8,761 | 4,246 | 48.5 | ||
| Round 5 | 6,913 | 2,911 | 42.1 | ||
| Panel 4 | Round 1 | 2,400 | 1,607 | 67.0 | |
| Round 2 | 12,711 | 8,434 | 66.4 | ||
| Round 3 | 11,078 | 6,642 | 60.0 | ||
| Round 4 | 11,047 | 6,888 | 62.4 | ||
| Round 5 | 8,684 | 5,096 | 58.7 | ||
| Panel 5 | Round 1 | 1,243 | 834 | 67.1 | |
| Round 2 | 14,008 | 9,618 | 68.7 | ||
| Round 3 | 12,869 | 8,301 | 64.5 | ||
| Round 4 | 13,464 | 9,170 | 68.1 | ||
| Round 5 | 10,888 | 7,025 | 64.5 | ||
| Panel 6 | Round 1 | 2,783 | 2,012 | 72.3 | |
| Round 2 | 29,861 | 22,872 | 76.6 | ||
| Round 3 | 26,068 | 18,219 | 69.9 | ||
| Round 4 | 27,146 | 20,082 | 74.0 | ||
| Round 5 | 21,022 | 14,581 | 69.4 | ||
| Panel 7 | Round 1 | 2,298 | 1,723 | 75.0 | |
| Round 2 | 22,302 | 17,557 | 78.7 | ||
| Round 3 | 19,312 | 13,896 | 72.0 | ||
| Round 4 | 16,934 | 13,725 | 81.1 | ||
| Round 5 | 14,577 | 11,099 | 76.1 | ||
| Panel 8 | Round 1 | 2,287 | 1,773 | 77.5 | |
| Round 2 | 22,533 | 17,802 | 79.0 | ||
| Round 3 | 19,530 | 14,064 | 72.0 | ||
| Round 4 | 19,718 | 14,599 | 74.0 | ||
| Round 5 | 15,856 | 11,106 | 70.0 | ||
| Panel 9 | Round 1 | 2,253 | 1,681 | 74.6 | |
| Round 2 | 22,668 | 17,522 | 77.3 | ||
| Round 3 | 19,601 | 13,672 | 69.8 | ||
| Round 4 | 20,147 | 14,527 | 72.1 | ||
| Round 5 | 15,963 | 10,720 | 67.2 | ||
| Panel 10 | Round 1 | 2,068 | 1,443 | 69.8 | |
| Round 2 | 22,582 | 17,090 | 75.7 | ||
| Round 3 | 18,967 | 13,396 | 70.6 | ||
| Round 4 | 19,087 | 13,296 | 69.7 | ||
| Round 5 | 15,787 | 10,476 | 66.4 | ||
| Panel 11 | Round 1 | 2,154 | 1,498 | 69.5 | |
| Round 2 | 23,957 | 17,742 | 74.1 | ||
| Round 3 | 20,756 | 13,400 | 64.6 | ||
| Round 4 | 21,260 | 14,808 | 69.7 | ||
| Round 5 | 16,793 | 11,482 | 68.4 | ||
| Panel 12 | Round 1 | 1,695 | 1,066 | 62.9 | |
| Round 2 | 17,787 | 12,524 | 70.4 | ||
| Round 3 | 15,291 | 10,006 | 65.4 | ||
| Round 4 | 15,692 | 10,717 | 68.3 | ||
| Round 5 | 12,780 | 8,367 | 65.5 | ||
| Panel 13 | Round 1 | 2,217 | 1,603 | 72.3 | |
| Round 2 | 24,357 | 18,566 | 76.2 | ||
| Round 3 | 21,058 | 14,826 | 70.4 | ||
| Round 4 | 21,673 | 15,632 | 72.1 | ||
| Round 5 | 17,158 | 11,779 | 68.7 | ||
| Panel 14 | Round 1 | 2,128 | 1,498 | 70.4 | |
| Round 2 | 23,138 | 17,739 | 76.7 | ||
| Round 3 | 19,024 | 13,673 | 71.9 | ||
| Round 4 | 18,532 | 12,824 | 69.2 | ||
| Round 5 | 15,444 | 10,201 | 66.1 | ||
| Panel 15 | Round 1 | 1,680 | 1,136 | 67.6 | |
| Round 2 | 18,506 | 13,628 | 73.6 | ||
| Round 3 | 16,686 | 11,652 | 69.8 | ||
| Round 4 | 16,260 | 11,139 | 68.5 | ||
| Round 5 | 13,443 | 8,420 | 62.6 | ||
| Panel 16 | Round 1 | 1,811 | 1,223 | 67.5 | |
| Round 2 | 23,718 | 17,566 | 74.1 | ||
| Round 3 | 21,780 | 14,828 | 68.1 | ||
| Round 4 | 21,537 | 16,329 | 75.8 | ||
| Round 5 | 16,688 | 12,028 | 72.1 | ||
| Panel 17 | Round 1 | 1,655 | 1,117 | 67.5 | |
| Round 2 | 21,749 | 17,694 | 81.4 | ||
| Round 3 | 19,292 | 15,125 | 78.4 | ||
| Round 4 | 20,086 | 15,691 | 78.1 | ||
| Round 5 | 15,064 | 11,873 | 78.8 | ||
| Panel 18 | Round 1 | 1,677 | 1,266 | 75.5 | |
| Round 2 | 22,714 | 18,043 | 79.4 | ||
| Round 3 | 20,728 | 15,827 | 76.4 | ||
| Round 4 | 17,092 | 13,704 | 80.2 | ||
| Round 5 | 15,448 | 11,796 | 76.4 | ||
| Panel 19 | Round 1 | 2,189 | 1,480 | 67.6 | |
| Round 2 | 22,671 | 17,190 | 75.8 | ||
| Round 3 | 20,582 | 14,534 | 70.6 | ||
| Round 4 | 17,102 | 13,254 | 77.5 | ||
| Round 5 | 15,330 | 11,425 | 74.5 | ||
| Panel 20 | Round 1 | 2,354 | 1,603 | 68.1 | |
| Round 2 | 25,334 | 18,479 | 72.9 | ||
| Round 3 | 22,851 | 15,862 | 69.4 | ||
| Round 4 | 18,234 | 14,026 | 76.9 | ||
| Round 5 | 16,274 | 12,100 | 74.4 | ||
| Panel 21 | Round 1 | 2,037 | 1,396 | 68.5 | |
| Round 2 | 22,984 | 17,295 | 75.2 | ||
| Round 3 | 20,802 | 14,898 | 71.6 | ||
| Round 4 | 16,487 | 13,110 | 79.5 | ||
| Round 5 | 20,443 | 16,247 | 79.5 | ||
| Panel 22 | Round 1 | 2,274 | 1,573 | 69.2 | |
| Round 2 | 22,913 | 17,530 | 76.5 | ||
| Round 3 | 26,436 | 19,496 | 73.7 | ||
| Round 4 | 23,249 | 18,097 | 77.8 | ||
| Round 5 | 17,171 | 12,168 | 70.9 | ||
| Panel 23 | Round 1 | 1,982 | 1,533 | 77.3 | |
| Round 2 | 29,576 | 21,850 | 73.9 | ||
| Round 3 | 23,365 | 14,475 | 62.4 | ||
| Round 4 | 19,220 | 13,483 | 70.2 | ||
| Round 5 | 17,569 | 10,903 | 62.1 | ||
| Round 6 | 12,701 | 8,002 | 63.0 | ||
| Round 7 | 13,254 | 8,108 | 61.2 | ||
| Round 8 | 11,589 | 7,624 | 65.8 | ||
| Round 9 | eSignature | 597 | 542 | 90.8 | |
| DocuSign | 5,867 | 4,528 | 77.2 | ||
| Paper | 2,601 | 1,172 | 45.1 | ||
| Combined | 9,065 | 6,242 | 68.9 | ||
| Panel 24 | Round 1 | 2,285 | 1,306 | 57.2 | |
| Round 2 | 24,755 | 15,865 | 64.1 | ||
| Round 3 | 22,657 | 11,522 | 50.9 | ||
| Round 4 | 14,612 | 7,716 | 52.8 | ||
| Round 5 | 15,992 | 8,941 | 55.9 | ||
| Round 6 | 11,366 | 6,658 | 58.6 | ||
| Round 7 | eSignature | 860 | 799 | 92.9 | |
| DocuSign | 6,856 | 4,997 | 72.9 | ||
| Paper | 3,032 | 1,254 | 41.4 | ||
| Combined | 10,748 | 7,050 | 65.6 | ||
| Round 8 | eSignature | 1,121 | 1,055 | 94.1 | |
| DocuSign | 4,997 | 3,500 | 70.0 | ||
| Paper | 1,625 | 661 | 40.7 | ||
| Combined | 7,743 | 5,216 | 67.4 | ||
| Round 9 | eSignature | 520 | 497 | 95.6 | |
| DocuSign | 4,718 | 3,171 | 67.2 | ||
| Paper | 1,946 | 733 | 37.7 | ||
| Combined | 7,184 | 4,401 | 61.3 | ||
| Panel 25 | Round 1 | 3,110 | 1,242 | 39.9 | |
| Round 2 | 15,259 | 7,292 | 47.8 | ||
| Round 3 | 15,932 | 8,100 | 50.8 | ||
| Round 4 | 11,252 | 7,204 | 64.0 | ||
| Round 5 | eSignature | 3,796 | 3,570 | 94.0 | |
| DocuSign | 3,336 | 2,339 | 70.1 | ||
| Paper | 1,877 | 431 | 23.0 | ||
| Combined | 9,009 | 6,340 | 70.4 | ||
| Panel 26 | Round 1 | 2,432 | 1,151 | 47.3 | |
| Round 2 | 17,765 | 10,564 | 59.5 | ||
| Round 3 | eSignature | 7,510 | 7,043 | 93.8 | |
| DocuSign | 4,668 | 2,980 | 63.8 | ||
| Paper | 2,964 | 419 | 14.1 | ||
| Combined | 15,142 | 10,442 | 69.0 | ||
| Round 4 | eSignature | 6,494 | 6,295 | 95.4 | |
| DocuSign | 2,544 | 1,420 | 55.8 | ||
| Paper | 1,351 | 184 | 13.6 | ||
| Combined | 10,389 | 7,799 | 75.1 | ||
| Round 5 | eSignature | 946 | 893 | 94.4 | |
| DocuSign | 6,057 | 4,250 | 70.2 | ||
| Paper | 1,827 | 461 | 25.2 | ||
| Combined | 8,830 | 5,604 | 63.5 | ||
| Panel 27 | Round 1 | eSignature | 1,222 | 1,147 | 93.9 |
| DocuSign | 523 | 285 | 54.5 | ||
| Paper | 477 | 39 | 8.2 | ||
| Combined | 2,222 | 1,471 | 66.2 | ||
| Round 2 | eSignature | 10,831 | 10,286 | 95.0 | |
| DocuSign | 4,744 | 2,026 | 42.7 | ||
| Paper | 2,855 | 192 | 6.7 | ||
| Combined | 18,430 | 12,504 | 67.8 | ||
| Round 3 | eSignature | 8,199 | 7,648 | 93.3 | |
| DocuSign | 4,961 | 2,651 | 53..4 | ||
| Paper | 2,941 | 197 | 6..7 | ||
| Combined | 16,101 | 10,496 | 56.2 | ||
| Round 4 | eSignature | 7,345 | 7,120 | 96.9 | |
| DocuSign | 3,378 | 2,296 | 68.0 | ||
| Paper | 1,773 | 197 | 11.1 | ||
| Combined | 12,496 | 9,613 | 76.9 | ||
| Round 5 | eSignature | 2,413 | 2,237 | 92.7 | |
| DocuSign | 5,926 | 4,396 | 74.2 | ||
| Paper | 1,932 | 206 | 10.7 | ||
| Combined | 10,271 | 6,839 | 66.6 | ||
| Panel 28 | Round 1 | eSignature | 1,539 | 1,451 | 94.3 |
| DocuSign | 469 | 241 | 51.4 | ||
| Paper | 609 | 22 | 3.6 | ||
| Combined | 2,617 | 1,714 | 65.5 | ||
| Round 2 | eSignature | 13,940 | 13,318 | 95.5 | |
| DocuSign | 3,794 | 2,015 | 53.1 | ||
| Paper | 3,442 | 135 | 3.9 | ||
| Combined | 21,176 | 15,468 | 73.0 | ||
| Round 3 | eSignature | 10,886 | 10,195 | 93.7 | |
| DocuSign | 4,271 | 2,491 | 58.3 | ||
| Paper | 3,479 | 117 | 3.4 | ||
| Combined | 18,636 | 12,803 | 68.7 | ||
| Round 4 | eSignature | 6,965 | 6,650 | 95.5 | |
| DocuSign | 5,376 | 3,894 | 72.4 | ||
| Paper | 1,875 | 132 | 7.0 | ||
| Combined | 14,216 | 10,676 | 75.1 | ||
| Round 5 | eSignature | 3,707 | 3,522 | 95.0 | |
| DocuSign | 5,989 | 4,357 | 72.8 | ||
| Paper | 2,274 | 140 | 6.2 | ||
| Combined | 11,970 | 8,019 | 67.0 | ||
| Panel 29 | Round 1 | eSignature | 1,489 | 1,422 | 95.5 |
| DocuSign | 490 | 268 | 54.7 | ||
| Paper | 511 | 29 | 5.7 | ||
| Combined | 2,490 | 1,719 | 69.0 | ||
| Round 2 | eSignature | 13,455 | 12,744 | 94.7 | |
| DocuSign | 5,182 | 2,758 | 53.2 | ||
| Paper | 3,473 | 116 | 3.3 | ||
| Combined | 22,110 | 15,618 | 70.6 | ||
| Round 3 | eSignature | 8,097 | 7,662 | 94.6 | |
| DocuSign | 6,822 | 4,391 | 64.4 | ||
| Paper | 3,172 | 100 | 3.2 | ||
| Combined | 18,091 | 12,153 | 67.2 | ||
| Round 4 | eSignature | 6,220 | 6,010 | 96.6 | |
| DocuSign | 5,594 | 4,228 | 75.6 | ||
| Paper | 1,900 | 95 | 5.0 | ||
| Combined | 13,714 | 10,333 | 75.3 | ||
| Panel 30 | Round 1 | eSignature | 773 | 742 | 96.0 |
| DocuSign | 362 | 206 | 56.9 | ||
| Paper | 358 | 16 | 4.5 | ||
| Combined | 1,493 | 964 | 64.6 | ||
| Round 2 | eSignature | 6,337 | 6,061 | 95.6 | |
| DocuSign | 5,676 | 3,481 | 61.3 | ||
| Paper | 2,465 | 104 | 4.2 | ||
| Combined | 14,478 | 9,646 | 66.6 | ||
| Panel/Round | In-person | Telephone | CAVI | |
|---|---|---|---|---|
| Panel 24 | Round 9 | 75.9 | 69.8 | 77.1 |
| Panel 26 | Round 5 | 76.9 | 69.3 | 78.0 |
| Panel 27 | Round 3 | 86.8 | 78.8 | 88.7 |
| Round 4 | 79.3 | 67.4 | 79.6 | |
| Round 5 | 74.4 | 66.1 | 76.5 | |
| Panel 28 | Round 1 | 79.8 | 80.2 | 89.2 |
| Round 2 | 80.2 | 68.5 | 78.1 | |
| Round 3 | 89.3 | 82.7 |
93.1 | |
| Round 4 | 82.3 | 73.9 | 85.3 | |
| Round 5 | 78.2 | 72.4 | 78.0 | |
| Panel 29 | Round 1 | 79.8 | 78.6 | 96.6 |
| Round 2 | 88.6 | 80.4 | 87.9 | |
| Round 3 | 94.2 | 89.1 | 94.0 | |
| Round 4 | 84.4 | 77.5 | 89.5 | |
| Panel 30 | Round 1 | 80.4 | 86.5 | 87.5 |
| Round 2 | 90.1 | 79.9 | 94.6 | |
| Panel/round | Signature method | Permission forms requested | Permission forms signed | Signing rate (%) | |
|---|---|---|---|---|---|
| Panel 1 | Round 3 | 19,913 | 14,468 | 72.7 | |
| Round 5 | 8,685 | 6,002 | 69.1 | ||
| Panel 2 | Round 3 | 12,241 | 8,694 | 71.0 | |
| Round 5 | 8,640 | 6,297 | 72.9 | ||
| Panel 3 | Round 3 | 9,016 | 5,929 | 65.8 | |
| Round 5 | 7,569 | 5,200 | 68.7 | ||
| Panel 4 | Round 3 | 11,856 | 8,280 | 69.8 | |
| Round 5 | 10,688 | 8,318 | 77.8 | ||
| Panel 5 | Round 3 | 9,248 | 6,852 | 74.1 | |
| Round 5 | 8,955 | 7,174 | 80.1 | ||
| Panel 6 | Round 3 | 19,305 | 15,313 | 79.3 | |
| Round 5 | 17,981 | 14,864 | 82.7 | ||
| Panel 7 | Round 3 | 14,456 | 11,611 | 80.3 | |
| Round 5 | 13,428 | 11,210 | 83.5 | ||
| Panel 8 | Round 3 | 14,391 | 11,533 | 80.1 | |
| Round 5 | 13,422 | 11,049 | 82.3 | ||
| Panel 9 | Round 3 | 14,334 | 11,189 | 78.1 | |
| Round 5 | 13,416 | 10,893 | 81.2 | ||
| Panel 10 | Round 3 | 13,928 | 10,706 | 76.9 | |
| Round 5 | 12,869 | 10,260 | 79.7 | ||
| Panel 11 | Round 3 | 14,937 | 11,328 | 75.8 | |
| Round 5 | 13,778 | 11,332 | 82.3 | ||
| Panel 12 | Round 3 | 10,840 | 8,242 | 76.0 | |
| Round 5 | 9,930 | 8,015 | 80.7 | ||
| Panel 13 | Round 3 | 15,379 | 12,165 | 79.1 | |
| Round 4 | 10,782 | 7,795 | 72.3 | ||
| Round 5 | 9,451 | 6,635 | 70.2 | ||
| Panel 14 | Round 2 | 11,841 | 9,151 | 77.3 | |
| Round 3 | 9,686 | 7,091 | 73.2 | ||
| Round 4 | 9,298 | 6,623 | 71.2 | ||
| Round 5 | 8,415 | 6,011 | 71.4 | ||
| Panel 15 | Round 2 | 9,698 | 7,092 | 73.1 | |
| Round 3 | 8,684 | 6,189 | 71.3 | ||
| Round 4 | 8,163 | 5,756 | 70.5 | ||
| Round 5 | 7,302 | 4,485 | 66.9 | ||
| Panel 16 | Round 2 | 12,093 | 8,892 | 73.5 | |
| Round 3 | 10,959 | 7,591 | 69.3 | ||
| Round 4 | 10,432 | 8,194 | 78.6 | ||
| Round 5 | 8,990 | 6,928 | 77.1 | ||
| Panel 17 | Round 2 | 14,181 | 12,567 | 88.6 | |
| Round 3 | 9,715 | 7,580 | 78.0 | ||
| Round 4 | 9,759 | 7,730 | 79.2 | ||
| Round 5 | 8,245 | 6,604 | 80.1 | ||
| Panel 18 | Round 2 | 10,977 | 8,755 | 79.8 | |
| Round 3 | 9,757 | 7,573 | 77.6 | ||
| Round 4 | 8,526 | 6,858 | 80.4 | ||
| Round 5 | 7,918 | 6,173 | 78.0 | ||
| Panel 19 | Round 2 | 10,749 | 8,261 | 76.9 | |
| Round 3 | 9,618 | 6,902 | 71.8 | ||
| Round 4 | 8,557 | 6,579 | 76.9 | ||
| Round 5 | 7,767 | 5,905 | 76.0 | ||
| Panel 20 | Round 2 | 12,074 | 8,796 | 72.9 | |
| Round 3 | 10,577 | 7,432 | 70.3 | ||
| Round 4 | 9,0994 | 6,945 | 76.3 | ||
| Round 5 | 8,312 | 6,339 | 76.3 | ||
| Panel 21 | Round 2 | 10,783 | 7,985 | 74.1 | |
| Round 3 | 9,540 | 6,847 | 71.8 | ||
| Round 4 | 8,172 | 6,387 | 78.2 | ||
| Round 5 | 6,684 | 5,336 | 79.8 | ||
| Panel 22 | Round 2 | 10,510 | 7,919 | 75.4 | |
| Round 3 | 8,053 | 5,953 | 73.9 | ||
| Round 4 | 7,284 | 5,670 | 77.8 | ||
| Round 5 | 8,048 | 5,726 | 71.1 | ||
| Panel 23 | Round 2 | 8,834 | 6,514 | 73.8 | |
| Round 3 | 9,614 | 6,205 | 64.5 | ||
| Round 4 | 8,486 | 5,900 | 69.5 | ||
| Round 5 | 8,067 | 5,101 | 63.2 | ||
| Round 6 | 5,668 | 3,418 | 60.3 | ||
| Round 7 | 5,417 | 3,345 | 61.8 | ||
| Round 8 | 5,182 | 3,341 | 64.5 | ||
| Round 9 | eSignature | 303 | 269 | 88.8 | |
| DocuSign | 2,587 | 1,983 | 76.7 | ||
| Paper | 1,240 | 563 | 45.4 | ||
| Combined | 4,130 | 2,815 | 68.2 | ||
| Panel 24 | Round 2 | 10,265 | 6,676 | 65.0 | |
| Round 3 | 9,096 | 4,831 | 53.1 | ||
| Round 4 | 7,100 | 3,636 | 51.2 | ||
| Round 5 | 6,528 | 3,682 | 56.4 | ||
| Round 6 | 4,783 | 2,663 | 55.7 | ||
| Round 7 | eSignature | 336 | 310 | 92.3 | |
| DocuSign | 2,763 | 2,073 | 75.0 | ||
| Paper | 1,279 | 547 | 42.8 | ||
| Combined | 4,378 | 2,930 | 66.9 | ||
| Round 8 | eSignature | 480 | 449 | 93.5 | |
| DocuSign | 2,238 | 1,527 | 68.2 | ||
| Paper | 798 | 299 | 37.5 | ||
| Combined | 3,516 | 2,275 | 64.7 | ||
| Round 9 | eSignature | 235 | 222 | 94.5 | |
| DocuSign | 2,217 | 1,511 | 68.2 | ||
| Paper | 887 | 345 | 38.9 | ||
| Combined | 3,339 | 2,078 | 62.2 | ||
| Panel 25 | Round 2 | 6,783 | 3,180 | 46.9 | |
| Round 3 | 6,114 | 3,146 | 51.5 | ||
| Round 4 | 4,640 | 2,888 | 62.2 | ||
| Round 5 | eSignature | 1,667 | 1,572 | 94.3 | |
| DocuSign | 1,416 | 983 | 69.4 | ||
| Paper | 787 | 181 | 23.0 | ||
| Combined | 3,870 | 2,736 | 70.7 | ||
| Panel 26 | Round 2 | 6,961 | 4,105 | 59.0 | |
| Round 3 | eSignature | 2,916 | 2,725 | 93.4 | |
| DocuSign | 1,749 | 1,121 | 64.1 | ||
| Paper | 1,156 | 181 | 15.7 | ||
| Combined | 5,821 | 4,027 | 69.2 | ||
| Round 4 | eSignature | 2,848 | 2,710 | 95.2 | |
| DocuSign | 1,212 | 652 | 53.8 | ||
| Paper | 659 | 60 | 9.1 | ||
| Combined | 4,719 | 3,422 | 72.5 | ||
| Round 5 | eSignature | 446 | 422 | 94.6 | |
| DocuSign | 2,853 | 1,945 | 68..2 | ||
| Paper | 933 | 228 | 24.4 | ||
| Combined | 4,232 | 2,595 | 61.3 | ||
| Panel 27 | Round 2 | eSignature | 4,412 | 4,178 | 94.7 |
| DocuSign | 1,972 | 842 | 42.7 | ||
| Paper | 1,272 | 73 | 5.7 | ||
| Combined | 7,656 | 5,093 | 66.5 | ||
| Round 3 | eSignature | 3,420 | 3,215 | 94.0 | |
| DocuSign | 1,973 | 1,028 | 52.1 | ||
| Paper | 1,151 | 66 | 5.7 | ||
| Combined | 6,544 | 4,309 | 65.8 | ||
| Round 4 | eSignature | 3,115 | 3,008 | 96.6 | |
| DocuSign | 1,638 | 1,078 | 65.8 | ||
| Paper | 821 | 68 | 8.3 | ||
| Combined | 5,574 | 4,154 | 74.5 | ||
| Round 5 | eSignature | 1,202 | 1,136 | 94.5 | |
| DocuSign | 2,935 | 2,144 | 73.0 | ||
| Paper | 850 | 95 | 11.2 | ||
| Combined | 4,987 | 3,375 | 67.7 | ||
| Panel 28 | Round 2 | eSignature | 5,716 | 5,445 | 95.3 |
| DocuSign | 1,669 | 853 | 51.1 | ||
| Paper | 1,370 | 34 | 2.5 | ||
| Combined | 8,755 | 6,332 | 72.3 | ||
| Round 3 | eSignature | 4,329 | 4,088 | 94.4 | |
| DocuSign | 1,761 | 1,033 | 58.7 | ||
| Paper | 1,226 | 36 | 2.9 | ||
| Combined | 7,316 | 5,157 | 70.5 | ||
| Round 4 | eSignature | 2,944 | 2,816 | 95.7 | |
| DocuSign | 2,425 | 1,737 | 71.6 | ||
| Paper | 809 | 45 | 5.6 | ||
| Combined | 6,178 | 4,598 | 74.4 | ||
| Round 5 | eSignature | 1,756 | 1,678 | 95.6 | |
| DocuSign | 2,820 | 2,054 | 72.8 | ||
| Paper | 885 | 64 | 7.2 | ||
| Combined | 5,461 | 3,796 | 69.5 | ||
| Panel 29 | Round 2 | eSignature | 5,335 | 5,092 | 95.4 |
| DocuSign | 2,122 | 1,088 | 51.3 | ||
| Paper | 1,309 | 48 | 3.7 | ||
| Combined | 8,766 | 6,228 | 71.0 | ||
| Round 3 | eSignature | 3,152 | 3,017 | 95.7 | |
| DocuSign | 2,803 | 1,819 | 64.9 | ||
| Paper | 1,096 | 48 | 4.4 | ||
| Combined | 7,051 | 4,884 | 69.3 | ||
| Round 4 | eSignature | 2,639 | 2,539 | 96.2 | |
| DocuSign | 2,490 | 1,826 | 73.3 | ||
| Paper | 820 | 45 | 5.5 | ||
| Combined | 5.949 | 4,410 | 74.1 | ||
| Panel 30 | Round 2 | eSignature | 2,542 | 2,439 | 95.9 |
| DocuSign | 2,400 | 1,422 | 59.3 | ||
| Paper | 970 | 32 | 3.3 | ||
| Combined | 5.912 | 3,893 | 65.8 | ||
| Panel/Round | Survey Mode | SAQs requested | SAQs completed | SAQs refused | Other nonresponse | Response rate (%) | |
|---|---|---|---|---|---|---|---|
| Panel 4* | Round 4 | 13,936 | 12,265 | 288 | 1,367 | 87.9 | |
| Round 5 | 1,683 | 947 | 314 | 422 | 56.3 | ||
| Combined, 2000 | 13,936 | 13,212 | - | - | 94.8 | ||
| Panel 5* | Round 2 | 11,239 | 9,833 | 191 | 1,213 | 86.9 | |
| Round 3 | 1,314 | 717 | 180 | 417 | 54.6 | ||
| Combined, 2000 | 11,239 | 10,550 | - | - | 93.9 | ||
| Round 4 | 7,812 | 6,790 | 198 | 824 | 86.9 | ||
| Round 5 | 1,022 | 483 | 182 | 357 | 47.3 | ||
| Combined, 2001 | 7,812 | 7,273 | - | - | 93.1 | ||
| Panel 6 | Round 2 | 16,577 | 14,233 | 412 | 1,932 | 85.9 | |
| Round 3 | 2,143 | 1,213 | 230 | 700 | 56.6 | ||
| Combined, 2001 | 16,577 | 15,446 | - | - | 93.2 | ||
| Round 4 | 15,687 | 13,898 | 362 | 1,427 | 88.6 | ||
| Round 5 | 1,852 | 967 | 377 | 508 | 52.2 | ||
| Combined, 2002 | 15,687 | 14,865 | - | - | 94.8 | ||
| Panel 7 | Round 2 | 12,093 | 10,478 | 196 | 1,419 | 86.6 | |
| Round 3 | 1,559 | 894 | 206 | 459 | 57.3 | ||
| Combined, 2002 | 12,093 | 11,372 | - | - | 94.0 | ||
| Round 4 | 11,703 | 10,125 | 285 | 1,292 | 86.5 | ||
| Round 5 | 1,493 | 786 | 273 | 434 | 52.7 | ||
| Combined, 2003 | 11,703 | 10,911 | - | - | 93.2 | ||
| Panel 8 | Round 2 | 12,533 | 10,765 | 203 | 1,565 | 85.9 | |
| Round 3 | 1,568 | 846 | 234 | 488 | 54.0 | ||
| Combined, 2003 | 12,533 | 11,611 | - | - | 92.6 | ||
| Round 4 | 11,996 | 10,534 | 357 | 1,105 | 87.8 | ||
| Round 5 | 1,400 | 675 | 344 | 381 | 48.2 | ||
| Combined, 2004 | 11,996 | 11,209 | - | - | 93.4 | ||
| Panel 9 | Round 2 | 12,541 | 10,631 | 381 | 1,529 | 84.8 | |
| Round 3 | 1,670 | 886 | 287 | 496 | 53.1 | ||
| Combined, 2004 | 12,541 | 11,517 | - | - | 91.9 | ||
| Round 4 | 11,913 | 10,357 | 379 | 1,177 | 86.9 | ||
| Round 5 | 1,478 | 751 | 324 | 403 | 50.8 | ||
| Combined, 2005 | 11,913 | 11,108 | - | - | 93.2 | ||
| Panel 10 | Round 2 | 12,360 | 10,503 | 391 | 1,466 | 85.0 | |
| Round 3 | 1,626 | 787 | 280 | 559 | 48.4 | ||
| Combined, 2005 | 12,360 | 11,290 | - | - | 91.3 | ||
| Round 4 | 11,726 | 10,081 | 415 | 1,230 | 86.0 | ||
| Round 5 | 1,516 | 696 | 417 | 403 | 45.9 | ||
| Combined, 2006 | 11,726 | 10,777 | - | - | 91.9 | ||
| Panel 11 | Round 2 | 13,146 | 10,924 | 452 | 1,770 | 83.1 | |
| Round 3 | 1,908 | 948 | 349 | 611 | 49.7 | ||
| Combined, 2006 | 13,146 | 11,872 | - | - | 90.3 | ||
| Round 4 | 12,479 | 10,771 | 622 | 1,086 | 86.3 | ||
| Round 5 | 1,621 | 790 | 539 | 292 | 48.7 | ||
| Combined, 2007 | 12,479 | 11,561 | - | - | 92.6 | ||
| Panel 12 | Round 2 | 10,061 | 8,419 | 502 | 1,140 | 83.7 | |
| Round 3 | 1,460 | 711 | 402 | 347 | 48.7 | ||
| Combined, 2007 | 10,061 | 9,130 | - | - | 90.7 | ||
| Round 4 | 9,550 | 8,303 | 577 | 670 | 86.9 | ||
| Round 5 | 1,145 | 541 | 415 | 189 | 47.3 | ||
| Combined, 2008 | 9,550 | 8,844 | - | - | 92.6 | ||
| Panel 13 | Round 2 | 14,410 | 12,541 | 707 | 1,162 | 87.0 | |
| Round 3 | 1,630 | 829 | 439 | 362 | 50.9 | ||
| Combined, 2008 | 14,410 | 13,370 | - | - | 92.8 | ||
| Round 4 | 13,822 | 12,311 | 559 | 952 | 89.1 | ||
| Round 5 | 1,364 | 635 | 476 | 253 | 46.6 | ||
| Combined, 2009 | 13,822 | 12,946 | - | - | 93.7 | ||
| Panel 14 | Round 2 | 13,335 | 11,528 | 616 | 1,191 | 86.5 | |
| Round 3 | 1,542 | 818 | 426 | 298 | 53.1 | ||
| Combined, 2009 | 13,335 | 12,346 | - | - | 92.6 | ||
| Round 4 | 12,527 | 11,041 | 644 | 839 | 88.1 | ||
| Round 5 | 1,403 | 645 | 497 | 261 | 46.0 | ||
| Combined, 2010 | 12,527 | 11,686 | - | - | 93.3 | ||
| Panel 15 | Round 2 | 11,857 | 10,121 | 637 | 1,096 | 85.4 | |
| Round 3 | 1,491 | 725 | 425 | 341 | 48.6 | ||
| Combined, 2010 | 11,857 | 10,846 | - | - | 91.5 | ||
| Round 4 | 11,311 | 9,804 | 572 | 935 | 86.7 | ||
| Round 5 | 1,418 | 678 | 461 | 279 | 47.8 | ||
| Combined, 2011 | 11,311 | 10,482 | - | - | 92.6 | ||
| Panel 16 | Round 2 | 15,026 | 12,926 | 707 | 1393 | 86.0 | |
| Round 3 | 1,863 | 949 | 465 | 449 | 50.9 | ||
| Combined, 2011 | 15,026 | 13,875 | - | - | 92.3 | ||
| Round 4 | 13,620 | 12,415 | 582 | 623 | 91.2 | ||
| Round 5 | 1,112 | 516 | 442 | 154 | 46.4 | ||
| Combined, 2012 | 13,620 | 12,931 | - | - | 94.9 | ||
| Panel 17 | Round 2 | 14,181 | 12,567 | 677 | 937 | 88.6 | |
| Round 3 | 1,395 | 690 | 417 | 288 | 49.5 | ||
| Combined, 2012 | 14,181 | 13,257 | - | - | 93.5 | ||
| Round 4 | 13,086 | 11,566 | 602 | 918 | 88.4 | ||
| Round 5 | 1,429 | 655 | 504 | 270 | 45.8 | ||
| Combined, 2013 | 13,086 | 12,221 | - | - | 93.4 | ||
| Panel 18 | Round 2 | 13,158 | 10,805 | 785 | 1,568 | 82.1 | |
| Round 3 | 2,066 | 1,022 | 547 | 497 | 48.5 | ||
| Combined, 2013 | 13,158 | 11,827 | - | - | 89.9 | ||
| Round 4 | 12,243 | 10,050 | 916 | 1,277 | 82.1 | ||
| Round 5 | 2,063 | 936 | 721 | 406 | 45.4 | ||
| Combined, 2014 | 12,243 | 10,986 | - | - | 89.7 | ||
| Panel 19 | Round 2 | 12,664 | 10,047 | 1,014 | 1,603 | 79.3 | |
| Round 3 | 2,306 | 1,050 | 694 | 615 | 44.5 | ||
| Combined, 2014 | 12,664 | 11,097 | - | - | 87.6 | ||
| Round 4 | 11,782 | 9,542 | 1,047 | 1,175 | 81.0 | ||
| Round 5 | 2,131 | 894 | 822 | 414 | 42.0 | ||
| Combined, 2015 | 11,782 | 10,436 | - | - | 88.6 | ||
| Panel 20 | Round 2 | 14,077 | 10,885 | 1,223 | 1,966 | 77.3 | |
| Round 3 | 2,899 | 1,329 | 921 | 649 | 45.8 | ||
| Combined, 2015 | 14,077 | 12,214 | - | - | 86.8 | ||
| Round 4 | 13,068 | 10,572 | 1,127 | 1,371 | 80.9 | ||
| Round 5 | 2,262 | 1,001 | 891 | 370 | 44.3 | ||
| Combined, 2016 | 13,068 | 11,573 | - | - | 88.6 | ||
| Panel 21 | Round 2 | 13,143 | 10,212 | 1,170 | 1,761 | 77.7 | |
| Round 3 | 2,585 | 1,123 | 893 | 569 | 43.4 | ||
| Combined, 2016 | 13,143 | 11,335 | - | - | 86.2 | ||
| Round 4 | 12,021 | 9,966 | 1,149 | 906 | 82.9 | ||
| Round 5 | 2,078 | 834 | 884 | 360 | 40.1 | ||
| Combined, 2017 | 12,021 | 10,800 | - | - | 89.8 | ||
| Panel 22 | Round 2 | 12,304 | 9,929 | 1,086 | 1,289 | 80.7 | |
| Round 3 | 2,287 | 840 | 749 | 698 | 36.7 | ||
| Combined, 2017 | 12,304 | 10,769 | - | - | 87.5 | ||
| Round 4 | 11,333 | 8,341 | 1,159 | 1,833 | 73.6 | ||
| Round 5 | 2,090 | 811 | 896 | 383 | 38.8 | ||
| Combined, 2018 | 11,333 | 9,152 | - | - | 80.8 | ||
| Panel 23 | Round 2 | 12,349 | 8,711 | 1,364 | 1,289 | 70.5 | |
| Round 3 | 2,364 | 819 | 907 | 638 | 34.6 | ||
| Combined, 2018 | 12,369 | 9,530 | - | - | 77.2 | ||
| Round 4 | 11,290 | 8,554 | 1,515 | 1,221 | 75.8 | ||
| Round 5 | 2,711 | 983 | 923 | 805 | 36.3 | ||
| Combined, 2019 | 11,290 | 9,537 | - | - | 84.5 | ||
| Round 6 | 8,537 | 4,732 | 682 | 3,123 | 55.4 | ||
| Round 7 | 3,229 | 1,123 | 707 | 1,399 | 34.8 | ||
| Combined, 2020 | 8,537 | 5,855 | - | - | 68.6 | ||
| Round 8 | 6,446 | 3,377 | 799 | 2,270 | 52.4 | ||
| Round 9 | 2,654 | 724 | 633 | 1,297 | 27.3 | ||
| Combined, 2021 | 6,446 | 4,101 | - | - | 63.6 | ||
| Panel 24 | Round 2 | 12,027 | 8,726 | 1,641 | 1,660 | 72.6 | |
| Round 3 | 2,810 | 860 | 832 | 1,118 | 30.6 | ||
| Combined, 2019 | 12,027 | 9,586 | - | - | 79.7 | ||
| Round 4 | 9,257 | 4,247 | 786 | 4,224 | 45.9 | ||
| Round 5 | 4,224 | 1,476 | 838 | 1,910 | 34.9 | ||
| Combined, 2020 | 9,257 | 5,723 | - | - | 61.8 | ||
| Round 6 | 6,440 | 3,196 | 819 | 2,425 | 49.6 | ||
| Round 7 | 2,695 | 696 | 628 | 1,371 | 25.8 | ||
| Combined, 2021 | 6.440 | 3,892 | - | - | 60.4 | ||
| Round 8 | 4,906 | 2,347 | 634 | 1,925 | 47.8 | ||
| Round 9 | 2,415 | 413 | 632 | 1,730 | 17.1 | ||
| Combined, 2022 | 4,906 | 2,760 | - | - | 56.2 | ||
| Panel 25 | Round 2 | 8,109 | 3,555 | 529 | 4,025 | 43.8 | |
| Round 3 | 4,016 | 1,322 | 717 | 1,977 | 32.9 | ||
| Combined, 2020 | 8,109 | 4,877 | - | - | 60.1 | ||
| Round 4 | 6,089 | 3,309 | 850 | 1,930 | 54.3 | ||
| Round 5 | 2,325 | 655 | 583 | 1,087 | 28.2 | ||
| Combined, 2021 | 6,089 | 3,964 | - | - | 65.1 | ||
| Panel 26 | Round 2 | 8,419 | 4,609 | 1,009 | 2,801 | 54.7 | |
| Round 3 | 2,950 | 853 | 732 | 1,365 | 28.9 | ||
| Combined, 2021 | 8,419 | 5,462 | - | - | 64.9 | ||
| Round 4 | 6,370 | 3,399 | 898 | 2,073 | 53.4 | ||
| Round 5 | 2,665 | 551 | 720 | 1,394 | 20.7 | ||
| Combined, 2022 | 6,370 | 3.950 | - | - | 62.0 | ||
| Panel 27 | Round 2 | 9,690 | 4,669 | 1,529 | 3,492 | 48.2 | |
| Round 3 | 4,258 | 865 | 1,190 | 2,203 | 20.3 | ||
| Combined, 2022 | 9,690 | 5,534 | - | - | 57.1 | ||
| Round 4 | Web | 5,497 | 2,898 | 21 | 2,578 | 52.7 | |
| Paper | 2,400 | 671 | 1,104 | 625 | 28.0 | ||
| Combined | 7,897 | 3,569 | 1,125 | 3,203 | 45.2 | ||
| Round 5 | Paper | 4,073 | 1,059 | 1,258 | 1,759 | 26.0 | |
| Combined, 2023 | 7,897 | 4,628 | - | - | 58.6 | ||
| Panel 28 | Round 2 | Web | 7,108 | 3,597 | 22 | 3,489 | 50.6 |
| Paper | 3,237 | 890 | 1,530 | 817 | 27.5 | ||
| Combined | 10,345 | 4,487 | 1,552 | 4,306 | 43.4 | ||
| Round 3 | Paper | 4,974 | 1,566 | 1,599 | 1,809 | 31.5 | |
| Combined, 2023 | 10,345 | 6,053 | - | 58.5 | |||
| Round 4 | Web | 5,978 | 3,774 | 2,198 | 63.1 | ||
| Paper | 2,409 | 847 | 373 | 35.2 | |||
| Combined | 8,387 | 4,621 | 2,571 | 55.1 | |||
| Round 5 | Web | 3,420 | 1,330 | 1 | 1,089 | 55.0 | |
| Paper | 1,039 | 133 | 556 | 350 | 12.8 | ||
| Combined | 3,459 | 1,463 | 557 | 1,439 | 42.3 | ||
| Combined, 2024 | 8,387 | 6,084 | 72.5 | ||||
| Panel 29 | Round 2 | Web | 7,116 | 4,252 | 2.863 | 59.8 | |
| Paper | 2,992 | 1,016 | 579 | 34.0 | |||
| Combined | 10,108 | 5,268 | 3,442 | 52.1 | |||
| Round 3 | Web | 2,697 | 1,302 | 7 | 1,388 | 48.3 | |
| Paper | 1,035 | 139 | 495 | 401 | 13.4 | ||
| Combined | 3,732 | 1,441 | 502 | 1,789 | 38.6 | ||
| Combined, 2024 | 10,108 | 6,709 | 66.4 | ||||
| Round 4 | Web | 6,048 | 4,108 | 7 | 1.933 | 67.9 | |
| Paper | 1,627 | 573 | 821 | 233 | 35.2 | ||
| Combined | 7,675 | 4,681 | 828 | 2,166 | 61.0 | ||
| Panel 30 | Round 2 | Web | 5,517 | 3,097 | 8 | 2,412 | 56.1 |
| Paper | 1,717 | 505 | 869 | 343 | 29.4 | ||
| Combined | 7,234 | 3,602 | 877 | 2,755 | 49.8 | ||
Note: Panels 1-3 are not included because modern SAQ collection began in Panel 4.
* Totals represent combined collection of the SAQ and the parent-administered questionnaire (PAQ).
| Panel/Round | DCSs requested | DCSs completed | Response rate (%) | |
|---|---|---|---|---|
| Panel 4 | Round 5 | 696 | 631 | 90.7 |
| Panel 5 | Round 3 | 550 | 508 | 92.4 |
| Round 5 | 570 | 500 | 87.7 | |
| Panel 6 | Round 3 | 1,166 | 1,000 | 85.8 |
| Round 5 | 1,202 | 1,166 | 97.0 | |
| Panel 7 | Round 3 | 870 | 848 | 97.5 |
| Round 5 | 869 | 820 | 94.4 | |
| Panel 8 | Round 3 | 971 | 885 | 91.1 |
| Round 5 | 977 | 894 | 91.5 | |
| Panel 9 | Round 3 | 1,003 | 909 | 90.6 |
| Round 5 | 904 | 806 | 89.2 | |
| Panel 10 | Round 3 | 1,060 | 939 | 88.6 |
| Round 5 | 1,078 | 965 | 89.5 | |
| Panel 11 | Round 3 | 1,188 | 1,030 | 86.7 |
| Round 5 | 1,182 | 1,053 | 89.1 | |
| Panel 12 | Round 3 | 917 | 825 | 90.0 |
| Round 5 | 883 | 815 | 92.3 | |
| Panel 13 | Round 3 | 1,278 | 1,182 | 92.5 |
| Round 5 | 1,278 | 1,154 | 90.3 | |
| Panel 14 | Round 3 | 1,174 | 1,048 | 89.3 |
| Round 5 | 1,177 | 1,066 | 90.6 | |
| Panel 15 | Round 3 | 1,117 | 1,000 | 89.5 |
| Round 5 | 1,097 | 990 | 90.3 | |
| Panel 16 | Round 3 | 1,425 | 1,283 | 90.0 |
| Round 5 | 1,358 | 1,256 | 92.5 | |
| Panel 17 | Round 3 | 1,315 | 1,177 | 89.5 |
| Round 5 | 1,308 | 1,174 | 89.8 | |
| Panel 18 | Round 3 | 1,362 | 1,182 | 86.8 |
| Round 5 | 1,342 | 1,187 | 88.5 | |
| Panel 19 | Round 3 | 1,272 | 1,124 | 88.4 |
| Round 5 | 1,316 | 1,144 | 87.2 | |
| Panel 20 | Round 3 | 1,412 | 1,190 | 84.5 |
| Round 5 | 1,386 | 1,174 | 84.9 | |
| Panel 21 | Round 3 | 1,422 | 1,170 | 82.5 |
| Round 5 | 1,481 | 1,212 | 81.8 | |
| Panel 22 | Round 3 | 1,453 | 1,177 | 81.0 |
| Round 5 | 1,348 | 1,018 | 75.5 | |
| Panel 23 | Round 3 | 1,464 | 1,101 | 75.2 |
| Round 5 | 1,350 | 933 | 69.1 | |
| Round 7 | 1,018 | 648 | 63.7 | |
| Round 9 | 813 | 446 | 54.9 | |
| Panel 24 | Round 3 | 1,350 | 843 | 62.4 |
| Round 5 | 1,082 | 599 | 55.4 | |
| Round 7 | 817 | 443 | 54.2 | |
| Round 9 | 687 | 324 | 47.2 | |
| Panel 25 | Round 3 | 963 | 514 | 53.4 |
| Round 5 | 758 | 419 | 55.3 | |
| Panel 26 | Round 3 | 894 | 516 | 57.7 |
| Round 5 | 746 | 360 | 48.3 | |
| Panel 27 | Round 3 | 1,146 | 523 | 45.6 |
| Round 5 | 982 | 475 | 48.4 | |
| Panel 28 | Round 3 | 1,220 | 629 | 51.6 |
| Round 5 | 1,070 | 523 | 48.9 | |
| Panel 29 | Round 3 | 1,225 | 608 | 49.6 |
Note: Panels 1-3 are not included because DCS collection began in Panel 4.
* Tables represent combined DCS/proxy DCS collection.
| Pharmacy | Total number | Total received | Percentage received | Total complete | Completes as a percentage of total |
|---|---|---|---|---|---|
| 2025 – P28R5 all mail collection | |||||
| Total RUs | 143 | 19 | 13.29 | 14 | 9.79 |
| Total Pairs | 214 | 28 | 13.08 | 24 | 11.21 |
| 2024 – P27R5 all mail collection | |||||
| Total RUs | 229 | 29 | 12.66 | 24 | 10.48 |
| Total Pairs | 335 | 33 | 9.85 | 33 | 9.85 |
| 2023 – P26R5 all mail collection | |||||
| Total RUs | 473 | 68 | 14.38 | 48 | 10.15 |
| Total Pairs | 682 | 86 | 12.61 | 72 | 10.56 |
| 2022 – P25R5 all mail collection | |||||
| Total RUs | 511 | 76 | 14.87 | 58 | 11.35 |
| Total Pairs | 720 | 93 | 12.92 | 80 | 11.11 |
| 2019 – P22R5 all mail collection | |||||
| Total RUs | 921 | 173 | 18.8 | 125 | 13.6 |
| Total Pairs | 1,387 | 199 | 14.3 | 183 | 13.2 |
| 2018 – P21R5 all mail collection | |||||
| Total RUs | 2,920 | 417 | 20.7 | 316 | 15.6 |
| Total Pairs | 4,116 | 486 | 16.6 | 425 | 14.5 |
| 2017 – P20R5 all mail collection | |||||
| Total RUs | 1,953 | 342 | 17.5 | 254 | 13.0 |
| Total Pairs | 2,723 | 372 | 13.7 | 326 | 12.0 |
| 2016 – P19R5 all mail collection | |||||
| Total RUs | 2,038 | 374 | 18.4 | 285 | 14.0 |
| Total Pairs | 2,854 | 430 | 15.1 | 394 | 13.8 |
| 2015 – P18R5 all mail collection | |||||
| Total RUs | 1,404 | 260 | 18.5 | 186 | 13.2 |
| Total Pairs | 2,042 | 289 | 14.2 | 255 | 12.5 |
| 2014 – P17R5 all mail collection | |||||
| Total RUs | 2,230 | 372 | 16.7 | 269 | 12.1 |
| Total Pairs | 3,233 | 443 | 13.7 | 386 | 11.9 |
| 2013 – P16R5 all mail collection | |||||
| Total RUs | 2,014 | 417 | 20.7 | 316 | 15.6 |
| Total Pairs | 2,911 | 486 | 16.6 | 425 | 14.5 |
| 2012 – P15R5 all mail collection | |||||
| Total RUs | 1,390 | 290 | 20.8 | 203 | 14.6 |
| Total Pairs | 1,990 | 348 | 17.4 | 290 | 14.5 |
Note: Patient profile collection was suspended for 2020–2023 due to expansion panels resulting from adjustments for COVID-19. Patient profile information is not readily available prior to 2012.
| Reason for call | Spring 2000 (Panel 5 Round 1, Panel 4 Round 3, Panel 3 Round 5) | Fall 2000 (Panel 5 Round 2, Panel 4 Round 4) | ||||
|---|---|---|---|---|---|---|
| Round 1 | Rounds 3 and 5 | Rounds 2 and 4 | ||||
| N | Percentage | N | Percentage | N | Percentage | |
| Address change | 23 | 4.0 | 13 | 8.3 | 8 | 5.7 |
| Appointment | 37 | 6.5 | 26 | 16.7 | 28 | 19.9 |
| Request callback | 146 | 25.7 | 58 | 37.2 | 69 | 48.9 |
| Refusal | 183 | 32.2 | 20 | 12.8 | 12 | 8.5 |
| Willing to participate | 10 | 1.8 | 2 | 1.3 | 0 | 0.0 |
| Other | 157 | 27.6 | 35 | 22.4 | 8 | 5.7 |
| Report a respondent deceased | 5 | 0.9 | 1 | 0.6 | 0 | 0.0 |
| Request a Spanish-speaking interview | 8 | 1.4 | 1 | 0.6 | 0 | 0.0 |
| Request SAQ help | 0 | 0.0 | 0 | 0.0 | 16 | 11.3 |
| Total | 569 | 156 | 141 | |||
| Reason for call | Spring 2001 (Panel 6 Round 1, Panel 5 Round 3, Panel 4 Round 5) | Fall 2001 (Panel 6 Round 2, Panel 5 Round 4) | ||||
|---|---|---|---|---|---|---|
| Round 1 | Rounds 3 and 5 | Rounds 2 and 4 | ||||
| N | Percentage | N | Percentage | N | Percentage | |
| Address/telephone change | 27 | 3.7 | 17 | 12.7 | 56 | 15.7 |
| Appointment | 119 | 16.2 | 56 | 41.8 | 134 | 37.5 |
| Request callback | 259 | 35.3 | 36 | 26.9 | 92 | 25.8 |
| No message | 8 | 1.1 | 3 | 2.2 | 0 | 0.0 |
| Other | 29 | 4.0 | 7 | 5.2 | 31 | 8.7 |
| Request SAQ help | 0 | 0.0 | 2 | 1.5 | 10 | 2.8 |
| Special needs | 5 | 0.7 | 3 | 2.2 | 0 | 0.0 |
| Refusal | 278 | 37.9 | 10 | 7.5 | 25 | 7.0 |
| Willing to participate | 8 | 1.1 | 0 | 0.0 | 9 | 2.5 |
| Total | 733 | 134 | 357 | |||
| Reason for call | Spring 2002 (Panel 7 Round 1, Panel 6 Round 3, Panel 5 Round 5) | Fall 2002 (Panel 7 Round 2, Panel 6 Round 4) | ||||
|---|---|---|---|---|---|---|
| Round 1 | Rounds 3 and 5 | Rounds 2 and 4 | ||||
| N | Percentage | N | Percentage | N | Percentage | |
| Address/telephone change | 28 | 4.5 | 29 | 13.9 | 66 | 16.7 |
| Appointment | 77 | 12.5 | 71 | 34.1 | 147 | 37.1 |
| Request callback | 210 | 34.0 | 69 | 33.2 | 99 | 25.0 |
| No message | 6 | 1.0 | 3 | 1.4 | 5 | 1.3 |
| Other | 41 | 6.6 | 17 | 8.2 | 10 | 2.5 |
| Request SAQ help | 0 | 0.0 | 0 | 0.0 | 30 | 7.6 |
| Special needs | 1 | 0.2 | 0 | 0.0 | 3 | 0.8 |
| Refusal | 232 | 37.6 | 14 | 6.7 | 29 | 7.3 |
| Willing to participate | 22 | 3.6 | 5 | 2.4 | 7 | 1.8 |
| Total | 617 | 208 | 396 | |||
| Reason for call | Spring 2003 (Panel 8 Round 1, Panel 7 Round 3, Panel 6 Round 5) | Fall 2003 (Panel 8 Round 2, Panel 7 Round 4) | ||||
|---|---|---|---|---|---|---|
| Round 1 | Rounds 3 and 5 | Rounds 2 and 4 | ||||
| N | Percentage | N | Percentage | N | Percentage | |
| Address/telephone change | 20 | 4.2 | 33 | 13.7 | 42 | 17.9 |
| Appointment | 83 | 17.5 | 87 | 36.1 | 79 | 33.8 |
| Request callback | 165 | 34.9 | 100 | 41.5 | 97 | 41.5 |
| No message | 16 | 3.4 | 7 | 2.9 | 6 | 2.6 |
| Other | 9 | 1.9 | 8 | 3.3 | 3 | 1.3 |
| Request SAQ help | 0 | 0.0 | 0 | 0.0 | 1 | 0.4 |
| Special needs | 5 | 1.1 | 0 | 0.0 | 0 | 0.0 |
| Refusal | 158 | 33.4 | 6 | 2.5 | 6 | 2.6 |
| Willing to participate | 17 | 3.6 | 0 | 0.0 | 0 | 0.0 |
| Total | 473 | 241 | 234 | |||
| Reason for call | Spring 2004 (Panel 9 Round 1, Panel 8 Round 3, Panel 7 Round 5) | Fall 2004 (Panel 9 Round 2, Panel 8 Round 4) | ||||
|---|---|---|---|---|---|---|
| Round 1 | Rounds 3 and 5 | Rounds 2 and 4 | ||||
| N | Percentage | N | Percentage | N | Percentage | |
| Address/telephone change | 8 | 1.6 | 26 | 13.2 | 42 | 10.9 |
| Appointment | 67 | 13.3 | 76 | 38.6 | 153 | 39.7 |
| Request callback | 158 | 31.5 | 77 | 39.1 | 139 | 36.1 |
| No message | 9 | 1.8 | 5 | 2.5 | 16 | 4.2 |
| Other | 8 | 1.6 | 5 | 2.5 | 5 | 1.3 |
| Proxy needed | 5 | 1.0 | 2 | 1.0 | 0 | 0.0 |
| Request SAQ help | 0 | 0.0 | 0 | 0.0 | 2 | 0.5 |
| Special needs | 0 | 0.0 | 0 | 0.0 | 0 | 0.0 |
| Refusal | 228 | 45.4 | 6 | 3.0 | 27 | 7.0 |
| Willing to participate | 19 | 3.8 | 0 | 0.0 | 1 | 0.3 |
| Total | 502 | 197 | 385 | |||
| Reason for call | Spring 2005 (Panel 10 Round 1, Panel 9 Round 3, Panel 8 Round 5) | Fall 2005 (Panel 10 Round 2, Panel 9 Round 4) | ||||
|---|---|---|---|---|---|---|
| Round 1 | Rounds 3 and 5 | Rounds 2 and 4 | ||||
| N | Percentage | N | Percentage | N | Percentage | |
| Address/telephone change | 16 | 3.3 | 23 | 8.7 | 27 | 6.8 |
| Appointment | 77 | 15.7 | 117 | 44.3 | 177 | 44.4 |
| Request callback | 154 | 31.4 | 88 | 33.3 | 126 | 31.6 |
| No message | 14 | 2.9 | 11 | 4.2 | 28 | 7.0 |
| Other | 13 | 2.7 | 1 | 0.4 | 8 | 2.0 |
| Proxy needed | 0 | 0.0 | 0 | 0.0 | 0 | 0.0 |
| Request SAQ help | 0 | 0.0 | 0 | 0.0 | 1 | 0.3 |
| Special needs | 1 | 0.2 | 1 | 0.4 | 0 | 0.0 |
| Refusal | 195 | 39.8 | 20 | 7.6 | 30 | 7.5 |
| Willing to participate | 20 | 4.1 | 3 | 1.1 | 2 | 0.5 |
| Total | 490 | 264 | 399 | |||
| Reason for call | Spring 2006 (Panel 11 Round 1, Panel 10 Round 3, Panel 9 Round 5) | Fall 2006 (Panel 11 Round 2, Panel 10 Round 4) | ||||
|---|---|---|---|---|---|---|
| Round 1 | Rounds 3 and 5 | Rounds 2 and 4 | ||||
| N | Percentage | N | Percentage | N | Percentage | |
| Address/telephone change | 7 | 1.3 | 24 | 7.5 | 11 | 4.1 |
| Appointment | 61 | 11.3 | 124 | 39.0 | 103 | 38.1 |
| Request callback | 146 | 27.1 | 96 | 30.2 | 101 | 37.4 |
| No message | 72 | 13.4 | 46 | 14.5 | 21 | 7.8 |
| Other | 16 | 3.0 | 12 | 3.8 | 8 | 3.0 |
| Proxy needed | 0 | 0.0 | 0 | 0.0 | 0 | 0.0 |
| Request SAQ help | 0 | 0.0 | 0 | 0.0 | 0 | 0.0 |
| Special needs | 4 | 0.7 | 0 | 0.0 | 0 | 0.0 |
| Refusal | 216 | 40.1 | 15 | 4.7 | 26 | 9.6 |
| Willing to participate | 17 | 3.2 | 1 | 0.3 | 0 | 0.0 |
| Total | 539 | 318 | 270 | |||
| Reason for call | Spring 2007 (Panel 12 Round 1, Panel 11 Round 3, Panel 10 Round 5) | Fall 2007 (Panel 12 Round 2, Panel 11 Round 4) | ||||
|---|---|---|---|---|---|---|
| Round 1 | Rounds 3 and 5 | Rounds 2 and 4 | ||||
| N | Percentage | N | Percentage | N | Percentage | |
| Address/telephone change | 8 | 2.1 | 21 | 7.3 | 23 | 7.6 |
| Appointment | 56 | 14.6 | 129 | 44.8 | 129 | 42.6 |
| Request callback | 72 | 18.8 | 75 | 26.0 | 88 | 29.0 |
| No message | 56 | 14.6 | 37 | 12.8 | 33 | 10.9 |
| Other | 20 | 5.2 | 15 | 5.2 | 6 | 2.0 |
| Proxy needed | 0 | 0.0 | 0 | 0.0 | 0 | 0.0 |
| Request SAQ help | 0 | 0.0 | 0 | 0.0 | 0 | 0.0 |
| Special needs | 5 | 1.3 | 0 | 0.0 | 1 | 0.3 |
| Refusal | 160 | 41.8 | 10 | 3.5 | 21 | 6.9 |
| Willing to participate | 6 | 1.6 | 1 | 0.3 | 2 | 0.7 |
| Total | 383 | 288 | 303 | |||
| Reason for call | Spring 2008 (Panel 13 Round 1, Panel 12 Round 3, Panel 11 Round 5) | Fall 2008 (Panel 13 Round 2, Panel 12 Round 4) | ||||
|---|---|---|---|---|---|---|
| Round 1 | Rounds 3 and 5 | Rounds 2 and 4 | ||||
| N | Percentage | N | Percentage | N | Percentage | |
| Address/telephone change | 20 | 3.4 | 12 | 4.7 | 21 | 5.7 |
| Appointment | 92 | 15.5 | 117 | 45.9 | 148 | 39.9 |
| Request callback | 164 | 27.6 | 81 | 31.8 | 154 | 41.5 |
| No message | 82 | 13.8 | 20 | 7.8 | 22 | 5.9 |
| Other | 13 | 2.2 | 12 | 4.7 | 8 | 2.2 |
| Proxy needed | 0 | 0.0 | 0 | 0.0 | 0 | 0.0 |
| Request SAQ help | 0 | 0.0 | 0 | 0.0 | 0 | 0.0 |
| Special needs | 4 | 0.7 | 0 | 0.0 | 0 | 0.0 |
| Refusal | 196 | 32.9 | 13 | 5.1 | 18 | 4.9 |
| Willing to participate | 24 | 4.0 | 0 | 0.0 | 0 | 0.0 |
| Total | 595 | 255 | 371 | |||
| Reason for call | Spring 2009 (Panel 14 Round 1, Panel 13 Round 3, Panel 12 Round 5) | Fall 2009 (Panel 14 Round 2, Panel 13 Round 4) | ||||
|---|---|---|---|---|---|---|
| Round 1 | Rounds 3 and 5 | Rounds 2 and 4 | ||||
| N | Percentage | N | Percentage | N | Percentage | |
| Address/telephone change | 10 | 2.2 | 13 | 4.3 | 19 | 5.1 |
| Appointment | 49 | 10.8 | 87 | 29.0 | 153 | 41.1 |
| Request callback | 156 | 34.4 | 157 | 52.3 | 153 | 41.1 |
| No message | 48 | 10.6 | 23 | 7.7 | 20 | 5.4 |
| Other | 3 | 0.7 | 8 | 2.7 | 3 | 0.8 |
| Proxy needed | 0 | 0.0 | 0 | 0.0 | 0 | 0.0 |
| Request SAQ help | 0 | 0.0 | 0 | 0.0 | 0 | 0.0 |
| Special needs | 4 | 0.9 | 0 | 0.0 | 0 | 0.0 |
| Refusal | 183 | 40.3 | 11 | 3.7 | 24 | 6.5 |
| Willing to participate | 1 | 0.2 | 1 | 0.3 | 0 | 0.0 |
| Total | 454 | 300 | 372 | |||
| Reason for call | Spring 2010 (Panel 15 Round 1, Panel 14 Round 3, Panel 13 Round 5) | Fall 2010 (Panel 15 Round 2, Panel 14 Round 4) | ||||
|---|---|---|---|---|---|---|
| Round 1 | Rounds 3 and 5 | Rounds 2 and 4 | ||||
| N | Percentage | N | Percentage | N | Percentage | |
| Address/telephone change | 2 | 0.8 | 42 | 8.2 | 25 | 5.3 |
| Appointment | 44 | 18.0 | 214 | 41.6 | 309 | 66.0 |
| Request callback | 87 | 35.7 | 196 | 38.1 | 46 | 9.8 |
| No message | 17 | 7.0 | 33 | 6.4 | 17 | 3.6 |
| Other | 7 | 2.9 | 8 | 1.6 | 14 | 3.0 |
| Request SAQ help | 0 | 0.0 | 0 | 0.0 | 12 | 2.6 |
| SAQ refusal | 0 | 0.0 | 0 | 0.0 | 1 | 0.2 |
| Special needs | 1 | 0.4 | 1 | 0.2 | 1 | 0.2 |
| Refusal | 86 | 35.2 | 20 | 3.9 | 43 | 9.2 |
| Willing to participate | 0 | 0.0 | 0 | 0.0 | 0 | 0.0 |
| Total | 244 | 514 | 468 | |||
| Reason for call | Spring 2011 (Panel 16 Round 1, Panel 15 Round 3, Panel 14 Round 5) | Fall 2011 (Panel 16 Round 2, Panel 15 Round 4) | ||||
|---|---|---|---|---|---|---|
| Round 1 | Rounds 3 and 5 | Rounds 2 and 4 | ||||
| N | Percentage | N | Percentage | N | Percentage | |
| Address/telephone change | 16 | 3.4 | 46 | 8.0 | 72 | 9.8 |
| Appointment | 175 | 37.6 | 407 | 71.0 | 466 | 63.5 |
| Request callback | 81 | 17.4 | 63 | 11.0 | 69 | 9.4 |
| No message | 24 | 5.2 | 26 | 4.5 | 23 | 3.1 |
| Other | 12 | 2.6 | 8 | 1.4 | 25 | 3.4 |
| Request SAQ help | 1 | 0.2 | 2 | 0.3 | 32 | 4.4 |
| SAQ refusal | 0 | 0.0 | 0 | 0.0 | 46 | 6.3 |
| Special needs | 0 | 0.0 | 0 | 0.0 | 1 | 0.1 |
| Refusal | 157 | 33.7 | 21 | 3.7 | 0 | 0.0 |
| Willing to participate | 0 | 0.0 | 0 | 0 | 0.0 | |
| Total | 466 | 573 | 734 | |||
| Reason for call | Spring 2012 (Panel 17 Round 1, Panel 16 Round 3, Panel 15 Round 5) | Fall 2012 (Panel 17 Round 2, Panel 16 Round 4) | ||||
|---|---|---|---|---|---|---|
| Round 1 | Rounds 3 and 5 | Rounds 2 and 4 | ||||
| N | Percentage | N | Percentage | N | Percentage | |
| Address/telephone change | 18 | 5.0 | 107 | 13.4 | 108 | 12.2 |
| Appointment | 130 | 36.1 | 517 | 64.9 | 584 | 65.8 |
| Request callback | 60 | 16.7 | 94 | 11.8 | 57 | 6.4 |
| No message | 21 | 5.8 | 17 | 2.1 | 18 | 2.0 |
| Other | 10 | 2.8 | 25 | 3.1 | 16 | 1.8 |
| Proxy needed | 0 | 0.0 | 1 | 0.1 | 2 | 0.2 |
| Request SAQ help | 2 | 0.6 | 6 | 0.8 | 42 | 4.7 |
| SAQ refusal | 0 | 0.0 | 0 | 0.0 | 0 | 0.0 |
| Special needs | 1 | 0.3 | 0 | 0.0 | 0 | 0.0 |
| Refusal | 117 | 32.5 | 30 | 3.8 | 60 | 6.8 |
| Willing to participate | 1 | 0.3 | 0 | 0.0 | 0 | 0.0 |
| Total | 360 | 797 | 887 | |||
| Reason for call | Spring 2013 (Panel 18 Round 1, Panel 17 Round 3, Panel 16 Round 5) | Fall 2013 (Panel 18 Round 2, Panel 17 Round 4) | ||||
|---|---|---|---|---|---|---|
| Round 1 | Rounds 3 and 5 | Rounds 2 and 4 | ||||
| N | Percentage | N | Percentage | N | Percentage | |
| Address/telephone change | 18 | 4.4 | 82 | 10.8 | 53 | 9.0 |
| Appointment | 143 | 35.0 | 558 | 73.0 | 370 | 62.6 |
| Request callback | 71 | 17.4 | 88 | 11.5 | 70 | 11.8 |
| No message | 8 | 2.0 | 11 | 1.4 | 16 | 2.8 |
| Other | 2 | 0.5 | 4 | .5 | 5 | 0.9 |
| Proxy needed | 1 | 0.2 | 1 | 0.1 | 1 | 0.2 |
| Request SAQ help | 1 | 0.2 | 0 | 0.0 | 31 | 5.3 |
| SAQ refusal | 0 | 0.0 | 0 | 0.0 | 0 | 0.0 |
| Special needs | 2 | 0.5 | 0 | 0.0 | 2 | 0.3 |
| Refusal | 162 | 39.5 | 19 | 2.5 | 43 | 7.3 |
| Willing to participate | 1 | 0.2 | 1 | 0.1 | 0 | 0.0 |
| Total | 409 | 764 | 591 | |||
| Reason for call | Spring 2014 (Panel 19 Round 1, Panel 18 Round 3, Panel 17 Round 5) | Fall 2014 (Panel 19 Round 2, Panel 18 Round 4) | ||||
|---|---|---|---|---|---|---|
| Round 1 | Rounds 3 and 5 | Rounds 2 and 4 | ||||
| N | Percentage | N | Percentage | N | Percentage | |
| Address/telephone change | 11 | 3.2 | 71 | 11.1 | 62 | 8.4 |
| Appointment | 75 | 22.1 | 393 | 61.5 | 490 | 66.5 |
| Request callback | 70 | 20.6 | 113 | 17.7 | 70 | 9.5 |
| No message | 11 | 3.2 | 12 | 1.9 | 28 | 3.9 |
| Other | 0 | 0.0 | 5 | 0.8 | 7 | 0.9 |
| Proxy needed | 0 | 0.0 | 0 | 0.0 | 1 | 0.1 |
| Request SAQ help | 0 | 0.0 | 1 | 0.2 | 4 | 0.5 |
| SAQ refusal | 0 | 0.0 | 0 | 0.0 | 0 | 0.0 |
| Special needs | 0 | 0.0 | 0 | 0.0 | 0 | 0.0 |
| Refusal | 165 | 48.5 | 44 | 6.9 | 74 | 10.0 |
| Willing to participate | 8 | 2.4 | 0 | 0.0 | 1 | 0.1 |
| Total | 340 | 639 | 737 | |||
| Reason for call | Spring 2015 (Panel 20 Round 1, Panel 19 Round 3, Panel 18 Round 5) | Fall 2015 (Panel 20 Round 2, Panel 19 Round 4) | ||||
|---|---|---|---|---|---|---|
| Round 1 | Rounds 3 and 5 | Rounds 2 and 4 | ||||
| N | Percentage | N | Percentage | N | Percentage | |
| Address/telephone change | 10 | 2.3 | 61 | 8.8 | 55 | 9.6 |
| Appointment | 95 | 21.8 | 438 | 63.4 | 346 | 60.7 |
| Request callback | 85 | 19.5 | 112 | 16.2 | 52 | 9.1 |
| No message | 14 | 3.2 | 17 | 2.5 | 4 | 0.7 |
| Other | 2 | 0.5 | 3 | 0.4 | 3 | 0.5 |
| Proxy needed | 1 | 0.2 | 7 | 1.0 | 8 | 1.4 |
| Request SAQ help | 1 | 0.2 | 3 | 0.4 | 11 | 1.9 |
| SAQ refusal | 0 | 0.0 | 0 | 0.0 | 0 | 0.0 |
| Special needs | 0 | 0.0 | 0 | 0.0 | 0 | 0.0 |
| Refusal | 206 | 47.2 | 47 | 6.8 | 91 | 16.0 |
| Willing to participate | 22 | 5.0 | 3 | 0.4 | 0 | 0.0 |
| Total | 436 | 691 | 570 | |||
| Reason for call | Spring 2016 (Panel 21 Round 1, Panel 20 Round 3, Panel 19 Round 5) | Fall 2016 (Panel 21 Round 2, Panel 20 Round 4) | ||||
|---|---|---|---|---|---|---|
| Round 1 | Rounds 3 and 5 | Rounds 2 and 4 | ||||
| N | Percentage | N | Percentage | N | Percentage | |
| Address/telephone change | 8 | 2.7 | 64 | 11.7 | 48 | 7.9 |
| Appointment | 93 | 30.9 | 362 | 66.2 | 373 | 61.7 |
| Request callback | 47 | 15.6 | 59 | 10.8 | 83 | 13.7 |
| No message | 1 | 0.3 | 7 | 1.3 | 6 | 1.0 |
| Other | 2 | 0.7 | 1 | 0.2 | 3 | 0.5 |
| Proxy needed | 0 | 0.0 | 5 | 0.9 | 6 | 1.0 |
| Request SAQ help | 0 | 0.0 | 3 | 0.5 | 11 | 1.8 |
| SAQ refusal | 0 | 0.0 | 0 | 0.0 | 0 | 0.0 |
| Special needs | 1 | 0.3 | 0 | 0.0 | 0 | 0.0 |
| Refusal | 139 | 46.2 | 46 | 8.4 | 75 | 12.4 |
| Willing to participate | 10 | 3.3 | 0 | 0.0 | 0 | 0.0 |
| Total | 301 | 547 | 605 | |||
| Reason for call | Spring 2017 (Panel 22 Round 1, Panel 21 Round 3, Panel 20 Round 5) | Fall 2017 (Panel 22 Round 2, Panel 21 Round 4) | ||||
|---|---|---|---|---|---|---|
| Round 1 | Rounds 3 and 5 | Rounds 2 and 4 | ||||
| N | Percentage | N | Percentage | N | Percentage | |
| Address/telephone change | 10 | 2.9 | 51 | 9.6 | 35 | 6.8 |
| Appointment | 86 | 24.9 | 355 | 66.6 | 318 | 61.4 |
| Request callback | 59 | 17.1 | 90 | 16.9 | 64 | 12.4 |
| No message | 1 | 0.3 | 2 | 0.4 | 5 | 1.0 |
| Other | 2 | 0.6 | 3 | 0.6 | 4 | 0.8 |
| Proxy needed | 1 | 0.3 | 7 | 1.3 | 5 | 1.0 |
| Request SAQ help | 1 | 0.3 | 0 | 0.0 | 15 | 2.9 |
| SAQ refusal | 0 | 0.0 | 0 | 0.0 | 0 | 0.0 |
| Special needs | 0 | 0.0 | 1 | 0.2 | 1 | 0.2 |
| Refusal | 172 | 49.7 | 23 | 4.3 | 70 | 13.5 |
| Willing to participate | 14 | 4.0 | 1 | 0.2 | 1 | 0.2 |
| Total | 346 | 533 | 518 | |||
| Reason for call | Spring 2018 (Panel 23 Round 1, Panel 22 Round 3, Panel 21 Round 5) | Fall 2018 (Panel 23 Round 2, Panel 22 Round 4) | ||||
|---|---|---|---|---|---|---|
| Round 1 | Rounds 3 and 5 | Rounds 2 and 4 | ||||
| N | Percentage | N | Percentage | N | Percentage | |
| Address/telephone change | 5 | 1.3 | 37 | 7.9 | 38 | 7.3 |
| Appointment | 59 | 15.4 | 318 | 68.1 | 335 | 63.9 |
| Request callback | 50 | 13.1 | 50 | 10.7 | 60 | 11.5 |
| No message | 4 | 1.0 | 5 | 1.1 | 1 | 0.2 |
| Other | 0 | 0.0 | 1 | 0.2 | 3 | 0.6 |
| Proxy needed | 2 | 0.5 | 4 | 0.9 | 6 | 1.1 |
| Request SAQ help | 0 | 0.0 | 1 | 0.2 | 15 | 2.9 |
| SAQ refusal | 0 | 0.0 | 0 | 0.0 | 0 | 0.0 |
| Special needs | 1 | 0.3 | 0 | 0.0 | 0 | 0.0 |
| Refusal | 211 | 55.1 | 46 | 9.9 | 61 | 11.6 |
| Willing to participate | 51 | 13.3 | 5 | 1.1 | 5 | 1.0 |
| Total | 383 | 467 | 524 | |||
| Reason for call | Spring 2019 (Panel 24 Round 1, Panel 23 Round 3, Panel 22 Round 5) | Fall 2019 (Panel 24 Round 2, Panel 23 Round 4) | ||||
|---|---|---|---|---|---|---|
| Round 1 | Rounds 3 and 5 | Rounds 2 and 4 | ||||
| N | Percentage | N | Percentage | N | Percentage | |
| Address/telephone change | 5 | 1.4 | 36 | 7.4 | 30 | 5.6 |
| Appointment | 59 | 16.7 | 328 | 67.5 | 344 | 64.8 |
| Request callback | 39 | 11.0 | 56 | 11.5 | 56 | 10.5 |
| No message | 2 | 0.6 | 4 | 0.8 | 7 | 1.3 |
| Other | 2 | 0.6 | 4 | 0.8 | 0 | 0.0 |
| Proxy needed | 2 | 0.6 | 6 | 1.2 | 11 | 2.1 |
| Request SAQ help | 0 | 0.0 | 2 | 0.4 | 5 | 0.9 |
| SAQ refusal | 0 | 0.0 | 48 | 9.9 | 0 | 0.0 |
| Special needs | 0 | 0.0 | 0 | 0.0 | 0 | 0.0 |
| Refusal | 185 | 532.4 | 0 | 0.0 | 78 | 14.7 |
| Willing to participate | 49 | 13.9 | 2 | 0.4 | 0 | 0.0 |
| Total | 353 | 486 | 531 | |||
| Reason for call | Spring 2020 (Panel 25 Round 1, Panel 24 Round 3, Panel 23 Round 5) | Fall 2020 (Panel 25 Round 2, Panel 24 Round 4, Panel 23 Round 6) | ||||
|---|---|---|---|---|---|---|
| Round 1 | Rounds 3 and 5 | Rounds 2, 4, and 6 | ||||
| N | Percentage | N | Percentage | N | Percentage | |
| Address/telephone change | 5 | 0.9 | 37 | 6.3 | 28 | 2.4 |
| Appointment | 142 | 24.2 | 332 | 56.1 | 278 | 23.9 |
| Request callback | 102 | 17.4 | 121 | 20.4 | 276 | 23.7 |
| No message | 22 | 3.8 | 18 | 3.0 | 60 | 5.2 |
| Other | 2 | 0.3 | 5 | 0.8 | 5 | 0.4 |
| Proxy needed | 6 | 1.0 | 3 | 0.5 | 10 | 0.9 |
| Request SAQ help | 0 | 0.0 | 1 | 0.2 | 35 | 3.0 |
| SAQ refusal | 0 | 0.0 | 0 | 0.0 | 1 | 0.1 |
| Special needs | 0 | 0.0 | 0 | 0.0 | 1 | 0.1 |
| Refusal | 209 | 35.7 | 62 | 10.5 | 203 | 17.5 |
| Willing to participate | 98 | 16.7 | 13 | 2.2 | 266 | 22.9 |
| Total | 586 | 592 | 1,163 | |||
| Reason for call | Spring 2021 (Panel 26 Round 1, Panel 25 Round 3, Panel 24 Round 5, Panel 23 Round 7) | Fall 2021 (Panel 26 Round 2, Panel 25 Round 4, Panel 24 Round 6, Panel 23 Round 8) | ||||
|---|---|---|---|---|---|---|
| Round 1 | Rounds 3, 5, 7 | Rounds 2, 4, 6, 8 | ||||
| N | Percentage | N | Percentage | N | Percentage | |
| Address/telephone change | 2 | 0.6 | 19 | 3.4 | 59 | 7.0 |
| Appointment | 27 | 8.1 | 76 | 13.7 | 233 | 27.5 |
| Request callback | 101 | 30.1 | 240 | 43.2 | 287 | 33.8 |
| No message | 34 | 10.1 | 21 | 3.8 | 41 | 4.8 |
| Other | 8 | 2.4 | 48 | 8.6 | 8 | 0.9 |
| Proxy needed | 0 | 0.0 | 7 | 1.3 | 13 | 1.5 |
| Request SAQ help | 3 | 0.9 | 17 | 3.1 | 15 | 1.8 |
| SAQ refusal | 0 | 0.0 | 1 | 0.2 | 0 | 0.0 |
| Special needs | 0 | 0.0 | 2 | 0.4 | 1 | 0.1 |
| Refusal | 87 | 26.0 | 87 | 15.7 | 176 | 20.8 |
| Willing to participate | 73 | 21.8 | 37 | 6.7 | 15 | 1.8 |
| Total | 335 | 555 | 848 | |||
| Reason for call | Spring 2022 (Panel 27 Round 1, Panel 26 Round 3, Panel 25 Round 5, Panel 24 Round 7, Panel 23 Round 9) | Fall 2022 (Panel 27 Round 2, Panel 26 Round 4, Panel 24 Round 8) | ||||
|---|---|---|---|---|---|---|
| Round 1 | Rounds 3, 5, 7, 9 | Rounds 2, 4, 8 | ||||
| N | Percentage | N | Percentage | N | Percentage | |
| Address/telephone change | 4 | 0.9 | 42 | 5.1 | 25 | 4.3 |
| Appointment | 91 | 21.4 | 215 | 26.3 | 99 | 17.0 |
| Request callback | 130 | 30.5 | 236 | 28.9 | 260 | 44.5 |
| No message | 13 | 3.1 | 23 | 2.8 | 22 | 3.8 |
| Other | 21 | 4.9 | 236 | 28.9 | 84 | 14.4 |
| Proxy needed | 4 | 0.9 | 6 | 0.7 | 6 | 1.0 |
| Request SAQ help | 0 | 0.0 | 0 | 0.0 | 0 | 0.0 |
| SAQ refusal | 0 | 0.0 | 0 | 0.0 | 0 | 0.0 |
| Special needs | 0 | 0.0 | 0 | 0.0 | 0 | 0.0 |
| Refusal | 119 | 27.9 | 58 | 7.1 | 82 | 14.0 |
| Willing to participate | 44 | 10.3 | 2 | 0.2 | 6 | 1.0 |
| Total | 426 | 818 | 584 | |||
| Reason for call | Spring 2023 (Panel 28 Round 1, Panel 27 Round 3, Panel 26 Round 5, Panel 24 Round 9) | Fall 2023 (Panel 28 Round 2, Panel 27 Round 4) | ||||
|---|---|---|---|---|---|---|
| Round 1 | Rounds 3, 5, 9 | Rounds 2 and 4 | ||||
| N | Percentage | N | Percentage | N | Percentage | |
| Address/telephone change | 9 | 2.6 | 27 | 4.7 | 5 | 2.4 |
| Authorization form help | 0 | 0.0 | 0 | 0.0 | 0 | 0.0 |
| Appointment | 45 | 13.0 | 131 | 23.0 | 39 | 18.5 |
| Request callback | 99 | 28.5 | 207 | 36.4 | 49 | 23.2 |
| No message | 8 | 2.3 | 18 | 3.2 | 6 | 2.8 |
| Other | 21 | 6.1 | 129 | 22.7 | 69 | 32.7 |
| Proxy needed | 1 | 0.3 | 3 | 0.5 | 1 | 0.5 |
| Request SAQ help | 0 | 0.0 | 0 | 0.0 | 0 | 0.0 |
| SAQ refusal | 0 | 0.0 | 0 | 0.0 | 0 | 0.0 |
| Special needs | 0 | 0.0 | 0 | 0.0 | 1 | 0.5 |
| Refusal | 88 | 25.4 | 46 | 8.1 | 38 | 18.0 |
| Willing to participate | 76 | 21.9 | 8 | 1.4 | 3 | 1.4 |
| Total | 347 | 569 | 211 | |||
| Reason for call | Spring 2024 (Panel 29 Round 1, Panel 28 Round 3, Panel 27 Round 5 | Fall 2024 (Panel 29 Round 2, Panel 28 Round 4) | ||||
|---|---|---|---|---|---|---|
| Round 1 | Rounds 3 and 5 | Rounds 2 and 4 | ||||
| N | Percentage | N | Percentage | N | Percentage | |
| Address/telephone change | 1 | 0.3 | 12 | 3.1 | 15 | 4.6 |
| Authorization form help | 0 | 0.0 | 0 | 0.0 | 1 | 0.3 |
| Appointment | 57 | 19.4 | 108 | 28.0 | 39 | 11.9 |
| Request callback | 83 | 28.2 | 127 | 32.9 | 115 | 35.2 |
| No message | 11 | 3.7 | 9 | 2.3 | 5 | 1.5 |
| Other | 14 | 4.8 | 96 | 24.9 | 88 | 26.9 |
| Proxy needed | 2 | 0.7 | 1 | 0.3 | 0 | 0.0 |
| Request SAQ help | 0 | 0.0 | 0 | 0.0 | 0 | 0.0 |
| SAQ refusal | 0 | 0.0 | 0 | 0.0 | 0 | 0.0 |
| Special needs | 0 | 0.0 | 0 | 0.0 | 0 | 0.0 |
| Refusal | 93 | 31.6 | 33 | 8.5 | 64 | 19.6 |
| Willing to participate | 33 | 11.2 | 0 | 0.0 | 0 | 0.0 |
| Total | 294 | 386 | 327 | |||
| Reason for call | Spring 2025 (Panel 30 Round 1, Panel 29 Round 3, Panel 28 Round 5 | Fall 2025 (Panel 30 Round 2, Panel 29 Round 4) | ||||
|---|---|---|---|---|---|---|
| Round 1 | Rounds 3 and 5 | Rounds 2 and 4 | ||||
| N | Percentage | N | Percentage | N | Percentage | |
| Address/telephone change | 1 | 0.5 | 6 | 2.3 | 3 | 1.4 |
| Authorization form help | 7 | 3.4 | 69 | 26.3 | 44 | 20.9 |
| Appointment | 32 | 15.8 | 29 | 11.1 | 20 | 9.5 |
| Request callback | 46 | 22.7 | 67 | 25.6 | 45 | 21.3 |
| No message | 3 | 1.5 | 6 | 2.3 | 1 | 0.5 |
| Other | 23 | 11.3 | 47 | 17.9 | 63 | 29.9 |
| Proxy needed | 2 | 1.0 | 1 | 0.4 | 0 | 0.0 |
| Request SAQ help | 0 | 0.0 | 3 | 1.1 | 0 | 0.0 |
| SAQ refusal | 0 | 0.0 | 0 | 0.0 | 0 | 0.0 |
| Special needs | 0 | 0.0 | 0 | 0.0 | 0 | 0.0 |
| Refusal | 65 | 32.0 | 26 | 9.9 | 32 | 15.2 |
| Willing to participate | 24 | 11.8 | 8 | 3.1 | 3 | 1.4 |
| Total | 203 | 262 | 211 | |||