Chartbook #15
State differences in
employer-sponsored health insurance, 2003.
By James M. Branscome, M.S., and Beth Levin
Crimmel, M.S.
The estimates in
this report are based on the most recent data available from MEPS at the
time the report was written. However, selected elements of MEPS data may
be revised on the basis of additional analyses, which could result in
slightly different estimates from those shown here. Please check the
MEPS Web site for the most current data -
www.meps.ahrq.gov.
The mission of AHRQ is to improve the quality, safety,
efficiency, and effectiveness of health care for all Americans by:
- Using evidence to improve health care.
- Improving health care outcomes through research.
- Transforming research into practice.
Suggested citation:
Branscome JM, Crimmel BL. State differences in
employer-sponsored health insurance, 2003. Rockville (MD):Agency for
Healthcare Research and Quality; 2006. MEPS Chartbook No. 15. AHRQ Pub.
No. 06-0030.
Definition of Terms
Establishment— A particular workplace or
location.
Firm— A business entity consisting of one
or more business establishments under common ownership or control. A
firm represents the entire organization, including the company
headquarters and all divisions, subsidiaries, and branches. A firm
may consist of a single-location establishment, in which case the
establishment and firm are identical.
Small firm— A firm with fewer than 50
employees.
Large firm— A firm with 50 or more
employees.
Employee— A person on the actual payroll.
Excludes temporary and contract workers but includes the owner or
manager if that person works at the firm.
Health insurance plan— An insurance plan
that provides hospital and/or physician coverage to an employee in
return for a premium payment.
Offer health insurance—To make available or
contribute to the cost of any health insurance plan for active
employees. Premium greed upon fee paid for coverage of medical
benefits for a defined benefit period, usually a calendar year.
Premiums can be paid by employers or employees, or shared by both.
Single coverage—Health insurance that
covers the employee only.
Family coverage—Health insurance that
covers the employee and the employee's family. If a plan offers more
than one arrangement for family coverage, premium information for a
family of four was reported.
Employee-plus-one coverage—Health insurance
that covers the employee plus one family member at a lower premium
level than family coverage. The family member could be a spouse or a
child. If premiums differ for employee-plus-child and
employee-plus-spouse coverage, information for employee-plus-child
was reported.
Level of significance—The maps show States
as being at or above the national average or below it. States where
the estimates are statistically significantly different from the
national average at the 0.05 level are noted with a star. For this
chartbook, a multiple comparison procedure using the Benjamini-Hochberg
Adjustment was done when simultaneously testing whether each of the
States differs from the national average. Even though a State's
estimate may be significantly different than the national average,
it may not be different than that of other States.
^top
Executive Summary
This report presents variations by State in
employees' access to and enrollment in job-related health insurance
and in the cost of that insurance for 2003. Key findings include:
Access and Enrollment
-
In 34 States, the portion of employees working for
firms that offered health insurance in 2003 did not differ from the
national average of 86.8%. Hawaii and the District of Columbia had
the highest offer rates at over 96%; Montana (73.6%) and Wyoming
(72.1%) had the lowest rates.
-
In every State, more than 90% of employees in
large firms worked where health insurance was offered. There was
much more variation by State in small-firm offer rates.
-
Small-firm eligibility rates were lower than the
U.S. rate in Nevada, South Dakota, and Idaho. Only Nebraska had a
large-firm eligibility rate below the national average.
-
In most States, about 80% or more of eligible
employees were enrolled in employer-sponsored health insurance.
Premiums and Employee Contributions
-
The annual average single premium did not differ
from the national average of $3,481 in 41 States.
-
Thirty-six States had average employee
single-coverage contributions that did not differ from the Nation's
($606) in 2003. Employees in Nebraska paid the most for coverage
($875) and those in Hawaii the least ($251).
-
Eight States had premiums for family coverage that
were greater than the U.S. average ($9,249), with the District of
Columbia the highest ($10,748). Twelve States had below-average
family premiums, with North Dakota the lowest ($7,866).
-
Of all employees of small firms, those working in
Louisiana contributed the most to family coverage ($3,713), while
those working in West Virginia contributed the least ($1,153). For
large firms, employees in Maine contributed the most ($2,853), while
employees in West Virginia contributed the least ($1,630).
^top
Introduction
Job-related coverage is the primary source of health insurance
for most Americans. Many factors influence the availability and cost
of health insurance to workers and their families. These include
employer characteristics such as industry type, the length of time
in business, the number of full- and part-time workers, workers'
salaries, the physical location of the establishment, and the size
of the firm—the last two of which are the focus of this report.
This chartbook presents State estimates from the
2003 Medical Expenditure Panel Survey (MEPS) Insurance Component,
which is sponsored by the Agency for Healthcare Research and Quality
(AHRQ). The chartbook is split into two sections based on key
aspects of State differences in employer-sponsored health insurance.
The first section looks at workers' access to job-related health
insurance and their enrollment rates. The second section examines
State differences in the cost of that insurance, both to the
employer offering coverage and to the worker taking the coverage.
This chartbook and other MEPS publications are
available electronically on the MEPS Web site at
www.meps.ahrq.gov.
^top
Data in This Report
The data in this report come from the private-sector sample of
the Medical Expenditure Panel Survey Insurance Component (MEPS IC),
conducted for the Agency for Healthcare Research and Quality by the
U.S. Census Bureau. The MEPS IC is an annual survey with
approximately 38,000 responding private-sector establishments and
State and local governmental units in 2003. It provides statistics
on employer-sponsored insurance both at the national level and
individually for all 50 States and the District of Columbia (a total
of 51 State-level estimates).
The data shown in this chartbook refer exclusively to the more
than 31,000 responding private-sector establishments that reported
data for 2003. They are drawn from the summary data tables that
appear on the MEPS Web site at
www.meps.ahrq.gov.
In earlier years of the MEPS IC survey, State-level estimates
could not be produced for every State every year due to sample size
considerations resulting from budget constraints. In 2003, for the
first time, State-level estimates were available for all States in
the same year.
State estimates cover employers with workplace locations in that
State and the employees working at those locations.
Some employees may work in one State and reside in another.
For each map in this report, States are classified based on
whether they are at or above the national average or below the
national average. They are shaded accordingly. States where the
estimates are statistically significantly different from the
national average at the 0.05 level are noted with a star. For
statistical purposes, these significance tests are performed on all
51 State-level estimates—50 States and the District of Columbia— At
the same time. (See the definitions section for more detail.)
Unless otherwise noted, only differences that are statistically
significant at the 0.05 level are discussed in the text. When a
State is described as having one of the highest or lowest rates,
this means that it is significantly above or below the national
average, but not necessarily that it is significantly different from
other States. For example, the District of Columbia had the highest
average family premium ($10,748) in 2003. While this is
statistically different from the national average ($9,249), it is
not statistically larger than the average family premiums for a
number of other States, such as Alaska ($10,564), Delaware
($10,499), Maine ($10,308), and New Jersey ($10,168). All
comparisons made in this chartbook are comparing the State estimates
to the national estimate. Unless specifically stated, we did not
make comparisons between States.
Differences in the size of the standard errors for estimates from
one State to the next can result in what may appear to be
inconsistent results. For example, Alaska had the highest average
single premium ($4,011), but this premium is not significantly above
the national average of $3,481 because of the large standard error
for the Alaska estimate ($264). However, Maine, with a smaller
average single premium of $3,852, is significantly above the
national average because it has a smaller standard error ($98) than
Alaska.
The premium data in MEPS do not assume a standardized package of
benefits for all health insurance plans. Because plans offer various
benefits, higher premiums in a State may indicate that the plans in
that State offer more generous benefits. The variations in premiums
by State also may reflect differences in medical costs, enrollment
patterns, State regulations, cost-sharing provisions such as
deductibles and copayments, and insurance plan types.
^top
Section 1: Access and Enrollment
Job-related health insurance plays a critical role in covering
American workers and their families. Most employees work for firms
that offer health insurance.
However, some employees do not. And some employees are not eligible
for health insurance even though their firms offer it, for reasons such
as working a part-time schedule, lack of job tenure, or a preexisting
health condition.
Workers eligible for coverage may choose not to enroll because they
have health insurance through a spouse, their employee contribution is
more that they are willing to pay, or they do not believe they need
coverage.
Access to employer-sponsored health insurance differs by the size of
the firm. In the United States, 71.7% of private-sector employees work
in firms with 50 or more employees. The remaining 28.3% of employees are
in small firms of fewer than 50 workers. In 10 States, the number of
employees working for small firms is higher than the U.S. average:
Alaska, Idaho, Maine, Montana, New Hampshire, North Dakota, South
Dakota, Vermont, Washington, and Wyoming. With the exception of
Washington, these States all have rural populations that make up a
higher percentage of their total population than the U.S. average.
Did offer rates vary by State?
-
In 34 States, the portion of employees working for firms that
offered health insurance in 2003 was not significantly different from
the national average of 86.8%.
-
Nine States had offer rates that were higher than the U.S. total,
with the rate exceeding 96% in both Hawaii and the District of
Columbia.
-
Of the eight States where employees were less likely to work for
firms offering insurance than in the Nation as a whole, Montana
(73.6%) and Wyoming (72.1%) had the lowest rates.
Percent of private-sector employees working
for firms that offer health insurance, 2003
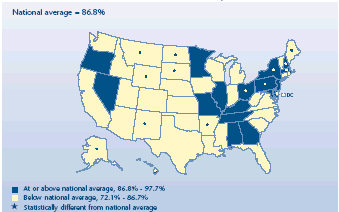
| Percent of private-sector employees working for a firm
that offers health insurance, 2003 |
|
National average = 86.8% |
States |
| At or above national average, 86.8%-97.7% |
New Jersey, Maryland, Nevada, Minnesota, Alabama,
Missouri, Georgia, Oregon, Illinois, Kentucky, Tennessee |
| At or above national average, 86.8%-97.7% and
significantly different from national average |
Hawaii, District of Columbia, Pennsylvania,
Massachusetts, New Hampshire, Delaware, Rhode Island, New York, Ohio |
| Below national average, 72.1%-86.7% |
North Carolina, Connecticut, Michigan, Arizona,
Indiana, Vermont, Virginia, Iowa, Colorado, Kansas, Florida, California,
South Carolina, Texas, Wisconsin, Washington, Louisiana, West Virginia,
Utah, Idaho, Oklahoma, Nebraska, Mississippi |
| Below national average, 72.1%-86.7% and significantly
different from national average |
South Dakota, North Dakota, Arkansas, Alaska, New
Mexico, Maine, Montana, Wyoming |
How did firm size affect offer rates?
-
Overall, nearly all employees of large firms (96.8%) worked where
coverage was offered, compared to only 61.6% of employees of small
firms.
-
The portion of employees in large firms who worked where insurance
was offered did not vary much from State to State: more than 90% in
every State. Ten States had rates above the U.S. average that were
over 98%. No State had a large-firm offer rate that was significantly
lower than the national rate in 2003.
-
There was much more variation by State in small firms' offer
rates. In eight States, about 70% or more of employees in small firms
were offered coverage. The seven States that were below average for
small employers had rates at or below 51%.
Percent of private-sector employees working
for firms that offer health insurance, 2003
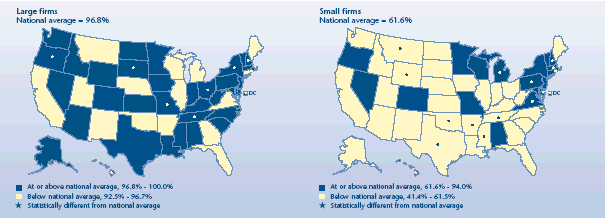
|
Percent of private-sector employees working for a firm that offers health
insurance, 2003 |
| Large firms National average = 96.8% |
States |
| At
or above national average, 96.8%-100.0% |
Delaware, Indiana, Minnesota, North Dakota, Maryland, Pennsylvania,
Kansas, Alaska, West Virginia, New Jersey, Texas, Iowa, South Carolina,
Alabama, Louisiana, Colorado, Washington, Kentucky, North Carolina, Idaho,
Nevada, Wyoming, Massachusetts, Mississippi, Vermont |
| At
or above national average, 96.8%-100.0% and significantly different from
national average |
Rhode Island, New Hampshire, Oregon, District of Columbia, Hawaii, Ohio, South
Dakota, New York, Tennessee, Missouri |
| Below national average, 92.5%-96.7% |
Georgia,
Montana, Oklahoma, Utah, Arizona, Arkansas, Maine, Illinois, California,
Wisconsin, Virginia, Nebraska, Florida, Connecticut, New Mexico, Michigan |
| Below national average, 92.5%-96.7% and significantly different from
national average |
N/A |
|
Percent of private-sector employees working for a firm that offers health
insurance, 2003 |
| Small firms
National average = 61.6% |
States |
| At
or above national average, 61.6%-94.0% |
Connecticut, New Jersey, Vermont, Oregon, Maryland, New York, Minnesota,
Alabama, Wisconsin, Nevada, Missouri, Colorado |
| At
or above national average, 61.6%-94.0% and significantly different from
national average |
Hawaii, District of Columbia, New Hampshire, Massachusetts, Rhode Island,
Pennsylvania, Delaware, Michigan, Virginia |
| Below national average, 41.4%-61.5% |
Illinois,
California, Ohio, Kentucky, Idaho, Louisiana, Washington, Georgia,
Florida, North Carolina, Iowa, Arizona, Kansas, Nebraska, South Carolina,
West Virginia, Indiana, North Dakota, South Dakota, New Mexico, Utah,
Alaska, Maine |
| Below national average, 41.4%-61.5% and significantly different from
national average |
Mississippi, Montana, Tennessee, Oklahoma, Texas, Wyoming, Arkansas |
Did employee eligibility differ for States?
-
During 2003, the percentage of eligible employees was the same in
both small and large firms that offered coverage—78.5%.
-
Small-firm eligibility rates were lower than the U.S. rate in
Nevada (70.3%), South Dakota (68.7%), and Idaho (66.9%). No State had
a small-firm rate that was above average.
-
Compared to the national large-firm average, only Nebraska had a
lower eligibility rate (68.6%). As was the case for small firms, no
State's large-firm rate was greater than the U.S. average.
Percent of private-sector employees
eligible for health insurance at establishments that offer health
insurance, 2003
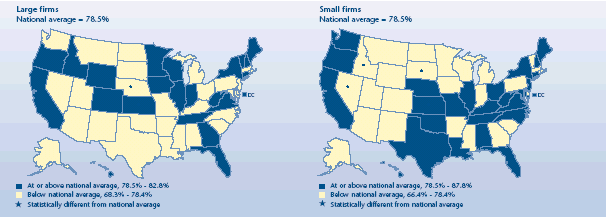
|
Percent of private-sector employees eligible for health insurance at
establishments that offer health insurance, 2003 |
| Large firms
National average = 78.5% |
States |
| At
or above national average, 78.5%-82.8% |
Wyoming, Oregon, Colorado, West Virginia, Florida,
Tennessee, District of Columbia, Indiana, California, Wisconsin, Illinois,
Iowa, Hawaii, Maine, New York, Idaho, Virginia, Georgia, Kansas,
Connecticut, Vermont, New Hampshire, Minnesota |
| At
or above national average, 78.5%-82.8% and significantly different from
national average |
N/A |
| Below national average, 68.3%-78.4% |
South
Carolina, Michigan, North Carolina, Louisiana, Ohio, Maryland, South
Dakota, Rhode Island, Arkansas, Delaware, Kentucky, Mississippi, Arizona,
Nevada, New Jersey, Washington, Texas, Missouri, Pennsylvania, Alabama,
Massachusetts, Oklahoma, New Mexico, North Dakota, Montana, Alaska,
Utah |
| Below national average, 68.3%-78.4% and significantly different from
national average |
Nebraska |
| Percent of private-sector employees eligible for
health insurance at establishments that offer health insurance, 2003 |
| Small firms National average = 78.5% |
States |
| At
or above national average, 78.5%-87.8% |
District of Columbia, Florida, Oklahoma, North Carolina, Texas, Alabama,
New Jersey, Maryland, Hawaii, Connecticut, Oregon, California, Illinois,
Nebraska, Ohio, West Virginia, Washington, Tennessee, Kentucky, Missouri,
Virginia, Maine, Louisiana, New Hampshire, Kansas, New York |
| At
or above national average, 78.5%-87.8% and significantly different from
national average |
N/A |
| Below national average, 66.4%-78.4% |
Delaware, Arizona, South Carolina, Wyoming, Minnesota, Pennsylvania,
Massachusetts, New Mexico, Utah, Indiana, Alaska, Michigan, Wisconsin,
Rhode Island, Vermont, Iowa, Arkansas, North Dakota, Mississippi, Montana, Georgia, Colorado |
| Below national average, 66.4%-78.4% and
significantly different from national average |
Idaho, South Dakota, Nevada |
Were employees in some States more likely to
enroll?
-
About 80% of eligible employees enrolled in an employer-sponsored
health insurance plan in 2003 in the United States as a whole.
Enrollment was at about 80% or more in most States.
-
Four States—Hawaii (86.0%), Alaska (86.0%), Oregon (85.9%), and
South Carolina (83.8%)—had enrollment rates above the national
average.
-
Wisconsin was the sole State with enrollment below the U.S.
average, at 74.5%.
Percent of private-sector employees
eligible for health insurance at establishments that offer health
insurance who are enrolled, 2003
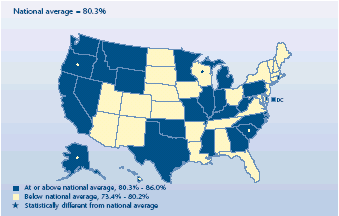
| Percent of private-sector employees eligible for health insurance at
establishments that offer health insurance who are enrolled, 2003 |
|
National average = 80.3% |
States |
| At
or above national average, 80.3%-86.0% |
District of Columbia, Delaware, Wyoming, North Carolina, Idaho,
Montana, Oklahoma, Mississippi, Texas, Michigan, California, West
Virginia, Washington, Nevada, Illinois, Rhode Island, Kentucky, Missouri,
Georgia, Minnesota, Pennsylvania, Indiana |
| At
or above national average, 80.3%-86.0% and significantly different from
national average |
Hawaii, Alaska, Oregon, South Carolina |
| Below national average, 73.4%-80.2% |
Ohio,
New York, Utah, Tennessee, South Dakota, Connecticut, Florida,
Massachusetts, Arizona, North Dakota, Arkansas, New Hampshire, Kansas,
Iowa, Maryland, New Mexico, Virginia, Alabama, New Jersey, Maine,
Nebraska, Louisiana, Colorado, Vermont |
| Below national average, 73.4%-80.2% and significantly different from
national average |
Wisconsin |
How did enrollment vary by firm size?
-
Eligible employees of large firms were more likely to enroll
(81.0%) than eligible employees of small firms (77.3%) during 2003.
-
Only Oregon (87.8%) and Hawaii (86.7%) had enrollment rates for
large firms that were above the U.S. rate. No State's enrollment fell
below the national average for large firms.
-
Washington (84.8%), Hawaii (84.1%), and Idaho (83.5%) had
above-average enrollments for small firms. Only Wisconsin had a
below-average enrollment rate (69.7%) for eligible employees of small
firms.
Percent of private-sector employees
eligible for health insurance at establishments that offer health
insurance who are enrolled, 2003
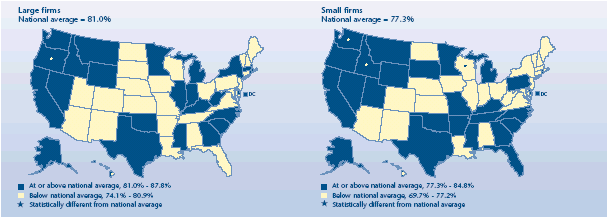
|
Percent of private-sector employees eligible for health insurance at
establishments that offer health insurance who are enrolled, 2003 |
| Large firms
National average = 81.0% |
States |
| At
or above national average, 81.0%-87.8% |
Alaska, Delaware, North Carolina, District of Columbia, Montana, South
Carolina, West Virginia, Wyoming, Oklahoma, Idaho, Illinois, Mississippi,
Texas, California, Michigan, Rhode Island, Kentucky, Georgia,
Massachusetts, Nevada, Minnesota, New York, Washington, Indiana |
| At
or above national average, 81.0%-87.8% and significantly different from
national average |
Oregon, Hawaii |
| Below national average, 74.1%-80.9% |
Pennsylvania, Connecticut, Ohio, New Hampshire, Missouri, Arizona,
Tennessee, North Dakota, Utah, Florida, South Dakota, New Jersey, Kansas,
Arkansas, Iowa, Maryland, Alabama, Maine, New Mexico, Virginia, Nebraska,
Wisconsin, Louisiana, Colorado, Vermont, |
| Below national average, 74.1%-80.9% and significantly different from
national average |
N/A |
|
Percent of private-sector employees eligible for health insurance at
establishments that offer health insurance who are enrolled, 2003 |
| Small firms
National average = 77.3% |
States |
| At
or above national average, 77.3%-84.8% |
Missouri, District of Columbia, Nevada, South Carolina, Wyoming, Montana,
Utah, Oklahoma, Alaska, Michigan, South Dakota, Oregon, Mississippi,
California, Texas, Tennessee, Pennsylvania, Rhode Island, Arkansas,
Delaware, Florida, Kentucky, North Carolina, Minnesota, Georgia |
| At
or above national average, 77.3%-84.8% and significantly different from
national average |
Washington, Hawaii, Idaho |
| Below national average, 69.7%-77.2% |
Indiana, Kansas, North Dakota, Ohio, Colorado, Illinois, Virginia, New
York, New Mexico, Nebraska, West Virginia, Iowa, Louisiana, Connecticut,
Arizona, Maine, Alabama, New Hampshire, Vermont, Maryland, Massachusetts,
New Jersey |
| Below national average, 69.7%-77.2% and significantly different from
national average |
Wisconsin |
^top
Section 2: Premiums and Employee
Contributions
Cost is a key determinant of whether an employer chooses to offer
health insurance to its employees and also of whether employees
choose to enroll in a plan.
The premium and employee contribution for a given health insurance
plan vary by the number of people covered by the policy. In 2003, 47.3
percent of employees who enrolled in health insurance through their
employer took single coverage, 16.5 percent took employee-plus-one
coverage (a plan that covers an employee plus either a spouse or a
child), and 36.2 percent took family coverage (data not shown).
The employee share of the premium, or contribution, can range from $0
to the full premium amount.
Variations in premium costs between States
may reflect differences in many factors, including:
Were there differences among States in premium amounts for single
coverage?
-
In 41 States, the annual average single-coverage premium did not
differ from the national mean of $3,481 in 2003.
-
Four States had single premiums that were above the national
average—Maine ($3,852), West Virginia ($3,809), the District of
Columbia ($3,740), and Rhode Island ($3,725).
-
Single premiums were below the national average in California,
Arizona, Alabama, Arkansas, Hawaii, and North Dakota.
-
The difference between the largest (Alaska) and smallest (North
Dakota) average single premium by State was more than $1,000 per year.
Average total annual premium for
employer-sponsored health insurance, 2003
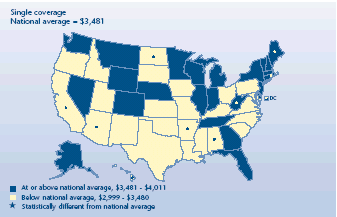
|
Average annual employee contribution for employer-sponsored health
insurance, 2003 |
| Single coverage
National average = $3,481 |
States |
| At
or above national average, $3,481-$4,011 |
Alaska, Delaware, New Jersey, Wisconsin, Wyoming, Illinois, Minnesota,
Connecticut, Michigan, Colorado, Georgia, Tennessee, Vermont, New York,
Florida, Nevada, New Hampshire, Washington, Nebraska, Montana,
Massachusetts, Indiana |
| At
or above national average, $3,481-$4,011 and significantly different from
national average |
Maine, West Virginia, District of Columbia, Rhode Island |
| Below national average, $2,999-$3,480 |
Pennsylvania,
Kentucky, Maryland, Ohio, North Carolina, Kansas, Texas, South Carolina,
Oregon, South Dakota, New Mexico, Utah, Idaho, Virginia, Louisiana,
Missouri, Mississippi, Oklahoma, Iowa |
| Below national average, $2,999-$3,480 and significantly different from
national average |
Arizona, Alabama, Arkansas, Hawaii, North Dakota, California |
How did firm size affect the premium for single coverage plans?
-
For the United States as a whole, small firms paid a higher annual
single-coverage premium ($3,623) than large firms ($3,438). Single
premiums were above the national average for small firms in four
States—New York ($4,103), Maine ($4,093), Florida ($3,967), and
Michigan ($3,944).
-
Single premiums were lower than the national average in small
firms in eight States, with North Dakota the lowest at $2,945.
-
Single premiums for large firms, like those for small firms, did
not vary from the national average in most cases. Among the
exceptions, with large-firm premiums higher than the national average,
were West Virginia, Maine, District of Columbia, Wisconsin, and
Georgia. The States with premiums for large firms below the average
included Oregon, Arizona, Oklahoma, Alabama, Arkansas, North Dakota,
and Hawaii.
Average total annual premium for
employer-sponsored health insurance, 2003
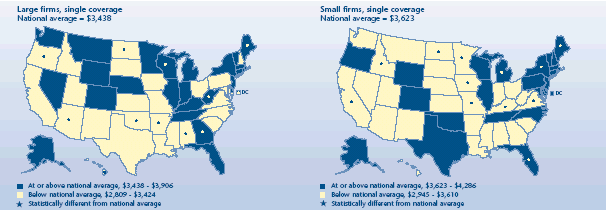
|
Average total annual premium for employer-sponsored health insurance, 2003 |
| Large firms, single coverage
National average = $3,438 |
States |
| At
or above national average, $3,438-$3,906 |
Delaware, Alaska, Minnesota, New Jersey, Wyoming, Illinois, Rhode Island,
Montana, Michigan, Connecticut, Nevada, Colorado, Washington, Tennessee,
Vermont, Indiana, Kentucky, Nebraska, Florida, New York, Massachusetts |
| At
or above national average, $3,438-$3,906 and significantly different
from national average |
West Virginia, Maine, District of Columbia, Wisconsin, Georgia |
| Below national average, $2,809-$3,424 |
New
Hampshire, Ohio, Utah, Idaho, Kansas, Virginia, South Carolina, Missouri,
Maryland, Pennsylvania, Iowa, Texas, California, North Carolina, New
Mexico, South Dakota, Louisiana, Mississippi |
| Below national average, $2,809-$3,424 and significantly different from
national average |
Oregon, Arizona, Oklahoma, Alabama, Arkansas, North Dakota, Hawaii |
|
Average total annual premium for employer-sponsored health
insurance, 2003 |
| Small firms, single coverage,
National average = $3,623 |
States |
| At
or above national average, $3,623-$4,286 |
Alaska, New Jersey, Rhode Island, Connecticut, Wisconsin, Colorado,
District of Columbia, Tennessee, New Hampshire, Pennsylvania, Delaware,
North Carolina, Texas, Oklahoma, Vermont, Maryland, Massachusetts, Oregon,
Wyoming, Illinois |
| At
or above national average, $3,623-$4,286 and significantly different
from national average |
New York, Maine, Florida, Michigan |
| Below national average, $2,945-$3,610 |
Nevada, Nebraska, Mississippi, South Dakota, New Mexico, Kansas, West
Virginia, Indiana, South Carolina, Washington, Hawaii, Louisiana, Ohio,
Arizona, Georgia, Arkansas, Montana, Alabama, Utah |
| Below national average, $2,945-$3,610 and significantly different from
national average |
Kentucky, Virginia, California, Idaho, Missouri, Minnesota, Iowa, North
Dakota |
Did employee contributions for single coverage vary by State?
-
Thirty-six States had an average annual employee contribution for
single coverage that did not vary from the national mean for 2003
($606). This contribution was slightly over 17 percent of the total
average U.S. single-coverage premium.
-
Eight States had contributions greater than the national average,
ranging from $875 for Nebraska to $750 for Florida. Only Rhode Island
had both above-average premiums and above-average contributions.
-
Seven States had below-average contributions, with employees in
Hawaii paying the smallest amount, $251. Both California and Hawaii
had premiums and contributions that fell below the U.S. average.
-
Employees contributed over $600 more toward the average single
premium in the most expensive State than in the least expensive State.
Average annual employee contribution for
employer-sponsored health insurance, 2003
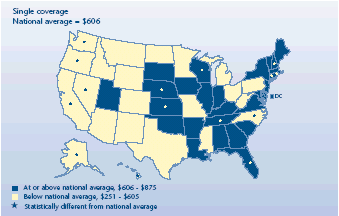
|
Average annual employee contribution for employer-sponsored health
insurance, 2003 |
| Single coverage
National average = $606 |
States |
| At
or above national average, $606-$875 |
Maryland, South Dakota, Indiana, Massachusetts, Delaware, District of
Columbia, Georgia, Maine, Kentucky, Iowa, South Carolina, Vermont,
Arkansas, Utah, Alabama, Virginia, Louisiana, New York, Illinois,
Oklahoma, New Jersey |
| At
or above national average, $606-$875 and significantly different from
national average |
Nebraska, Wisconsin, Rhode Island, Connecticut, Kansas, Tennessee, New
Hampshire, Florida |
| Below national average, $251-$605 |
Minnesota, New
Mexico, Colorado, Ohio, Wyoming, Missouri, North Dakota, Arizona, Texas,
Idaho, Michigan, West Virginia, Pennsylvania, Mississippi, Montana |
| Below national average, $251-$605 and significantly different from
national average |
North
Carolina, California, Nevada, Oregon, Alaska, Washington, Hawaii |
Did firm size affect the employee contribution for single
coverage?
-
On average, employees of small firms enrolled in single coverage
made a lower dollar contribution toward the premium cost ($538) than
their counterparts in large firms ($627). Employees who made no
contribution to their plan cost are included in these averages.
-
Only five States had contributions for single coverage that
differed from the national average for small firms. In New Hampshire
($967) and Connecticut ($855), employee contributions were above
average. California ($327), Washington ($324), and Hawaii ($177)
showed employee contributions that were below the U.S. average.
-
In 2003, more States differed from the U.S. rate in their
contributions by employees in large firms. Nebraska ($905), Rhode
Island ($858), Wisconsin ($822), Kansas ($779), and Florida ($764)
were above the national average for large firms. Nine States reported
contributions for single coverage at large firms that were below the
U.S. total. Hawaii had the lowest amount, $288.
Average annual employee contribution for
employer-sponsored health insurance, 2003
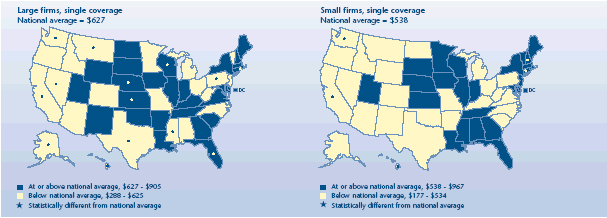
|
Average annual employee contribution for employer-sponsored health
insurance, 2003 |
| Large firms, single coverage
National average = $627 |
States |
| At
or above national average, $627-$905 |
Tennessee, Maryland, South Carolina, Connecticut, Indiana, Massachusetts,
South Dakota, Delaware, District of Columbia, Kentucky, Iowa, Georgia,
Virginia, Maine, New Mexico, Arkansas, Oklahoma, Utah, Illinois, North
Dakota, New Hampshire, Louisiana, Wyoming, New York |
| At
or above national average, $627-$905 and significantly different from
national average |
Nebraska, Rhode Island, Wisconsin, Kansas, Florida |
| Below national average, $288-$625 |
Missouri,
Minnesota, Colorado, Vermont, Idaho, Alabama, Ohio, Arizona, New Jersey,
North Carolina, Michigan, West Virginia, Oregon |
| Below national average, $288-$625 and significantly different from
national average |
Texas, Pennsylvania, California, Alaska, Montana, Nevada, Mississippi,
Washington, Hawaii |
|
Average annual employee contribution for employer-sponsored health
insurance, 2003 |
| Small firms, single coverage
National average = $538 |
States |
| At
or above national average, $538-$967 |
Wisconsin, South Dakota, Maryland, Kansas, Nebraska, Alabama, Rhode
Island, Vermont, Florida, New Jersey, Maine, Mississippi, Indiana,
Georgia, Louisiana, Tennessee, New York, District of Columbia, Delaware,
Massachusetts, Iowa, Utah, Minnesota, Illinois |
| At
or above national average, $538-$967 and significantly different from
national average |
New Hampshire, Connecticut |
| Below national average, $177-$534 |
Ohio,
Oklahoma, Arkansas, Kentucky, Nevada, Pennsylvania, Arizona, West
Virginia, Texas, Montana, Wyoming, Michigan, Virginia, Colorado, North
Carolina, Missouri, Oregon, North Dakota, Idaho, New Mexico, South
Carolina, Alaska |
Below national average,
$177-$534 and significantly different from
national average |
California, Washington, Hawaii |
How did premiums for family plans differ by State?
-
Family premiums did not differ from the national average ($9,249)
in 31 States in 2003.
-
Annual premiums were above the U.S. mean in eight States. Amounts
ranged from $10,748 in the District of Columbia to $9,867 in
Massachusetts.
-
Twelve States had premiums that were lower than average. North
Dakota had the smallest annual premium ($7,866).
-
Family premiums were almost $2,900 higher in the State with the
highest average cost than in the State with the lowest average cost.
Average total annual premium for
employer-sponsored health insurance, 2003
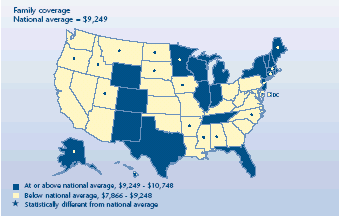
|
Average total annual premium for employer-sponsored health insurance, 2003 |
| Family coverage
National average = $9,249 |
States |
| At
or above national average, $9,249 -$10,748 |
New
Hampshire, Illinois, Wyoming, Texas, Wisconsin, Colorado, Vermont, Rhode
Island, Michigan, New York, Florida, Indiana, New Mexico, Tennessee |
| At
or above national average, $9,249-$10,748 and significantly different from
national average |
District of Columbia, Alaska, Delaware, Maine, New Jersey, Connecticut,
Minnesota, Massachusetts |
| Below national average, $7,866-$9,248 |
Maryland,
Washington, Virginia, West Virginia, Nebraska, Ohio, Pennsylvania,
Kentucky, California, Missouri, Arizona, South Carolina, Kansas, Nevada,
Oklahoma, Louisiana, Georgia |
| Below national average, $7,866-$9,248 and significantly different from
national average |
Oregon, Idaho, Montana, South Dakota, North
Carolina, Iowa, Utah, Mississippi, Alabama, Arkansas, Hawaii, North Dakota |
Were family premiums different for small vs. large firms?
-
Unlike single premiums, average family premium amounts were close
to the national average ($9,249) for both large and small firms.
-
In the majority of States, family premiums for small firms did not
vary from the U.S. average for small firms ($9,321) in 2003. Five
exceptions had higher than average premiums, ranging from the District
of Columbia ($11,380) to Maine ($10,066). Seven States had lower than
average premiums for small firms, ranging from Idah
o ($8,246) to
Iowa
($7,216).
-
In 17 States, family premiums for large firms differed from the
national average ($9,235) for 2003. Alaska ($10,583) had a higher than
average large-firm family premium, along with seven other States.
Hawaii ($7,759) and eight other States had lower than average family
premiums for large firms.
Average total annual premium for
employer-sponsored health insurance, 2003
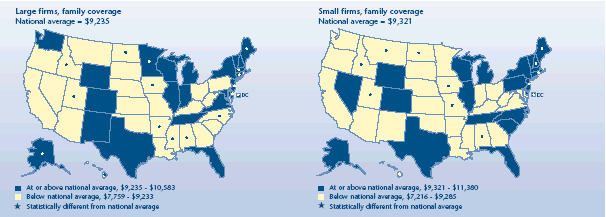
|
Average total annual premium for employer-sponsored health insurance,
2003 |
| Large firms, family coverage
National average = $9,235 |
States |
| At
or above national average, $9,235-$10,583 |
Illinois, New Mexico, Texas, Vermont, Wisconsin, Michigan, Wyoming,
Colorado, Indiana, New Hampshire, Virginia, Washington, Maryland, New
York, Florida, Tennessee |
| At
or above national average, $9,235-$10,583 and significantly different
from national average |
Alaska, District of Columbia, Delaware, Maine, Minnesota, Connecticut, New
Jersey, Massachusetts |
| Below national average, $7,759-$9,233 |
West
Virginia, Ohio, Rhode Island, California, Nebraska, Missouri, Kentucky,
Montana, Kansas, Arizona, Oregon, Pennsylvania, South Carolina, Louisiana,
Oklahoma, Georgia, Nevada, South Dakota |
| Below national average, $7,759-$9,233 and significantly different from
national average |
Iowa, Idaho, Utah, North Carolina, Alabama, North Dakota, Mississippi,
Arkansas, Hawaii |
|
Average total annual premium for employer-sponsored health insurance, 2003 |
| Small firms, family coverage
National average = $9,321 |
States |
| At
or above national average, $9,321-$11,380 |
Alaska, Colorado, Wyoming, Nevada, Delaware, Pennsylvania, Massachusetts,
New York, Connecticut, Wisconsin, Texas, Florida, South Carolina,
Michigan, Illinois, Vermont, North Carolina, Tennessee |
| At
or above national average, $9,321-$11,380 and significantly different
from national average |
District of Columbia, New Hampshire, New Jersey, Rhode Island, Maine |
| Below national average, $7,216-$9,285 |
Minnesota, Arizona, Nebraska, Kentucky, Indiana, Mississippi, Washington,
Oklahoma, Maryland, West Virginia, California, Virginia, Ohio, Oregon,
Kansas, Louisiana, Georgia, Arkansas, South Dakota, Hawaii, New Mexico |
| Below national average, $7,216-$9,285 and significantly different from
national average |
Idaho, Missouri, Utah, North Dakota, Alabama, Montana, Iowa |
Did family plan contributions vary much from the U.S. average?
-
In 45 States, the average annual contribution to family plans was
close to the national average of $2,283 in 2003. This contribution
made up about one-fourth of the total family premium.
-
Maine ($2,872), Florida ($2,810), and Texas ($2,568) were the only
States with higher than average employee contributions. Maine also had
an above-average family premium.
-
Family contributions were below the national mean in three
States—New York ($1,812), Michigan ($1,661), and West Virginia
($1,554).
-
On average, employees in the most expensive State contributed over
$1,300 more to their family premiums than those in the least expensive
State.
Average annual employee contribution for
employer-sponsored health insurance, 2003
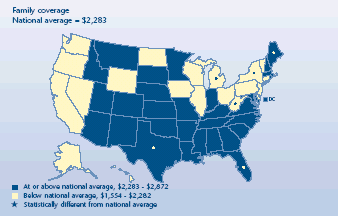
|
Average annual employee contribution for employer-sponsored health
insurance, 2003 |
| Family coverage
National average = $2,283 |
States |
| At
or above national average, $2,283-$2,872 |
Virginia, Maryland, Arizona, Nebraska, South Carolina, Louisiana,
Tennessee, Kansas, Rhode Island, New Mexico, Minnesota, District of
Columbia, New Hampshire, Colorado, Oklahoma, Idaho, Montana,
Massachusetts, North Carolina, Arkansas, Mississippi, Georgia, South
Dakota, Utah, Kentucky, Indiana, Alabama, Missouri |
| At
or above national average, $2,283-$2,872 and significantly different from
national average |
Maine, Florida, Texas |
| Below national average, $1,554-$2,282 |
Connecticut,
California, Wisconsin, Delaware, Illinois, Iowa, Oregon, North Dakota,
Nevada, Washington, Pennsylvania, Hawaii, Vermont, New Jersey, Ohio,
Wyoming, Alaska |
| Below national average, $1,554-$2,282 and significantly different from
national average |
New York,
Michigan, West Virginia |
How did family contributions differ by firm size across States?
-
Across the country during 2003, employees of small firms who had a
family health insurance plan contributed more to their premium
($2,494) than employees of large firms ($2,242).
-
For small firms, just three States—Louisiana ($3,713), Arizona
($3,700), and North Carolina ($3,333)—had contribution amounts above
the national average. Three States—Missouri ($1,710), Montana
($1,487), and West Virginia ($1,153)—had contribution amounts below
the national average.
-
Maine ($2,853), Florida ($2,813), and Texas ($2,530) were the only
States where employee contributions for family coverage in large firms
were above the national average. States with family coverage
contributions below the U.S. average were New Jersey ($1,903), New
York ($1,798), Michigan ($1,657), and West Virginia ($1,630).
Average annual employee contribution for
employer-sponsored health insurance, 2003
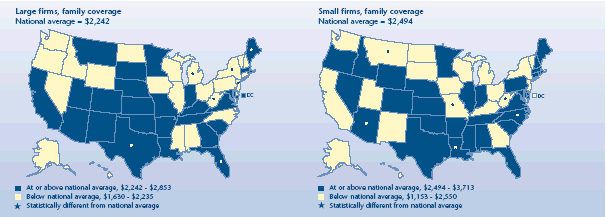
|
Average annual employee contribution for employer-sponsored health
insurance, 2003 |
| Large firms, family coverage
National average = $2,242 |
States |
| At
or above national average, $2,242-$2,853 |
Montana, Nebraska, Maryland, District of Columbia, Virginia, New Mexico,
South Carolina, Arizona, Kansas, Tennessee, Missouri, Oklahoma, Minnesota,
Utah, Massachusetts, Arkansas, Rhode Island, Georgia, Louisiana, South
Dakota, Colorado, Kentucky, California, Indiana |
| At
or above national average, $2,242-$2,853 and significantly different
from national average |
Maine, Florida, Texas |
| Below national average, $1,630-$2,235 |
Alabama, North Carolina, Wisconsin, New Hampshire, Mississippi,
Connecticut, Iowa, Illinois, Delaware, Washington, Idaho, North Dakota,
Oregon, Ohio, Hawaii, Vermont, Nevada, Pennsylvania, Wyoming, Alaska |
| Below national average, $1,630-$2,235 and significantly different from
national average |
New Jersey, New York, Michigan, West Virginia |
|
Average annual employee contribution for employer-sponsored health
insurance, 2003 |
| Small firms, family coverage
National average = $2,494 |
States |
| At
or above national average, $2,494-$3,713 |
Mississippi, Idaho, Rhode Island, Nevada, Colorado, New Hampshire,
Tennessee, Virginia, Delaware, Maryland, Minnesota, Maine, Texas, Florida,
Connecticut, Illinois, Kansas, South Carolina, Pennsylvania, Oklahoma,
Oregon, Arkansas, Wyoming, Nebraska, Alabama, Indiana, Massachusetts |
| At
or above national average, $2,494-$3,713 and significantly different
from national average |
Louisiana, Arizona, North Carolina |
| Below national average, $1,153-$2,550 |
New
Jersey, Wisconsin, Georgia, Iowa, Kentucky, South Dakota, Hawaii, Alaska,
California, Vermont, North Dakota, Utah, New Mexico, New York, Washington,
District of Columbia, Ohio, Michigan |
| Below national average, $1,153-$2,550 and significantly different from
national average |
Missouri, Montana, West Virginia |
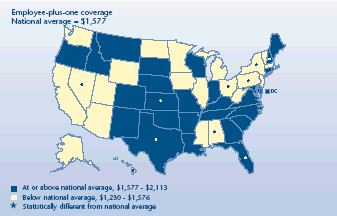
Did employee-plus-one premiums vary by State?
-
Forty States had average employee-plus-one premiums that were not
different from the U.S. mean of $6,647 in 2003.
-
Premiums were above the national average in four States—New
Hampshire ($7,517), Connecticut ($7,507), District of Columbia
($7,442), and New Jersey ($7,380).
-
Employee-plus-one premiums were below the national mean in seven
States, with North Dakota having the smallest premium at $5,657.
-
Employees in the State with the largest average premium had an
annual cost nearly $1,900 more than those in the State with the
smallest average premium.
Average total annual premium for
employer-sponsored health insurance, 2003
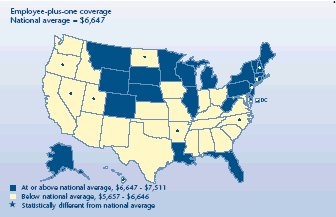
|
Average total annual premium for employer-sponsored health insurance, 2003 |
|
National average = $6,647 |
States |
| At or above national average, $6,647-$7,511 |
Wisconsin, Michigan, Illinois, West Virginia, Vermont, Maine, Wyoming,
Colorado, Minnesota, Louisiana, New York, Pennsylvania, Alaska, Rhode
Island, Delaware, Nebraska, Florida, Massachusetts, South Dakota, Montana |
| At
or above national average, $6,647-$7,511 and significantly different
from national average |
New Hampshire, Connecticut, District of Columbia, New Jersey |
| Below national average, $5,657-$6,646 |
Texas,
Georgia, Ohio, Tennessee, Indiana, Washington, Kansas, Kentucky, Missouri,
Iowa, Maryland, California, New Mexico, Oklahoma, South Carolina,
Virginia, Idaho, Arizona, Mississippi, Alabama |
| Below national average, $5,657-$6,646 and significantly different from
national average |
Oregon, Nevada, Utah, Hawaii, North Carolina,
Arkansas, North Dakota |
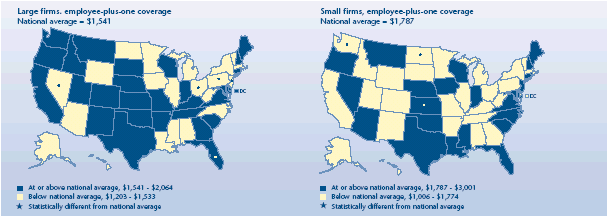
Did employee-plus-one premiums differ for large and small firms?
-
In 2003, small and large firms did not significantly vary from the
U.S. average ($6,647) in the premiums they paid for employee-plus-one
coverage.
-
Several States had small-firm employee-plus-one premiums that were
higher than the national small-firm average. They ranged from Rhode
Island ($8,166) to the District of Columbia ($7,469). Five States—the
lowest being Utah ($5,050)—had employee-plus-one premiums for small
firms that were lower than average.
-
Large firms in Connecticut ($7,511), District of Columbia
($7,437), New Jersey ($7,343), and New Hampshire ($7,326) had higher
premiums than large firms in the Nation overall. Large firms in
Oregon, Nevada, North Carolina, North Dakota, Arkansas, and Hawaii had
lower premiums than the national average.
Average total annual premium for
employer-sponsored health insurance, 2003
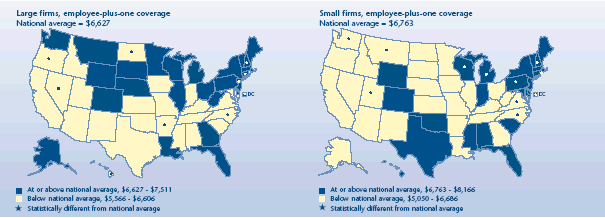
|
Average total annual premium for employer-sponsored health insurance, 2003 |
| Large firms, Employee-plus-one coverage
National average = $6,627 |
States |
| At
or above national average, $6,627-$7,511 |
West
Virginia, Illinois, Montana, Minnesota, Vermont, Maine, Michigan,
Louisiana, Colorado, Wisconsin, Alaska, Wyoming, New York, Delaware,
Nebraska, South Dakota, Pennsylvania, Massachusetts, Washington, Ohio,
Florida, Georgia |
| At
or above national average, $6,627-$7,511 and significantly different
from national average |
Connecticut, District of Columbia, New Jersey, New Hampshire |
| Below national average, $5,566-$6,606 |
Texas, Kentucky, Tennessee, Kansas, Iowa, California, Missouri, Virginia,
Rhode Island, Indiana, New Mexico, Idaho, Maryland, Oklahoma, South
Carolina, Arizona, Alabama, Mississippi, Utah |
| Below national average, $5,566-$6,606 and significantly different from
national average |
Oregon, Nevada, North Carolina, North Dakota, Arkansas, Hawaii |
|
Average total annual premium for employer-sponsored health insurance, 2003 |
| Small firms, Employee-plus-one coverage
National average = $6,763 |
States |
| At
or above national average, $6,763-$8,166 |
New
Jersey, Connecticut, New York, Vermont, Maine, Maryland, Florida, Wyoming,
Indiana, Delaware, Texas, South Carolina, Oklahoma, Massachusetts, Hawaii,
Colorado, Alabama, Mississippi |
| At
or above national average, $6,763 - $8,166 and significantly different
from national average |
Rhode Island, Wisconsin, New Hampshire, Michigan, Pennsylvania, District
of Columbia |
| Below national average, $5,050-$6,686 |
Louisiana, Nebraska, Nevada, New Mexico, South Dakota, Missouri, Alaska,
Tennessee, Oregon, Arizona, Illinois, Georgia, Kansas, Iowa, California,
Ohio, West Virginia, Arkansas, Kentucky, Idaho, Minnesota, North Dakota |
| Below national average, $5,050-$6,686 and significantly different from
national average |
North Carolina, Washington, Montana, Virginia, Utah |
Were there State variations in employee-plus-one contributions?
-
Forty-one States had employee-plus-one contributions at about the
national average ($1,577) in 2003. Employee contributions made up
around 24 percent of the U.S. premium for employee-plus-one coverage.
-
In four States, employee contributions were greater than in the
Nation as a whole: New Hampshire ($2,113), Kansas ($1,971), Florida
($1,970), and Texas ($1,745). New Hampshire was the sole State with
above-average costs for both premiums and contributions.
-
Six States had smaller than average contributions, with
Pennsylvania the lowest at $1,230 annually.
-
Almost $900 separated the average employee cost share for
employee-plus-one plans in the most and least expensive States.
Average annual employee contribution for
employer-sponsored health insurance, 2003
|
Average annual employee contribution for employer-sponsored health
insurance, 2003 |
|
National average = $1,577 |
States |
| At or above national average, $1,577-$2,113 |
Montana, Wisconsin, Maine, Connecticut, South Dakota, Rhode Island, South
Carolina, Tennessee, Nebraska, District of Columbia, Maryland, Oregon,
Indiana, Arkansas, Idaho, Oklahoma, New Mexico, Missouri, Louisiana,
Virginia, Georgia, North Carolina, Kentucky, Colorado, Delaware |
| At
or above national average, $1,577-$2,113 and significantly different from
national average |
New Hampshire, Kansas, Florida, Texas |
| Below national average, $1,230-$1,576 |
California,
Iowa, Vermont, Mississippi, Utah, Minnesota, Arizona, North Dakota,
Massachusetts, New Jersey, Illinois, Washington, Wyoming, Alaska,
Michigan, West Virginia |
| Below national average, $1,230-$1,576 and significantly different from
national average |
Ohio,
Hawaii, Alabama, Nevada, New York, Pennsylvania |
What effect did firm size have on employee-plus-one contributions?
-
Employee contributions for employee-plus-one plans were greater
for workers in small firms ($1,787) than for those in large firms
($1,541) across the Nation during 2003.
-
Kansas ($2,746) was the only State where employee contributions
were higher than the U.S. average for small firms. North Dakota
($1,100) and Washington ($1,006) both had contribution rates lower
than the small-firm average.
-
With an employee-plus-one contribution in large firms of $1,933,
Florida was the only State above the national average. Ohio ($1,295),
New Jersey ($1,254), Pennsylvania ($1,246), and Nevada ($1,203) were
below average.
Average annual employee contribution for
employer-sponsored health insurance, 2003
|
Average annual employee contribution for employer-sponsored health
insurance, 2003 |
| Large firms, Employee-plus-one coverage
National average = $1,541 |
States |
| At
or above national average, $1,541-$2,064 |
Montana, Maine, South Dakota, Connecticut, Wisconsin, District of
Columbia, Kansas, Tennessee, Arkansas, New Mexico, New Hampshire, Texas,
Georgia, South Carolina, Idaho, Nebraska, Maryland, Indiana, Missouri,
Oregon, Oklahoma, Virginia, Kentucky, California, Utah, Colorado,
Washington, Delaware, Rhode Island |
| At
or above national average, $1,541-$2,064 and significantly different
from national average |
Florida |
| Below national average, $1,203-$1,533 |
Louisiana, North Dakota, Vermont, North Carolina, Minnesota, Iowa,
Massachusetts, Mississippi, Illinois, Arizona, Wyoming, Alaska, Michigan,
Alabama, West Virginia, New York, Hawaii |
| Below national average, $1,203-$1,533 and significantly different from
national average |
Ohio, New Jersey, Pennsylvania, Nevada |
|
Average annual employee contribution for employer-sponsored health
insurance, 2003 |
| Small firms, Employee-plus-one coverage
National average = $1,787 |
States |
| At
or above national average, $1,787-$3,001 |
New
Hampshire, Rhode Island, South Carolina, New Jersey, Iowa, Arizona, North
Carolina, Florida, Indiana, Maryland, Wisconsin, Texas, Mississippi,
Nebraska, Oregon, Louisiana, Oklahoma, Maine, Virginia, Nevada,
Connecticut, Montana |
| At
or above national average, $1,787-$3,001 and significantly different
from national average |
Kansas |
| Below national average, $1,006-$1,774 |
Tennessee, South Dakota, Missouri, Minnesota, Colorado, Delaware, Idaho,
Vermont, Kentucky, Illinois, West Virginia, Wyoming, Massachusetts,
Alaska, Hawaii, District of Columbia, California, Michigan, New Mexico,
Arkansas, Georgia, New York, Alabama, Ohio, Utah, Pennsylvania |
| Below national average, $1,006-$1,774 and significantly different from
national average |
North Dakota, Washington |
^top
References
All the data shown in this chartbook (and much
more) are available on the MEPS Web site at www.meps.ahrq.gov. In
addition to the tables, the Web site provides an interactive tool
called MEPSnet that allows users to make queries about trends in
health insurance offered by private establishments and State and
local governments across all available years.
The confidential microdata are accessible for
research purposes through the Census Bureau's Center for Economic
Studies. For additional information, see their Web site at
http://www.ces.census.gov.
The following references were used for the
descriptions and discussion in this report.
Branscome JM, Brown, E. State differences in
job-related health insurance, 1998. Rockville (MD): Agency for
Healthcare Research and Quality; 2001. MEPS Chartbook No. 7. AHRQ
Pub. No. 01-0036.
Branscome JM, Cooper PF, Sommers JP, et al.
Private employer-sponsored health insurance: new estimates by state.
Health Affairs 2000 Jan-Feb;19(1):139-47.
Cohen JW, Monheit AC, Beauregard KM, et al. The
Medical Expenditure Panel Survey: a national health information
resource. Inquiry 1996;33:373-89.
Peterson CL, Vistnes JP. State differences in
job-related health insurance, 1996. Rockville (MD):Agency for
Healthcare Research and Quality; 2000. MEPS Chartbook No. 4. AHRQ
Pub. No. 00-0017.
Sommers JP. List sample design of the 1996 Medical
Expenditure Panel Survey Insurance Component. Rockville (MD):Agency
for Health Care Policy and Research; 1999. MEPS Methodology Report
No. 6. AHCPR Pub. No. 99-0037.
Sommers JP. Construction of weights for the 1996
Medical Expenditure Panel Survey Insurance Component list sample.
Rockville (MD): Agency for Health Care Policy and Research; 1999.
MEPS Methodology Report No. 8. AHCPR Pub. No. 00-0005.
Sommers JP. Imputation of employer information for
the 1996 Medical Expenditure Panel Survey Insurance Component.
Rockville (MD): Agency for Healthcare Research and Quality; 2000.
MEPS Methodology Report No. 10. AHRQ Pub. No. 00-0039.
Sommers JP. Updates to the Medical Expenditure
Panel Survey Insurance Component List Sample Design, 2004. Rockville
(MD):Agency for Healthcare Research and Quality; 2005. MEPS Working
Paper #04008. Web-only publication. Available at:
http://www.meps.ahrq.gov/PrintProducts/PrintProdLookup.asp?ProductType=WPOnline.
^top
Internet
Citation:
Chartbook
# 15: State differences in employer-sponsored health insurance,
2003. May 2006. Agency for
Healthcare Research and Quality, Rockville, MD.
/papers/cb15_06-0030/cb15.htm
|
|
