Source: Medical Expenditure Panel Survey-Insurance Component, private-sector establishments, 2006–2019.
Note: Medical Expenditure Panel Survey-Insurance Component estimates are not available for 2007.
Source: Medical Expenditure Panel Survey-Insurance Component, private-sector establishments, 2006–2019.
Note: Medical Expenditure Panel Survey-Insurance Component estimates are not available for 2007.
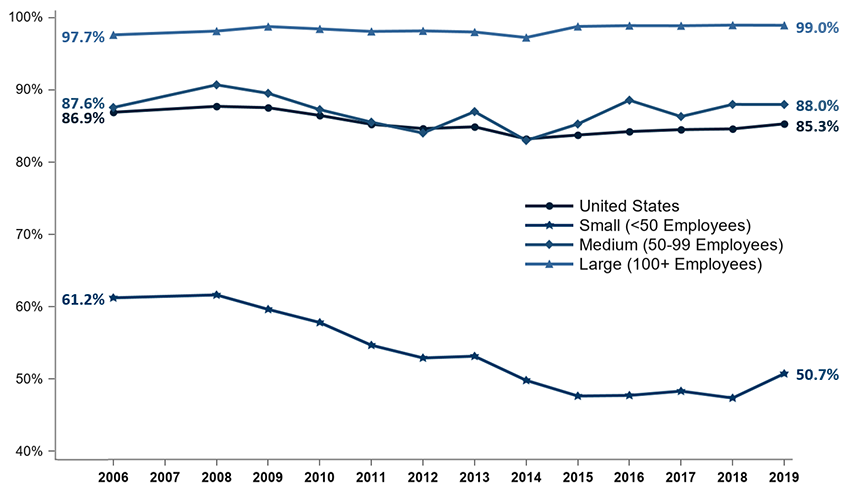
Figure 1. Percentage (standard error) of private-sector employees in establishments that offer health insurance, by firm size, 2006-2019
TABLE SUMMARY TABLE SUMMARY
| Number of Employees | 2006 | 2008 | 2009 | 2010 | 2011 | 2012 | 2013 | 2014 | 2015 | 2016 | 2017 | 2018 | 2019 |
|---|---|---|---|---|---|---|---|---|---|---|---|---|---|
| U.S. | 86.9% | 87.7% | 87.6% | 86.5% | 85.3% | 84.7% | 84.9% | 83.2% | 83.8% | 84.3% | 84.5% | 84.6% | 85.3% |
| (Standard Error) | (0.2%) | (0.3%) | (0.2%) | (0.2%) | (0.2%) | (0.3%) | (0.3%) | (0.3%) | (0.2%) | (0.2%) | (0.2%) | (0.2%) | (0.2%) |
| <50 | 61.2% | 61.6% | 59.6% | 57.8% | 54.7% | 52.9% | 53.1% | 49.8% | 47.6% | 47.7% | 48.3% | 47.3% | 50.7% |
| (Standard Error) | (0.4%) | (0.5%) | (0.5%) | (0.5%) | (0.4%) | (0.6%) | (0.7%) | (0.6%) | (0.6%) | (0.6%) | (0.6%) | (0.6%) | (0.7%) |
| 50–99 | 87.6% | 90.7% | 89.6% | 87.3% | 85.6% | 84.1% | 87.0% | 83.0% | 85.3% | 88.6% | 86.3% | 88.0% | 88.0% |
| (Standard Error) | (1.2%) | (0.9%) | (1.3%) | (0.9%) | (1.0%) | (1.4%) | (1.0%) | (1.3%) | (1.2%) | (1.0%) | (1.2%) | (1.1%) | (1.1%) |
| 100+ | 97.7% | 98.2% | 98.8% | 98.5% | 98.1% | 98.2% | 98.0% | 97.3% | 98.8% | 98.9% | 98.9% | 99.0% | 99.0% |
| (Standard Error) | (0.4%) | (0.3%) | (0.1%) | (0.2%) | (0.2%) | (0.2%) | (0.2%) | (0.2%) | (0.2%) | (0.1%) | (0.2%) | (0.2%) | (0.1%) |
Source: Medical Expenditure Panel Survey-Insurance Component, private-sector establishments, 2006–2019.
Note: Medical Expenditure Panel Survey-Insurance Component estimates are not available for 2007.
Source: Medical Expenditure Panel Survey-Insurance Component, private-sector establishments, 2019.
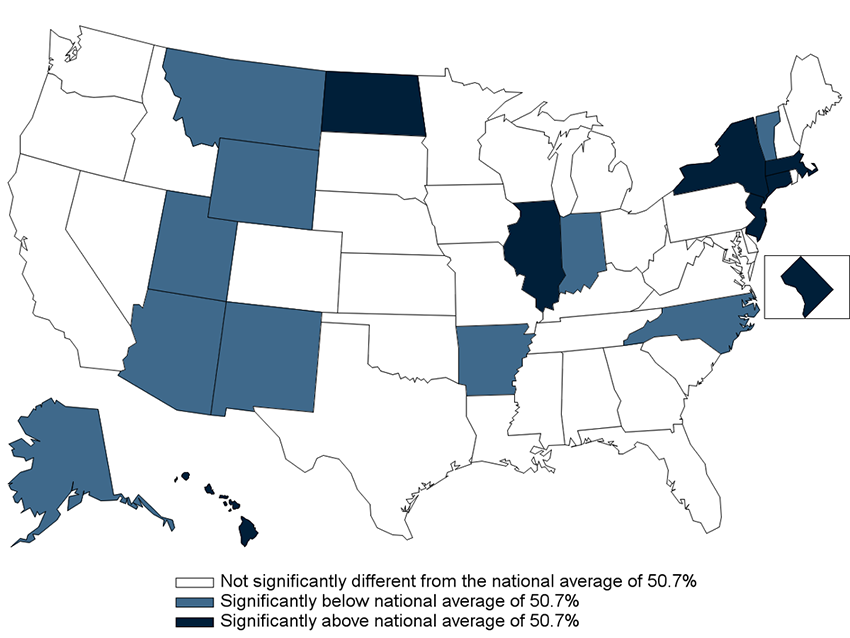
Figure 2. Percentage (standard error) of private-sector employees in establishments that offer health insurance, by State, firm size <50 employees, 2019
TABLE SUMMARY TABLE SUMMARY
| Alabama | 56.3% | Kentucky | 49.9% | North Dakota | 59.6%* |
| (Standard Error) | (4.0%) | (Standard Error) | (4.6%) | (Standard Error) | (3.5%) |
| Alaska | 36.0%* | Louisiana | 49.4% | Ohio | 50.3% |
| (Standard Error) | (4.1%) | (Standard Error) | (4.1%) | (Standard Error) | (4.6%) |
| Arizona | 41.4%* | Maine | 47.9% | Oklahoma | 52.2% |
| (Standard Error) | (4.6%) | (Standard Error) | (3.7%) | (Standard Error) | (3.9%) |
| Arkansas | 40.9%* | Maryland | 54.2% | Oregon | 49.1% |
| (Standard Error) | (4.4%) | (Standard Error) | (4.4%) | (Standard Error) | (3.6%) |
| California | 48.2% | Massachusetts | 65.8%* | Pennsylvania | 56.5% |
| (Standard Error) | (2.7%) | (Standard Error) | (4.7%) | (Standard Error) | (3.4%) |
| Colorado | 46.3% | Michigan | 49.5% | Rhode Island | 58.3% |
| (Standard Error) | (4.4%) | (Standard Error) | (4.1%) | (Standard Error) | (4.2%) |
| Connecticut | 61.0%* | Minnesota | 52.0% | South Carolina | 52.6% |
| (Standard Error) | (4.1%) | (Standard Error) | (4.3%) | (Standard Error) | (4.3%) |
| Delaware | 55.7% | Mississippi | 43.9% | South Dakota | 54.7% |
| (Standard Error) | (4.8%) | (Standard Error) | (4.8%) | (Standard Error) | (3.8%) |
| District of Columbia | 68.5%* | Missouri | 53.2% | Tennessee | 45.5% |
| (Standard Error) | (4.5%) | (Standard Error) | (4.1%) | (Standard Error) | (4.4%) |
| Florida | 44.6% | Montana | 41.2%* | Texas | 50.2% |
| (Standard Error) | (3.9%) | (Standard Error) | (3.6%) | (Standard Error) | (2.9%) |
| Georgia | 41.2% | Nebraska | 43.4% | Utah | 40.6%* |
| (Standard Error) | (4.9%) | (Standard Error) | (4.1%) | (Standard Error) | (4.0%) |
| Hawaii | 90.0%* | Nevada | 53.2% | Vermont | 41.4%* |
| (Standard Error) | (2.2%) | (Standard Error) | (5.1%) | (Standard Error) | (3.4%) |
| Idaho | 44.1% | New Hampshire | 56.4% | Virginia | 51.7% |
| (Standard Error) | (4.1%) | (Standard Error) | (3.8%) | (Standard Error) | (4.1%) |
| Illinois | 59.9%* | New Jersey | 62.7%* | Washington | 46.3% |
| (Standard Error) | (2.9%) | (Standard Error) | (4.2%) | (Standard Error) | (3.8%) |
| Indiana | 39.3%* | New Mexico | 40.4%* | West Virginia | 47.5% |
| (Standard Error) | (4.3%) | (Standard Error) | (4.0%) | (Standard Error) | (4.7%) |
| Iowa | 51.4% | New York | 57.2%* | Wisconsin | 46.4% |
| (Standard Error) | (3.7%) | (Standard Error) | (2.4%) | (Standard Error) | (4.1%) |
| Kansas | 57.1% | North Carolina | 42.9%* | Wyoming | 40.9%* |
| (Standard Error) | (3.9%) | (Standard Error) | (3.9%) | (Standard Error) | (3.8%) |
Source: Medical Expenditure Panel Survey-Insurance Component, private-sector establishments, 2019.
Note: * Statistically different from the national average of 50.7 percent at p < 0.05. Note that the standard error on the national estimate of 50.7 percent is 0.69 percent.
Source: Medical Expenditure Panel Survey-Insurance Component, private-sector establishments, 2006–2019.
Denominator: Within each category, all employees in establishments that offer health insurance.
Note: Medical Expenditure Panel Survey-Insurance Component estimates are not available for 2007.
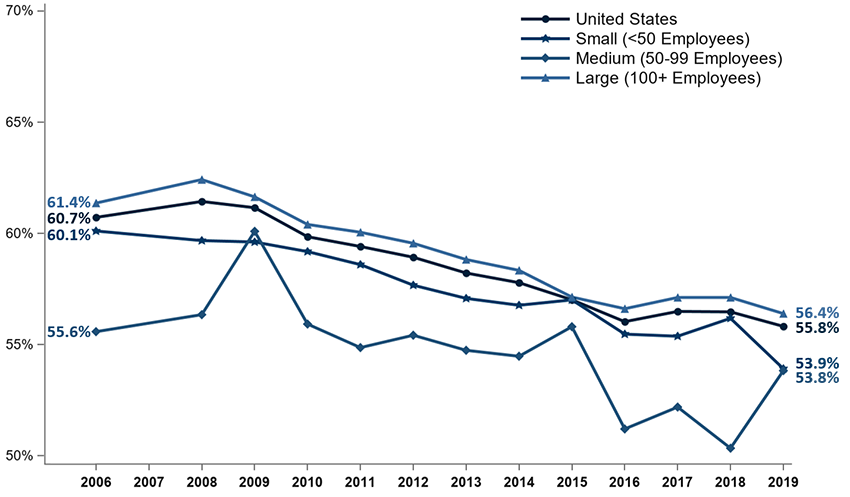
Figure 3. Percentage (standard error) of private-sector employees who are enrolled in health insurance at establishments that offer health insurance, overall and by firm size, 2006-2019
TABLE SUMMARY TABLE SUMMARY
| Number of Employees | 2006 | 2008 | 2009 | 2010 | 2011 | 2012 | 2013 | 2014 | 2015 | 2016 | 2017 | 2018 | 2019 |
|---|---|---|---|---|---|---|---|---|---|---|---|---|---|
| U.S. | 60.7% | 61.4% | 61.1% | 59.8% | 59.4% | 58.9% | 58.2% | 57.8% | 57.0% | 56.0% | 56.5% | 56.5% | 55.8% |
| (Standard Error) | (0.3%) | (0.4%) | (0.4%) | (0.5%) | (0.2%) | (0.4%) | (0.3%) | (0.4%) | (0.4%) | (0.4%) | (0.4%) | (0.4%) | (0.5%) |
| <50 | 60.1% | 59.7% | 59.6% | 59.2% | 58.6% | 57.7% | 57.1% | 56.8% | 57.0% | 55.5% | 55.4% | 56.2% | 53.9% |
| (Standard Error) | (0.6%) | (0.2%) | (0.4%) | (0.6%) | (0.5%) | (0.5%) | (0.5%) | (0.6%) | (0.6%) | (0.6%) | (0.6%) | (0.6%) | (0.6%) |
| 50–99 | 55.6% | 56.3% | 60.1% | 55.9% | 54.9% | 55.4% | 54.7% | 54.5% | 55.8% | 51.2% | 52.2% | 50.3% | 53.8% |
| (Standard Error) | (1.6%) | (1.0%) | (1.0%) | (0.8%) | (1.0%) | (1.2%) | (0.8%) | (1.3%) | (1.2%) | (1.2%) | (1.2%) | (1.2%) | (1.2%) |
| 100+ | 61.4% | 62.4% | 61.6% | 60.4% | 60.0% | 59.5% | 58.8% | 58.3% | 57.1% | 56.6% | 57.1% | 57.1% | 56.4% |
| (Standard Error) | (0.5%) | (0.5%) | (0.6%) | (0.6%) | (0.3%) | (0.4%) | (0.3%) | (0.5%) | (0.5%) | (0.5%) | (0.5%) | (0.5%) | (0.6%) |
Source: Medical Expenditure Panel Survey-Insurance Component, private-sector establishments, 2006–2019.
Denominator: Within each category, all employees in establishments that offer health insurance.
Note: Medical Expenditure Panel Survey-Insurance Component estimates are not available for 2007.
Source: Medical Expenditure Panel Survey-Insurance Component, private-sector establishments, 2006–2019.
Denominator: Within each category, all employees in establishments that offer health insurance.
Note: Medical Expenditure Panel Survey-Insurance Component estimates are not available for 2007.
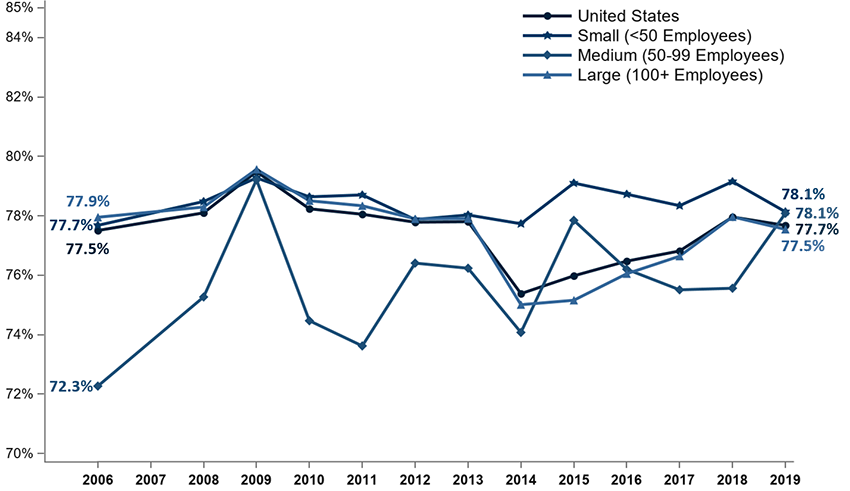
Figure 4. Percentage (standard error) of private-sector employees eligible for health insurance at establishments that offer health insurance, overall and by firm size, 2006–2019
TABLE SUMMARY TABLE SUMMARY
| Number of Employees | 2006 | 2008 | 2009 | 2010 | 2011 | 2012 | 2013 | 2014 | 2015 | 2016 | 2017 | 2018 | 2019 |
|---|---|---|---|---|---|---|---|---|---|---|---|---|---|
| U.S. | 77.5% | 78.1% | 79.5% | 78.2% | 78.0% | 77.8% | 77.8% | 75.4% | 76.0% | 76.5% | 76.8% | 78.0% | 77.7% |
| (Standard Error) | (0.4%) | (0.4%) | (0.3%) | (0.5%) | (0.4%) | (0.3%) | (0.2%) | (0.4%) | (0.4%) | (0.4%) | (0.4%) | (0.4%) | (0.4%) |
| <50 | 77.7% | 78.5% | 79.3% | 78.6% | 78.7% | 77.9% | 78.0% | 77.7% | 79.1% | 78.7% | 78.3% | 79.1% | 78.1% |
| (Standard Error) | (0.6%) | (0.4%) | (0.5%) | (0.5%) | (0.6%) | (0.5%) | (0.4%) | (0.6%) | (0.6%) | (0.6%) | (0.6%) | (0.6%) | (0.6%) |
| 50–99 | 72.3% | 75.3% | 79.2% | 74.5% | 73.6% | 76.4% | 76.2% | 74.1% | 77.8% | 76.2% | 75.5% | 75.6% | 78.1% |
| (Standard Error) | (1.5%) | (1.3%) | (0.8%) | (0.6%) | (1.0%) | (1.2%) | (0.8%) | (1.4%) | (1.2%) | (1.2%) | (1.2%) | (1.2%) | (1.2%) |
| 100+ | 77.9% | 78.3% | 79.6% | 78.5% | 78.3% | 77.9% | 77.9% | 75.0% | 75.2% | 76.0% | 76.6% | 78.0% | 77.5% |
| (Standard Error) | (0.6%) | (0.4%) | (0.5%) | (0.6%) | (0.4%) | (0.3%) | (0.3%) | (0.5%) | (0.5%) | (0.4%) | (0.5%) | (0.5%) | (0.5%) |
Source: Medical Expenditure Panel Survey-Insurance Component, private-sector establishments, 2006–2019.
Denominator: Within each category, all employees in establishments that offer health insurance.
Note: Medical Expenditure Panel Survey-Insurance Component estimates are not available for 2007.
Source: Medical Expenditure Panel Survey-Insurance Component, private-sector establishments, 2006–2019.
Denominator: Within each category, eligible employees in establishments that offer health insurance.
Note: Medical Expenditure Panel Survey-Insurance Component estimates are not available for 2007.
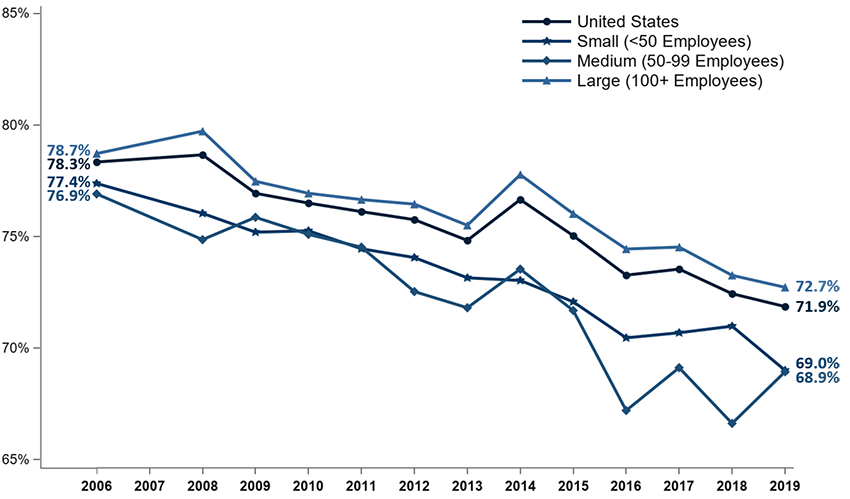
Figure 5. Percentage (standard error) of eligible private-sector employees who are enrolled in health insurance at establishments that offer health insurance, overall and by firm size, 2006–2019
TABLE SUMMARY TABLE SUMMARY
| Number of Employees | 2006 | 2008 | 2009 | 2010 | 2011 | 2012 | 2013 | 2014 | 2015 | 2016 | 2017 | 2018 | 2019 |
|---|---|---|---|---|---|---|---|---|---|---|---|---|---|
| U.S. | 78.3% | 78.7% | 76.9% | 76.5% | 76.1% | 75.8% | 74.8% | 76.7% | 75.0% | 73.3% | 73.5% | 72.4% | 71.9% |
| (Standard Error) | (0.3%) | (0.3%) | (0.3%) | (0.2%) | (0.3%) | (0.3%) | (0.2%) | (0.3%) | (0.3%) | (0.3%) | (0.3%) | (0.4%) | (0.4%) |
| <50 | 77.4% | 76.0% | 75.2% | 75.3% | 74.4% | 74.1% | 73.1% | 73.0% | 72.1% | 70.4% | 70.7% | 71.0% | 69.0% |
| (Standard Error) | (0.7%) | (0.3%) | (0.3%) | (0.6%) | (0.4%) | (0.4%) | (0.6%) | (0.5%) | (0.5%) | (0.5%) | (0.6%) | (0.6%) | (0.6%) |
| 50–99 | 76.9% | 74.9% | 75.9% | 75.1% | 74.5% | 72.5% | 71.8% | 73.5% | 71.7% | 67.2% | 69.1% | 66.6% | 68.9% |
| (Standard Error) | (1.3%) | (0.5%) | (0.9%) | (0.7%) | (0.6%) | (0.8%) | (1.0%) | (1.0%) | (1.1%) | (1.2%) | (1.1%) | (1.1%) | (1.0%) |
| 100+ | 78.7% | 79.7% | 77.5% | 76.9% | 76.7% | 76.4% | 75.5% | 77.8% | 76.0% | 74.4% | 74.5% | 73.3 | 72.7% |
| (Standard Error) | (0.4%) | (0.4%) | (0.5%) | (0.3%) | (0.3%) | (0.4%) | (0.3%) | (0.3%) | (0.3%) | (0.4%) | (0.4%) | (0.4%) | (0.5%) |
Source: Medical Expenditure Panel Survey-Insurance Component, private-sector establishments, 2006–2019.
Denominator: Within each category, eligible employees in establishments that offer health insurance.
Note: Medical Expenditure Panel Survey-Insurance Component estimates are not available for 2007.
Source: Medical Expenditure Panel Survey-Insurance Component, private-sector establishments, 2006–2019.
Denominator: Within each category, all employees in establishments that offer health insurance.
Note: Medical Expenditure Panel Survey-Insurance Component estimates are not available for 2007.
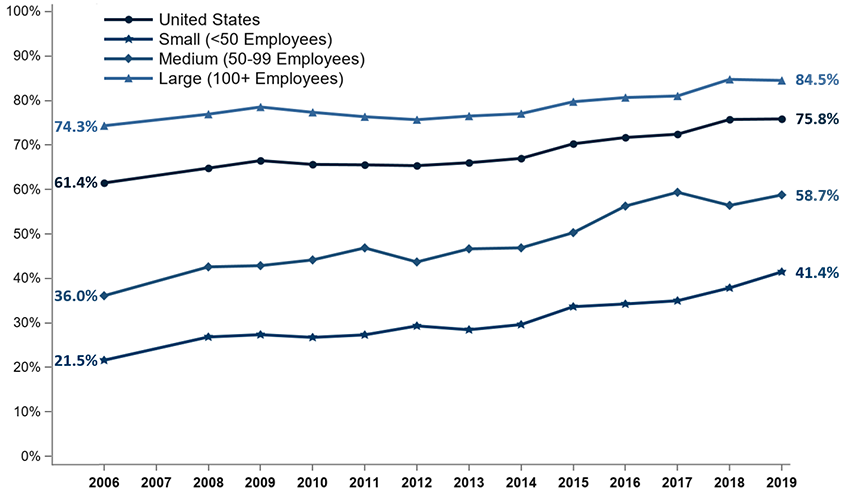
Figure 6. Percentage (standard error) of private-sector working in establishments that offer two or more health insurance plans, overall and by firm size, 2006–2019
TABLE SUMMARY TABLE SUMMARY
| Number of Employees | 2006 | 2008 | 2009 | 2010 | 2011 | 2012 | 2013 | 2014 | 2015 | 2016 | 2017 | 2018 | 2019 |
|---|---|---|---|---|---|---|---|---|---|---|---|---|---|
| U.S. | 61.4% | 64.8% | 66.5% | 65.6% | 65.5% | 65.3% | 66.0% | 67.0% | 70.2% | 71.7% | 72.4% | 75.7% | 75.8% |
| (Standard Error) | (0.7%) | (0.6%) | (0.7%) | (0.8%) | (0.5%) | (0.7%) | (0.6%) | (0.6%) | (0.5%) | (0.5%) | (0.5%) | (0.5%) | (0.5%) |
| <50 | 21.5% | 26.8% | 27.3% | 26.7% | 27.2 | 29.3% | 28.4% | 29.6% | 33.6% | 34.2% | 34.9% | 37.8% | 41.4% |
| (Standard Error) | (1.1%) | (0.7%) | (0.9%) | (0.8%) | (0.9%) | (0.8%) | (1.0%) | (0.9%) | (1.1%) | (1.0%) | (1.0%) | (1.0%) | (1.1%) |
| 50–99 | 36.0% | 42.5% | 42.8% | 44.1% | 46.8% | 43.7% | 46.6% | 46.8% | 50.2% | 56.2% | 59.3% | 56.4% | 58.7% |
| (Standard Error) | (2.4%) | (1.7%) | (2.0%) | (1.9%) | (2.2%) | (1.7%) | (2.2%) | (2.1%) | (2.2%) | (2.0%) | (1.9%) | (1.9%) | (2.0%) |
| 100+ | 74.3% | 76.9% | 78.5% | 77.3% | 76.3% | 75.7% | 76.5% | 77.0% | 79.7% | 80.7% | 81.0% | 84.7 | 84.5% |
| (Standard Error) | (0.6%) | (0.7%) | (0.7%) | (1.0%) | (0.7%) | (0.7%) | (0.7%) | (0.6%) | (0.6%) | (0.6%) | (0.6%) | (0.5%) | (0.6%) |
Source: Medical Expenditure Panel Survey-Insurance Component, private-sector establishments, 2006–2019.
Denominator: Within each category, all employees in establishments that offer health insurance.
Note: Medical Expenditure Panel Survey-Insurance Component estimates are not available for 2007.
Source: Medical Expenditure Panel Survey-Insurance Component, private-sector establishments, 2006–2019.
Note: Medical Expenditure Panel Survey-Insurance Component estimates are not available for 2007.
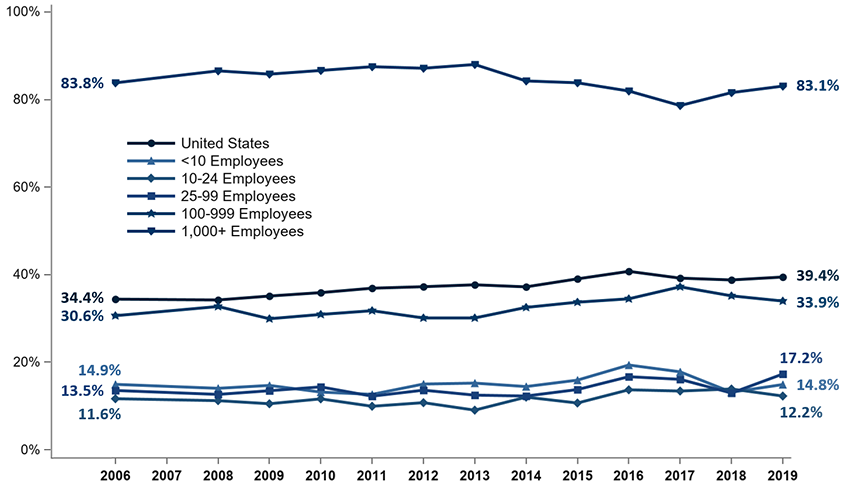
Figure 7. Percentage (standard error) of private-sector establishments that offer health insurance that self-insure at least one plan, overall and by detailed firm size, 2006–2019
TABLE SUMMARY TABLE SUMMARY
| Number of Employees | 2006 | 2008 | 2009 | 2010 | 2011 | 2012 | 2013 | 2014 | 2015 | 2016 | 2017 | 2018 | 2019 |
|---|---|---|---|---|---|---|---|---|---|---|---|---|---|
| U.S. | 34.4% | 34.2% | 35.1% | 35.8% | 36.9% | 37.2% | 37.6% | 37.2% | 39.0% | 40.7% | 39.2% | 38.7% | 39.4% |
| (Standard Error) | (0.5%) | (0.4%) | (0.4%) | (0.5%) | (0.5%) | (0.5%) | (0.5%) | (0.5%) | (0.5%) | (0.6%) | (0.6%) | (0.6%) | (0.6%) |
| <10 | 14.9% | 14.0% | 14.6% | 13.1% | 12.6 | 14.9% | 15.2% | 14.4% | 15.8% | 19.3% | 17.7% | 13.1% | 14.8% |
| (Standard Error) | (0.9%) | (0.8%) | (0.7%) | (0.6%) | (0.8%) | (0.9%) | (1.4%) | (0.8%) | (1.0%) | (1.4%) | (1.4%) | (1.1%) | (1.3%) |
| 10–24 | 11.6% | 11.1% | 10.4% | 11.6% | 9.9% | 10.7% | 9.0% | 12.0% | 10.6% | 13.6% | 13.3% | 13.8% | 12.2% |
| (Standard Error) | (0.6%) | (0.9%) | (0.4%) | (0.8%) | (0.7%) | (0.7%) | (0.7%) | (1.0%) | (1.0%) | (1.1%) | (1.2%) | (1.2%) | (1.1%) |
| 25–99 | 13.5% | 12.6% | 13.4% | 14.3% | 12.2% | 13.5% | 12.4% | 12.2% | 13.7% | 16.6% | 16.0% | 12.9% | 17.2% |
| (Standard Error) | (0.7%) | (0.8%) | (0.7%) | (0.7%) | (0.7%) | (0.7%) | (0.7%) | (0.8%) | (0.9%) | (0.9%) | (0.9%) | (0.8%) | (0.9%) |
| 100–999 | 30.6% | 32.7% | 29.9% | 30.9% | 31.7% | 30.1% | 30.1% | 32.5% | 33.7% | 34.4% | 37.2% | 35.1% | 33.9% |
| (Standard Error) | (0.9%) | (1.3%) | (0.7%) | (0.9%) | (1.1) | (0.8%) | (1.0%) | (1.2%) | (1.2%) | (1.2%) | (1.3%) | (1.2%) | (1.1%) |
| 1,000+ | 83.8% | 86.5% | 85.8% | 86.6% | 87.5% | 87.1% | 88.0% | 84.2% | 83.8% | 81.9% | 78.6% | 81.6 | 83.1% |
| (Standard Error) | (0.7%) | (0.5%) | (0.4%) | (1.6%) | (0.5%) | (0.7%) | (0.5%) | (0.8%) | (0.8%) | (0.8%) | (0.8%) | (0.8%) | (0.8%) |
Source: Medical Expenditure Panel Survey-Insurance Component, private-sector establishments, 2006–2019.
Note: Medical Expenditure Panel Survey-Insurance Component estimates are not available for 2007.
Source: Medical Expenditure Panel Survey-Insurance Component, private-sector establishments, 2006–2019.
Note: Medical Expenditure Panel Survey-Insurance Component estimates are not available for 2007.
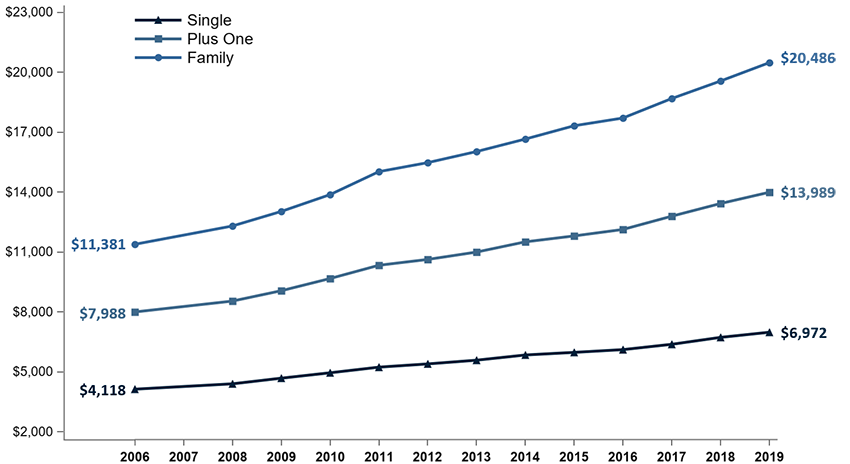
Figure 8. Average total premiums (standard error) per enrolled employee for single, employee-plus-one, and family coverage, 2006–2019
TABLE SUMMARY TABLE SUMMARY
| Coverage | 2006 | 2008 | 2009 | 2010 | 2011 | 2012 | 2013 | 2014 | 2015 | 2016 | 2017 | 2018 | 2019 |
|---|---|---|---|---|---|---|---|---|---|---|---|---|---|
| Single | $4,118 | $4,386 | $4,669 | $4,940 | $5,222 | $5,384 | $5,571 | $5,832 | $5,963 | $6,101 | $6,368 | $6,715 | $6,972 |
| (Standard Error) | ($25) | ($15) | ($21) | ($22) | ($26) | ($28) | ($23) | ($25) | ($26) | ($27) | ($28) | ($31) | ($35) |
| Plus One | $7,988 | $8,535 | $9,053 | $9,664 | $10,329 | $10,621 | $10,990 | $11,503 | $11,800 | $12,124 | $12,789 | $13,425 | $13,989 |
| (Standard Error) | ($48) | ($43) | ($34) | ($60) | ($105) | ($256 | ($254 | ($60) | ($58) | ($60) | ($70) | ($70) | ($83) |
| Family | $11,381 | $12,298 | $13,027 | $13,871 | $15,022 | $15,473 | $16,029 | $16,655 | $17,322 | $17,710 | $18,687 | $19,565 | $20,486 |
| (Standard Error) | ($32) | ($81) | ($25) | ($75) | ($98) | ($95) | ($61) | ($79) | ($95) | ($84) | ($105) | ($104) | ($125) |
Source: Medical Expenditure Panel Survey-Insurance Component, private-sector establishments, 2006–2019.
Note: Medical Expenditure Panel Survey-Insurance Component estimates are not available for 2007.
Source: Medical Expenditure Panel Survey-Insurance Component, private-sector establishments, 2006–2019.
Note: Medical Expenditure Panel Survey-Insurance Component estimates are not available for 2007. Therefore, growth rates were annualized over the 2006–2008 period.
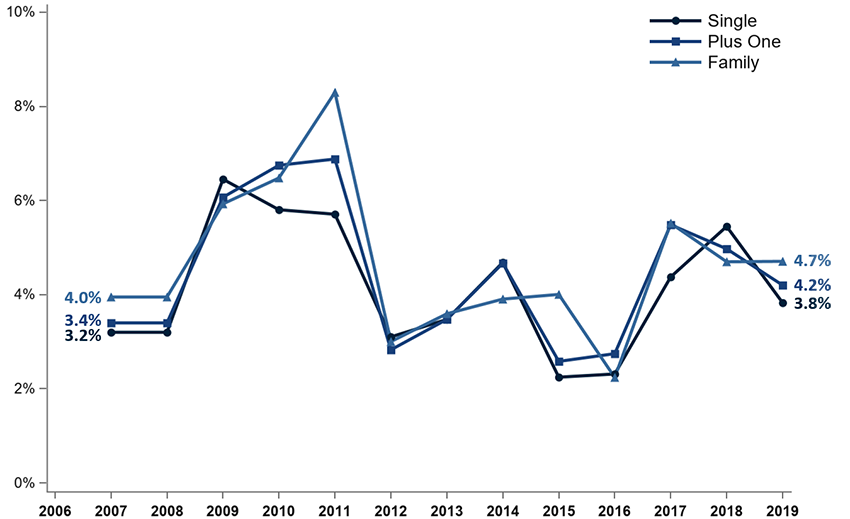
Figure 9. Percentage change (standard error) in total premiums from previous year per enrolled employee for single, employee-plus-one, and family coverage, 2006–2019
TABLE SUMMARY TABLE SUMMARY
| Year | Single | Employee-Plus-One | Family |
|---|---|---|---|
| 2007 | 3.2% | 3.4% | 4.0% |
| (Standard Error) | (0.8%) | (0.8%) | (0.8%) |
| 2008 | 3.2% | 3.4% | 4.0% |
| (Standard Error) | (0.8%) | (0.8%) | (0.8%) |
| 2009 | 6.5% | 6.1% | 5.9% |
| (Standard Error) | (0.6%) | (0.7%) | (0.7%) |
| 2010 | 5.8% | 6.7% | 6.5% |
| (Standard Error) | (0.7%) | (0.8%) | (0.6%) |
| 2011 | 5.7% | 6.9% | 8.3% |
| (Standard Error) | (0.7%) | (1.3%) | (0.9%) |
| 2012 | 3.1% | 2.8% | 3.0% |
| (Standard Error) | (0.7%) | (1.2%) | (0.9%) |
| 2013 | 3.5% | 3.5% | 3.6% |
| (Standard Error) | (0.7%) | (0.7%) | (0.7%) |
| 2014 | 4.7% | 4.7% | 3.9% |
| (Standard Error) | (0.6%) | (0.7%) | (0.6%) |
| 2015 | 2.2% | 2.6% | 4.0% |
| (Standard Error) | (0.6%) | (0.7%) | (0.8%) |
| 2016 | 2.3% | 2.7% | 2.2% |
| (Standard Error) | (0.6%) | (0.7%) | (0.7%) |
| 2017 | 4.4% | 5.5% | 5.5% |
| (Standard Error) | (0.7%) | (0.8%) | (0.8%) |
| 2018 | 5.4% | 5.0% | 4.7% |
| (Standard Error) | (0.7%) | (0.8%) | (0.8%) |
| 2019 | 3.8% | 4.2% | 4.7% |
| (Standard Error) | (0.7%) | (0.8%) | (0.8%) |
Source: Medical Expenditure Panel Survey-Insurance Component, private-sector establishments, 2006–2019.
Note: Medical Expenditure Panel Survey-Insurance Component estimates are not available for 2007. Therefore, growth rates were annualized over the 2006–2008 period.
Source: Medical Expenditure Panel Survey-Insurance Component, private-sector establishments, 2006–2019.
Note: Medical Expenditure Panel Survey-Insurance Component estimates are not available for 2007.
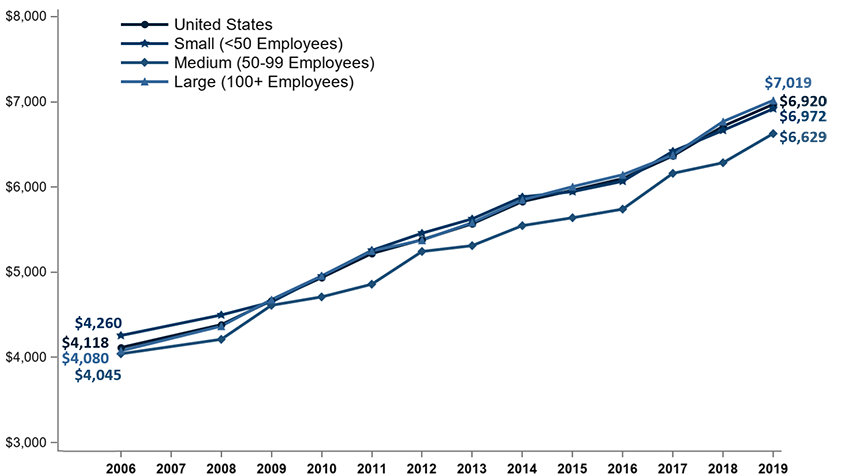
Figure 10. Average total single premium (standard error) per enrolled employee, by firm size, 2006–2019
TABLE SUMMARY TABLE SUMMARY
| Number of Employees | 2006 | 2008 | 2009 | 2010 | 2011 | 2012 | 2013 | 2014 | 2015 | 2016 | 2017 | 2018 | 2019 |
|---|---|---|---|---|---|---|---|---|---|---|---|---|---|
| U.S. | $4,118 | $4,386 | $4,669 | $4,940 | $5,222 | $5,384 | $5,571 | $5,832 | $5,963 | $6,101 | $6,368 | $6,715 | $6,972 |
| (Standard Error) | ($25) | ($15) | ($21) | ($00) | ($26) | ($28) | ($23) | ($25) | ($26) | ($27) | ($28) | ($31) | ($35) |
| <50 | $4,260 | $4,501 | $4,652 | $4,956 | $5,258 | $5,460 | $5,628 | $5,886 | $5,947 | $6,070 | $6,421 | $6,667 | $6,920 |
| (Standard Error) | ($34) | ($31) | ($31) | ($34) | ($39) | ($60) | ($39) | ($55) | ($55) | ($53) | ($61) | ($63) | ($73) |
| 50–99 | $4,045 | $4,215 | $4,614 | $4,713 | $4,861 | $5,246 | $5,314 | $5,549 | $5,642 | $5,743 | $6,163 | $6,287 | $6,629 |
| (Standard Error) | ($66) | ($37) | ($82) | ($52) | ($75) | ($39) | ($73) | ($82) | ($104) | ($96) | ($121) | ($111) | ($99) |
| 100+ | $4,080 | $4,370 | $4,681 | $4,959 | $5,252 | $5,378 | $5,584 | $5,851 | $6,006 | $6,146 | $6,377 | $6,770 | $7,019 |
| (Standard Error) | ($32) | ($26) | ($38) | ($26) | ($31) | ($28) | ($29) | ($30) | ($31) | ($32) | ($33) | ($37) | ($42) |
Source: Medical Expenditure Panel Survey-Insurance Component, private-sector establishments, 2006–2019.
Note: Medical Expenditure Panel Survey-Insurance Component estimates are not available for 2007.
Source: Medical Expenditure Panel Survey-Insurance Component, private-sector establishments, 2006–2019.
Note: Medical Expenditure Panel Survey-Insurance Component estimates are not available for 2007.
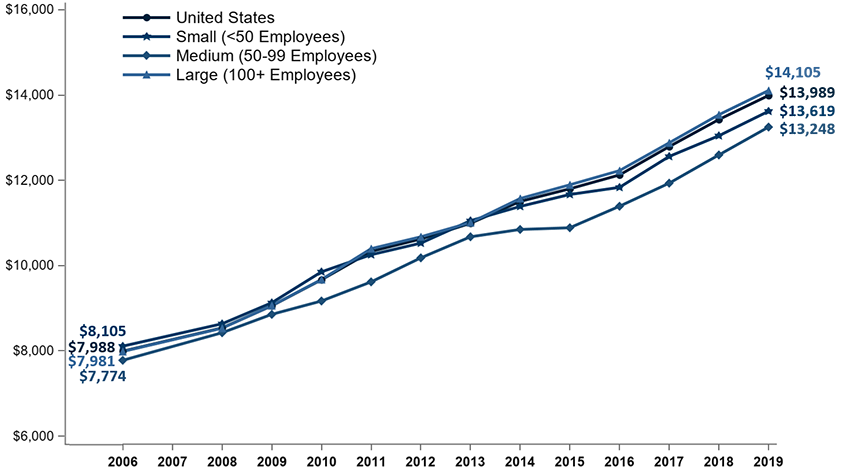
Figure 11. Average total employee-plus-one premium (standard error) per enrolled employee, by firm size, 2006–2019
TABLE SUMMARY TABLE SUMMARY
| Number of Employees | 2006 | 2008 | 2009 | 2010 | 2011 | 2012 | 2013 | 2014 | 2015 | 2016 | 2017 | 2018 | 2019 |
|---|---|---|---|---|---|---|---|---|---|---|---|---|---|
| U.S. | $7,988 | $8,535 | $9,053 | $9,664 | $10,329 | $10,621 | $10,990 | $11,503 | $11,800 | $12,124 | $12,789 | $13,425 | $13,989 |
| (Standard Error) | ($48) | ($43) | ($34) | ($60) | ($105) | ($56) | ($54) | ($60) | ($58) | ($60) | ($70) | ($70) | ($83) |
| <50 | $8,105 | $8,631 | $9,124 | $9,850 | $10,253 | $10,524 | $11,050 | $11,386 | $11,666 | $11,833 | $12,558 | $13,044 | $13,619 |
| (Standard Error) | ($113) | ($110) | ($119) | ($60) | ($104) | ($121) | ($92) | ($163) | ($158) | ($156) | ($170) | ($176) | ($248) |
| 50–99 | $7,774 | $8,421 | $8,852 | $9,166 | $9,615 | $10,178 | $10,673 | $10,845 | $10,885 | $11,389 | $11,931 | $12,593 | $13,248 |
| (Standard Error) | ($167) | ($88) | ($148) | ($124) | ($192) | ($185) | ($330) | ($187) | ($198) | ($227) | ($232) | ($236) | ($321) |
| 100+ | $7,981 | $8,527 | $9,058 | $9,669 | $10,394 | $10,672 | $11,006 | $11,571 | $11,892 | $12,225 | $12,878 | $13,537 | $14,105 |
| (Standard Error) | ($61) | ($60) | ($34) | ($62) | ($113) | ($70) | ($59) | ($68) | ($66) | ($68) | ($79) | ($79) | ($92) |
Source: Medical Expenditure Panel Survey-Insurance Component, private-sector establishments, 2006–2019.
Note: Medical Expenditure Panel Survey-Insurance Component estimates are not available for 2007.
Source: Medical Expenditure Panel Survey-Insurance Component, private-sector establishments, 2006–2019.
Note: Medical Expenditure Panel Survey-Insurance Component estimates are not available for 2007.
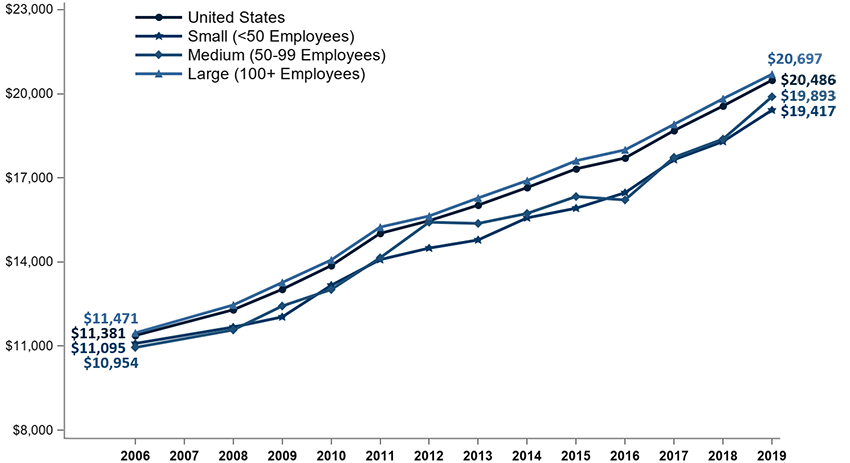
Figure 12. Average total family premium (standard error) per enrolled employee, by firm size, 2006–2019
TABLE SUMMARY TABLE SUMMARY
| Number of Employees | 2006 | 2008 | 2009 | 2010 | 2011 | 2012 | 2013 | 2014 | 2015 | 2016 | 2017 | 2018 | 2019 |
|---|---|---|---|---|---|---|---|---|---|---|---|---|---|
| U.S. | $11,381 | $12,298 | $13,027 | $13,871 | $15,022 | $15,473 | $16,029 | $16,655 | $17,322 | $17,710 | $18,687 | $19,565 | $20,486 |
| (Standard Error) | ($32) | ($81) | ($25) | ($75) | ($98) | ($95) | ($61) | ($79) | ($95) | ($84) | ($105) | ($104) | ($125) |
| <50 | $11,095 | $11,679 | $12,041 | $13,170 | $14,086 | $14,496 | $15,787 | $15,575 | $16,919 | $16,471 | $17,649 | $18,296 | $19,417 |
| (Standard Error) | ($116) | ($182) | ($129) | ($111) | ($145) | ($181) | ($89) | ($177) | ($212) | ($207) | ($192) | ($231) | ($303) |
| 50–99 | $10,954 | $11,578 | $12,431 | $13,019 | $14,151 | $15,421 | $15,376 | $15,732 | $16,336 | $16,214 | $17,735 | $18,386 | $19,893 |
| (Standard Error) | ($301) | ($128) | ($229) | ($153) | ($168) | ($273) | ($268) | ($274) | ($335) | ($348) | ($327) | ($473) | ($435) |
| 100+ | $11,471 | $12,468 | $13,271 | $14,074 | $15,245 | $15,641 | $16,284 | $16,903 | $17,612 | $18,000 | $18,911 | $19,824 | $20,697 |
| (Standard Error) | ($51) | ($95) | ($33) | ($85) | ($117) | ($114) | ($82) | ($91) | ($110) | ($95) | ($122) | ($118) | ($143) |
Source: Medical Expenditure Panel Survey-Insurance Component, private-sector establishments, 2006–2019.
Note: Medical Expenditure Panel Survey-Insurance Component estimates are not available for 2007.
Source: Medical Expenditure Panel Survey-Insurance Component, private-sector establishments, 2019.
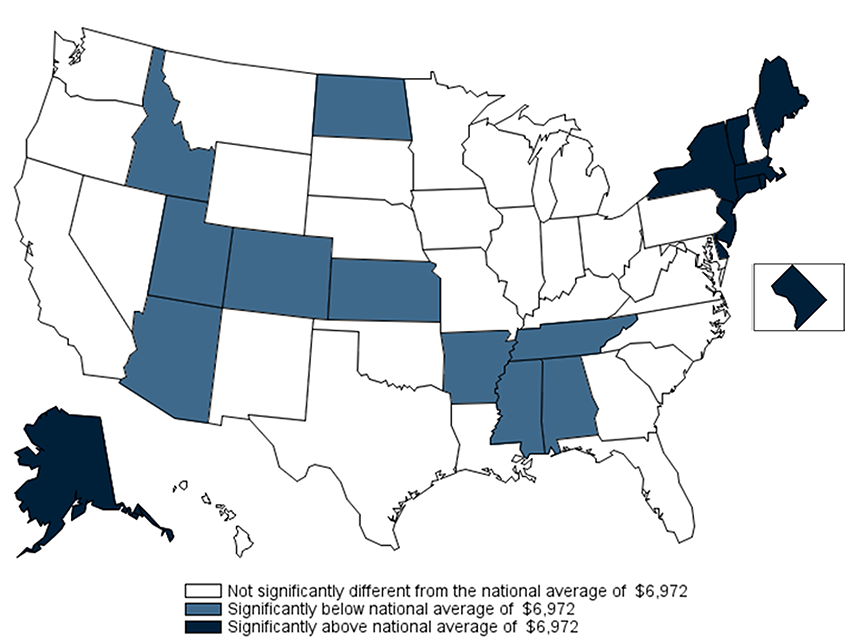
Figure 13. Average total single premium (standard error) per enrolled employee, by State, 2019
TABLE SUMMARY TABLE SUMMARY
| Alabama | $6,519* | Kentucky | $6,678 | North Dakota | $6,681* |
| (Standard Error) | ($130) | (Standard Error) | ($156) | (Standard Error) | ($131) |
| Alaska | $8,933* | Louisiana | $6,748 | Ohio | $7,178 |
| (Standard Error) | ($544) | (Standard Error) | ($153) | (Standard Error) | ($189) |
| Arizona | $6,517* | Maine | $7,424* | Oklahoma | $6,711 |
| (Standard Error) | ($180) | (Standard Error) | ($196) | (Standard Error) | ($222) |
| Arkansas | $6,054* | Maryland | $7,104 | Oregon | $6,651 |
| (Standard Error) | ($182) | (Standard Error) | ($244) | (Standard Error) | ($212) |
| California | $6,939 | Massachusetts | $7,540* | Pennsylvania | $7,159 |
| (Standard Error) | ($138) | (Standard Error) | ($158) | (Standard Error) | ($157) |
| Colorado | $6,550* | Michigan | $6,705 | Rhode Island | $7,263* |
| (Standard Error) | ($184) | (Standard Error) | ($191) | (Standard Error) | ($136) |
| Connecticut | $7,516* | Minnesota | $6,904 | South Carolina | $6,691 |
| (Standard Error) | ($199) | (Standard Error) | ($127) | (Standard Error) | ($184) |
| Delaware | $8,090* | Mississippi | $6,199* | South Dakota | $7,161 |
| (Standard Error) | ($310) | (Standard Error) | ($169) | (Standard Error) | ($152) |
| District of Columbia | $7,338* | Missouri | $6,800 | Tennessee | $6,630* |
| (Standard Error) | ($160) | (Standard Error) | ($198) | (Standard Error) | ($159) |
| Florida | $6,763 | Montana | $6,899 | Texas | $6,967 |
| (Standard Error) | ($235) | (Standard Error) | ($188) | (Standard Error) | ($147) |
| Georgia | $6,873 | Nebraska | $6,628 | Utah | $6,253* |
| (Standard Error) | ($165) | (Standard Error) | ($181) | (Standard Error) | ($122) |
| Hawaii | $6,671 | Nevada | $6,586 | Vermont | $7,319* |
| (Standard Error) | ($150) | (Standard Error) | ($259) | (Standard Error) | ($138) |
| Idaho | $6,346* | New Hampshire | $7,255 | Virginia | $6,776 |
| (Standard Error) | ($166) | (Standard Error) | ($203) | (Standard Error) | ($174) |
| Illinois | $7,157 | New Jersey | $7,777* | Washington | $6,897 |
| (Standard Error) | ($104) | (Standard Error) | ($247) | (Standard Error) | ($142) |
| Indiana | $6,957 | New Mexico | $6,696 | West Virginia | $7,059 |
| (Standard Error) | ($137) | (Standard Error) | ($175) | (Standard Error) | ($217) |
| Iowa | $6,657 | New York | $7,890* | Wisconsin | $7,001 |
| (Standard Error) | ($187) | (Standard Error) | ($151) | (Standard Error) | ($165) |
| Kansas | $6,338* | North Carolina | $6,793 | Wyoming | $7,209 |
| (Standard Error) | ($154) | (Standard Error) | ($122) | (Standard Error) | ($270) |
Source: Medical Expenditure Panel Survey-Insurance Component, private-sector establishments, 2019.
Note: * Statistically different from the national average of $6,972 at p < 0.05. Note that the standard error on the national estimate of $6,972 is $34.68.
Source: Medical Expenditure Panel Survey-Insurance Component, private-sector establishments, 2006–2019.
Note: Medical Expenditure Panel Survey-Insurance Component estimates are not available for 2007.
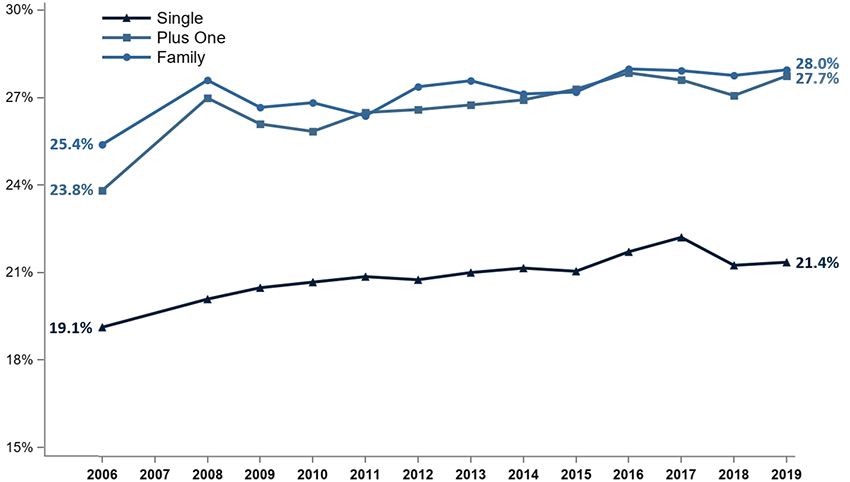
Figure 14. Average percentage (standard error) of premium contributed by employees for single, employee-plus-one, and family coverage, 2006–2019
TABLE SUMMARY TABLE SUMMARY
| Coverage | 2006 | 2008 | 2009 | 2010 | 2011 | 2012 | 2013 | 2014 | 2015 | 2016 | 2017 | 2018 | 2019 |
|---|---|---|---|---|---|---|---|---|---|---|---|---|---|
| Single | 19.1% | 20.1% | 20.5% | 20.7% | 20.9% | 20.8% | 21.0% | 21.2% | 21.1% | 21.7% | 22.2% | 21.3% | 21.4% |
| (Standard Error) | (0.4%) | (0.2%) | (0.3%) | (0.2%) | (0.2%) | (0.3%) | (0.3%) | (0.2%) | (0.2%) | (0.2%) | (0.2%) | (0.2%) | (0.3%) |
| Plus One | 23.8% | 27.0% | 26.1% | 25.8% | 26.5% | 26.6% | 26.7% | 26.9% | 27.3% | 27.8% | 27.6% | 27.1% | 27.7% |
| (Standard Error) | (0.4%) | (0.3%) | (0.3%) | (0.3%) | (0.3%) | (0.4%) | (0.2%) | (0.3%) | (0.3%) | (0.3%) | (0.3%) | (0.3%) | (0.4%) |
| Family | 25.4% | 27.6% | 26.7% | 26.8% | 26.4% | 27.4% | 27.6% | 27.1% | 27.2% | 28.0% | 27.9% | 27.8% | 28.0% |
| (Standard Error) | (0.3%) | (0.4%) | (0.3%) | (0.4%) | (0.3%) | (0.4%) | (0.3%) | (0.3%) | (0.3%) | (0.3%) | (0.4%) | (0.3%) | (0.4%) |
Source: Medical Expenditure Panel Survey-Insurance Component, private-sector establishments, 2006–2019.
Note: Medical Expenditure Panel Survey-Insurance Component estimates are not available for 2007.
Source: Medical Expenditure Panel Survey-Insurance Component, private-sector establishments, 2006–2019.
Note: Medical Expenditure Panel Survey-Insurance Component estimates are not available for 2007.
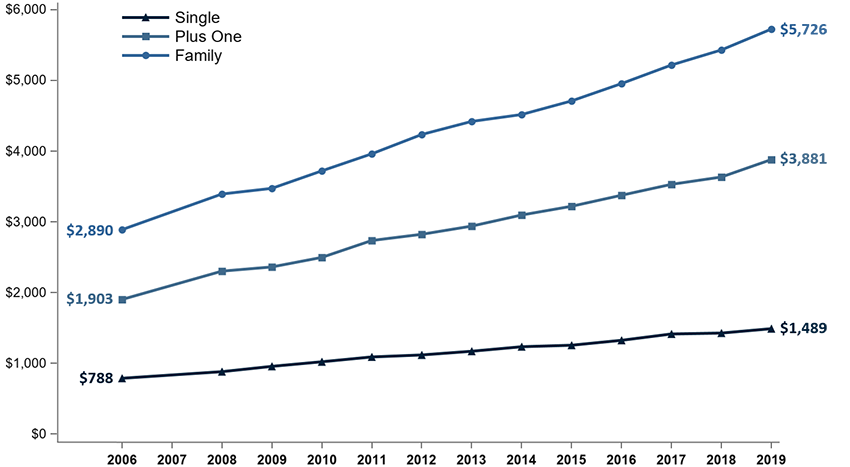
Figure 15. Average annual employee contribution (in dollars) (standard error) for single, employee-plus-one, and family coverage, 2006–2019
TABLE SUMMARY TABLE SUMMARY
| Coverage | 2006 | 2008 | 2009 | 2010 | 2011 | 2012 | 2013 | 2014 | 2015 | 2016 | 2017 | 2018 | 2019 |
|---|---|---|---|---|---|---|---|---|---|---|---|---|---|
| Single | $788 | $882 | $957 | $1,021 | $1,090 | $1,118 | $1,170 | $1,234 | $1,255 | $1,325 | $1,415 | $1,427 | $1,489 |
| (Standard Error) | ($16) | ($6) | ($13) | ($14) | ($9) | ($14) | ($16) | ($13) | ($14) | ($13) | ($15) | ($14) | ($18) |
| Plus One | $1,903 | $2,303 | $2,363 | $2,498 | $2,736 | $2,824 | $2,940 | $3,097 | $3,220 | $3,376 | $3,531 | $3,634 | $3,881 |
| (Standard Error) | ($24) | ($22) | ($27) | ($42) | ($36) | ($46) | ($23) | ($40) | ($35) | ($36) | ($39) | ($39) | ($54) |
| Family | $2,890 | $3,394 | $3,474 | $3,721 | $3,962 | $4,236 | $4,421 | $4,518 | $4,710 | $4,956 | $5,218 | $5,431 | $5,726 |
| (Standard Error) | ($34) | ($54) | ($44) | ($53) | ($42) | ($69) | ($50) | ($48) | ($56) | ($56) | ($64) | ($63) | ($82) |
Source: Medical Expenditure Panel Survey-Insurance Component, private-sector establishments, 2006–2019.
Note: Medical Expenditure Panel Survey-Insurance Component estimates are not available for 2007.
Source: Medical Expenditure Panel Survey-Insurance Component, private-sector establishments, 2006–2019.
Note: Medical Expenditure Panel Survey-Insurance Component estimates are not available for 2007.
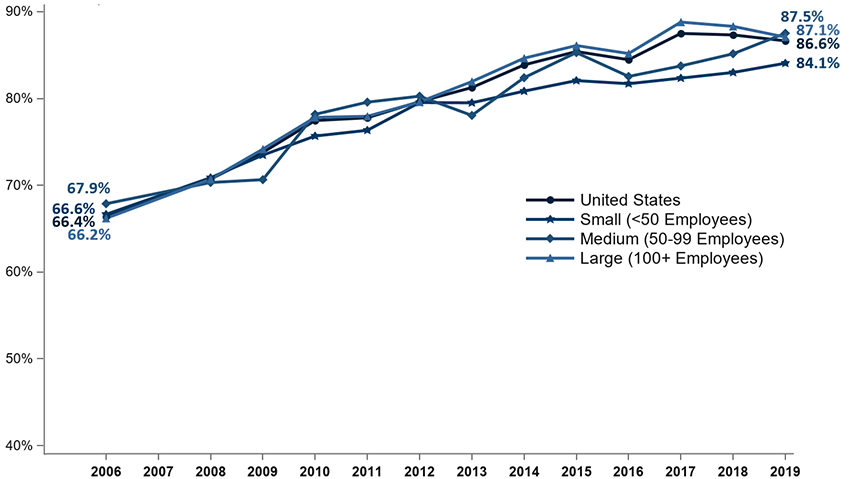
Figure 16. Percentage (standard error) of private-sector enrolled employees in a health insurance plan with a deductible, overall and by firm size, 2006–2019
TABLE SUMMARY TABLE SUMMARY
| Number of Employees | 2006 | 2008 | 2009 | 2010 | 2011 | 2012 | 2013 | 2014 | 2015 | 2016 | 2017 | 2018 | 2019 |
|---|---|---|---|---|---|---|---|---|---|---|---|---|---|
| U.S. | 66.4% | 70.7% | 73.8% | 77.5% | 77.8% | 79.6% | 81.3% | 83.9% | 85.4% | 84.5% | 87.5% | 87.3% | 86.6% |
| (Standard Error) | (0.6%) | (0.5%) | (0.5%) | (0.3%) | (0.7%) | (0.6%) | (0.7%) | (0.5%) | (0.5%) | (0.5%) | (0.4%) | (0.4%) | (0.5%) |
| <50 | 66.6% | 70.9% | 73.5% | 75.7% | 76.3 | 79.5% | 79.5% | 80.8% | 82.1% | 81.7% | 82.3% | 83.0% | 84.1% |
| (Standard Error) | (0.7%) | (0.7%) | (0.7%) | (0.7%) | (0.4%) | (1.0%) | (0.8%) | (0.8%) | (0.8%) | (0.8%) | (0.8%) | (0.8%) | (0.9%) |
| 50–99 | 67.9% | 70.3% | 70.6% | 78.2% | 79.6% | 80.3% | 78.0% | 82.4% | 85.3% | 82.5% | 83.7% | 85.1% | 87.5% |
| (Standard Error) | (2.6%) | (1.4%) | (1.9%) | (1.5%) | (1.7%) | (1.4%) | (1.1%) | (1.5%) | (1.5%) | (1.5%) | (1.6%) | (1.4%) | (1.5%) |
| 100+ | 66.2% | 70.7% | 74.2% | 77.8% | 77.9% | 79.6% | 81.9% | 84.6% | 86.1% | 85.2% | 88.8% | 88.3 | 87.1% |
| (Standard Error) | (0.8%) | (0.6%) | (0.6%) | (0.3%) | (1.0%) | (0.7%) | (0.7%) | (0.6%) | (0.6%) | (0.6%) | (0.4%) | (0.5%) | (0.5%) |
Source: Medical Expenditure Panel Survey-Insurance Component, private-sector establishments, 2006–2019.
Note: Medical Expenditure Panel Survey-Insurance Component estimates are not available for 2007.
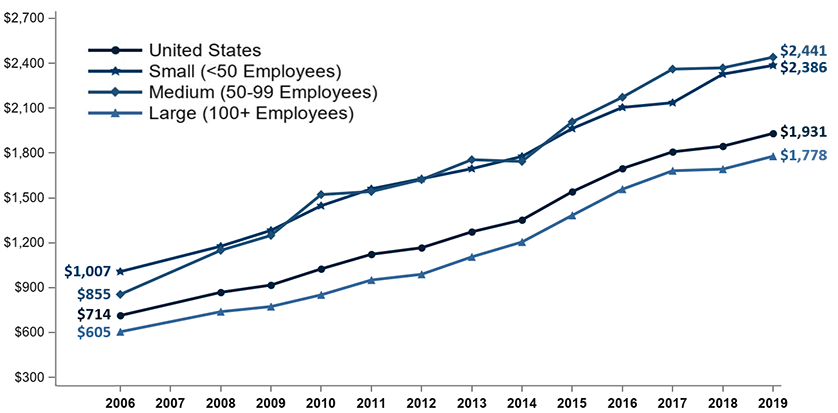
Source: Medical Expenditure Panel Survey-Insurance Component, private-sector establishments, 2006–2019.
Note: Medical Expenditure Panel Survey-Insurance Component estimates are not available for 2007. In 2015, the methodology for calibrating the upper edit bound for the individual deductible amount changed, causing the average individual deductible per employee enrolled with single coverage in a heath insurance plan with a deductible to increase by about 5 percent at the national level in 2015 relative to the earlier methodology.
Figure 17. Average individual deductible (in dollars) (standard error) per employee enrolled with single coverage in a health insurance plan with a deductible, overall and by firm size, 2006–2019
TABLE SUMMARY TABLE SUMMARY
| Number of Employees | 2006 | 2008 | 2009 | 2010 | 2011 | 2012 | 2013 | 2014 | 2015 | 2016 | 2017 | 2018 | 2019 |
|---|---|---|---|---|---|---|---|---|---|---|---|---|---|
| U.S. | $714 | $869 | $917 | $1,025 | $1,123 | $1,167 | $1,273 | $1,353 | $1,541 | $1,696 | $1,808 | $1,846 | $1,931 |
| (Standard Error) | ($9) | ($7) | ($9) | ($18) | ($12) | ($8) | ($20) | ($13) | ($16) | ($16) | ($17) | ($17) | ($18) |
| <50 | $1,007 | $1,177 | $1,283 | $1,447 | $1,561 | $1,628 | $1,695 | $1,777 | $1,964 | $2,105 | $2,136 | $2,327 | $2,386 |
| (Standard Error) | ($20) | ($13) | ($24) | ($21) | ($26) | ($25) | ($24) | ($28) | ($35) | ($34) | ($35) | ($36) | ($35) |
| 50–99 | $855 | $1,149 | $1,249 | $1,522 | $1,543 | $1,622 | $1,755 | $1,744 | $2,008 | $2,173 | $2,361 | $2,369 | $2,441 |
| (Standard Error) | ($71) | ($62) | ($46) | ($57) | ($49) | ($64) | ($49) | ($59) | ($62) | ($64) | ($85) | ($65) | ($67) |
| 100+ | $605 | $740 | $774 | $852 | $951 | $989 | $1,106 | $1,205 | $1,383 | $1,558 | $1,681 | $1,692 | $1,778 |
| (Standard Error) | ($12) | ($8) | ($7) | ($20) | ($14) | ($10) | ($19) | ($14) | ($18) | ($18) | ($20) | ($19) | ($21) |
Source: Medical Expenditure Panel Survey-Insurance Component, private-sector establishments, 2006–2019.
Note: Medical Expenditure Panel Survey-Insurance Component estimates are not available for 2007. In 2015, the methodology for calibrating the upper edit bound for the individual deductible amount changed, causing the average individual deductible per employee enrolled with single coverage in a heath insurance plan with a deductible to increase by about 5 percent at the national level in 2015 relative to the earlier methodology.