MEPS at-a-glance Charts
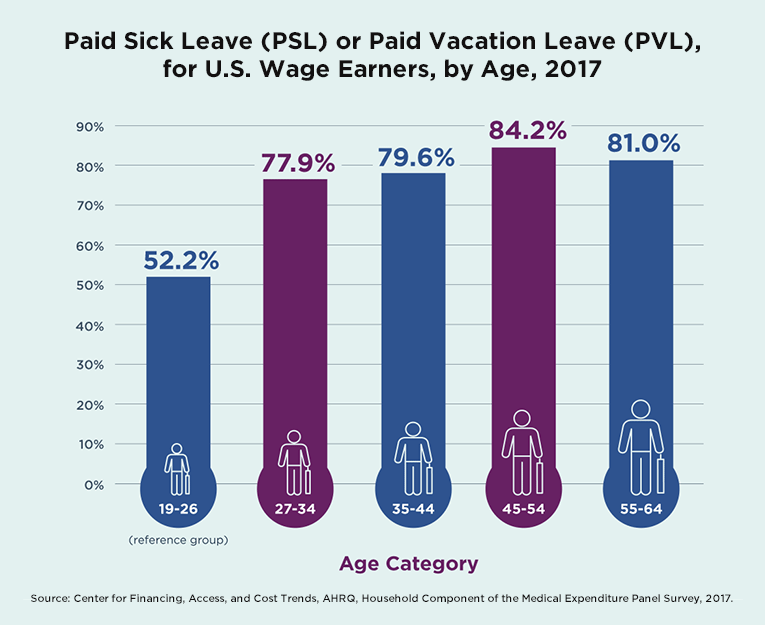
Paid Sick Leave (PSL) or Paid Vacation Leave (PVL), for U.S. Wage Earners, by Age, 2017
| Age Category |
Percentage of Wage Earners |
| 19-26 (reference group) |
52.2% |
| 27-34 |
77.9% |
| 35-44 |
79.6% |
| 45-54 |
84.2% |
| 55-64 |
81.0% |
Source: Center for Financing, Access, and Cost Trends, AHRQ, Household Component of the
Medical Expenditure Panel Survey, 2017.
- Access to paid sick leave is an employment benefit that can provide
financial support to families during periods when health difficulties, which may lead to increases in
out-of-pocket spending, might otherwise result in lost earnings.
- Older workers had more access to paid sick leave or vacation leave compared
to younger workers aged 19–26.
- Workers aged 45–54 had more access to paid sick leave or vacation
leave than any other group, including workers aged 55–64.

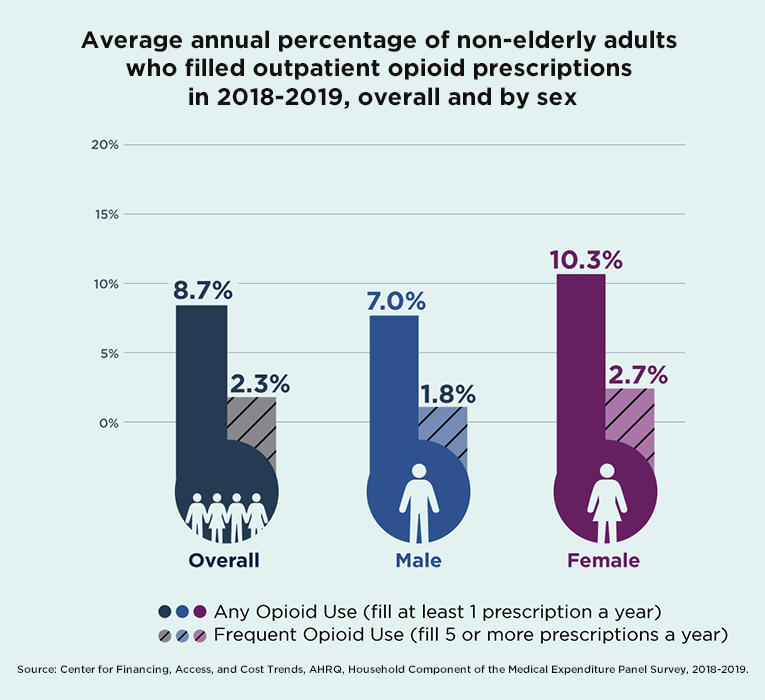
Average annual percentage of non-elderly adults who filled
outpatient opioid prescriptions in 2018-2019, overall and by sex
| Overall |
Male |
Female |
| Any Opioid Use |
Frequent Opioid Use |
Any Opioid Use |
Frequent Opioid Use |
Any Opioid Use |
Frequent Opioid Use |
| 8.7% |
2.3% |
7.0% |
1.8% |
10.3% |
2.7% |
Source: Center for Financing, Access, and Cost Trends, AHRQ, Household Component of the
Medical Expenditure Panel Survey, 2018-2019.
- Opioids are medicines commonly used to treat pain.
- In the U.S., 8.7% of people age 18-64 fill at least one opioid prescription a year.
Less than 2.5% are more frequent users—they fill 5 or more prescriptions a year.
- Women are more likely to use opioids in general, and to use them more often.
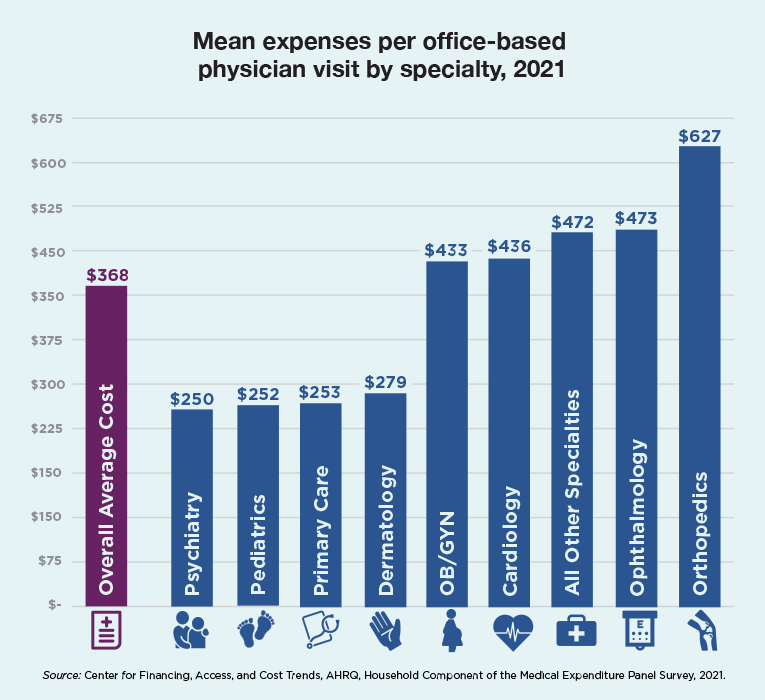
Mean expenses per office-based physician visit by specialty, 2021
| Specialty |
Expenditures |
| Overall Average Cost |
$368 |
| Psychiatry |
$250 |
| Pediatrics |
$252 |
| Primary Care |
$253 |
| Dermatology |
$279 |
| OB/GYN |
$433 |
| Cardiology |
$436 |
| All Other Specialties |
$472 |
| Ophthalmology |
$473 |
| Orthopedics |
$627 |
Source: Center for Financing, Access, and Cost Trends, AHRQ, Household Component of the
Medical Expenditure Panel Survey, 2021.
- On average, a doctor’s office visit in the U.S. costs $368. That cost includes how
much your insurance coverage—public or private—paid for, and how much you paid out of pocket
- The cost depends on the type of doctor you go to. As you can see here, there’s a wide range.
- Going to a pediatrician, psychiatrist, primary care, or dermatology provider costs less than
average.
- Going to a specialist like an ophthalmologist (eye doctor) or cardiologist (heart doctor) costs more than
average
- Going to an orthopedist (doctors who treat bone injuries) costs the most—at $627
per visit.
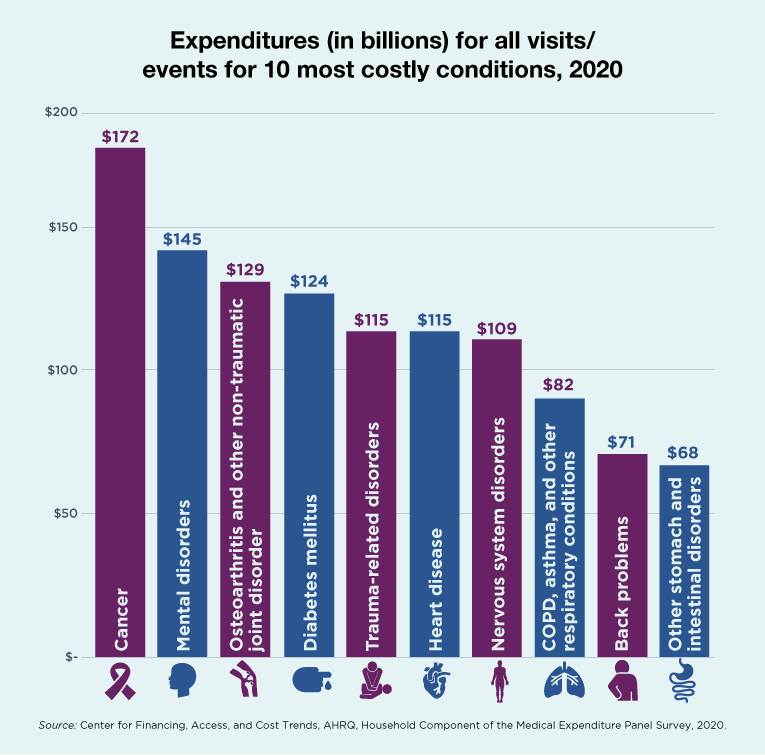
Expenditures (in billions) for all visits/events for 10 most costly conditions, 2020
| Conditions |
Expenditures
(in billions) |
| Cancer |
$172 |
| Mental disorders |
$145 |
| Osteoarthritis and other non-traumatic joint disorder |
$129 |
| Diabetes mellitus |
$124 |
| Trauma-related disorders |
$115 |
| Heart disease |
$115 |
| Nervous system disorders |
$109 |
| COPD, asthma, and other respiratory conditions |
$82 |
| Back problems |
$71 |
| Other stomach and intestinal disorders |
$68 |
Source: Center for Financing, Access, and Cost Trends, AHRQ, Household Component of the
Medical Expenditure Panel Survey, 2020.
- In 2020, cancer, mental disorders, osteoarthritis and other joint disorders, and diabetes were among the
top most costly conditions.
- The highest condition-related expenditure total was for the treatment of cancer ($172 billion). The other
conditions in order of expenditures were mental disorders ($145 billion), osteoarthritis and other joint
disorders ($129 billion), and diabetes ($124 billion).
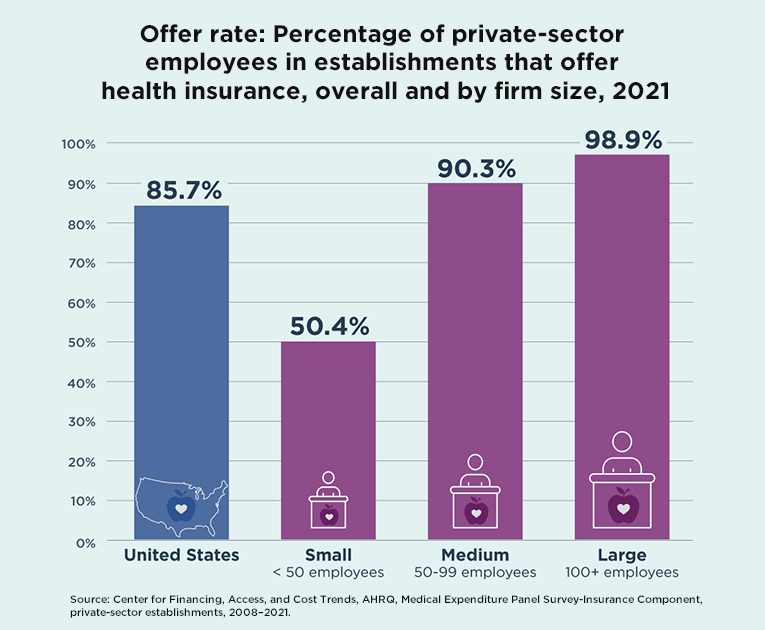
Offer rate: Percentage of private-sector employees in establishments that offer health insurance,
overall and by firm size, 2021
| Firm Size |
Percentage |
| United States (overall) |
85.7% |
| Small (< 50 employees) |
50.4% |
| Medium (50-99 employees) |
90.3% |
| Large (100+ employees) |
98.9% |
Source: Center for Financing, Access, and Cost Trends, AHRQ, Medical Expenditure Panel
Survey-Insurance Component, private-sector establishments, 2008–2021.
- Most people in the U.S.—nearly 86%—are offered health insurance by their
employer. This number hasn’t changed much in the last 10 years.
- Large companies offer insurance to almost all their employees. This trend has also held steady since
2008.
- At small companies—with less than 50 employees—more than 60% of employees in
2008 were offered health insurance. By 2021, the number was down to 50%.
|
