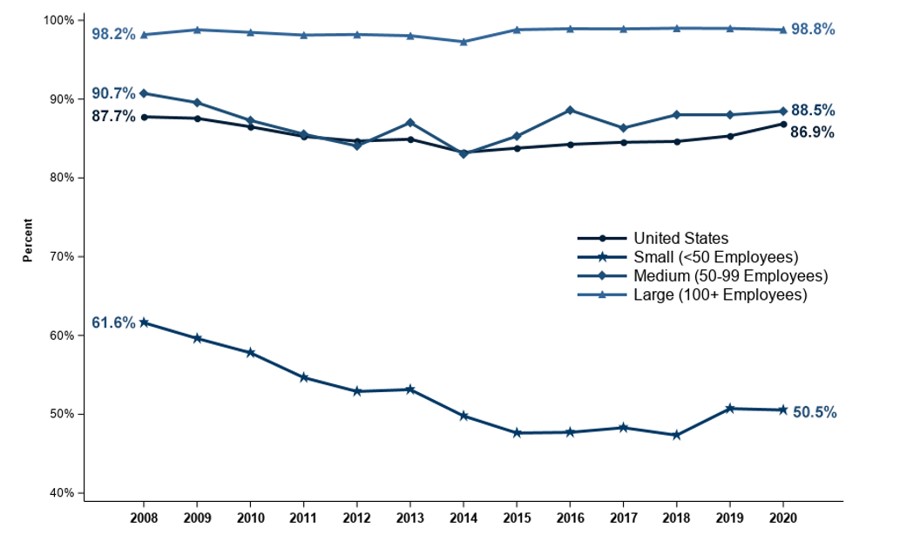
Figure 1. Percentage of private-sector employees in establishments that offer health insurance, by firm size, 2008-2020
Source: Medical Expenditure Panel Survey-Insurance Component, private-sector establishments, 2008–2020.
Figure 1. Percentage (standard error) of private-sector employees in establishments that offer health insurance, by firm size, 2008-2020
TABLE SUMMARY TABLE SUMMARY
Number of Employees
2008
2009
2010
2011
2012
2013
2014
2015
2016
2017
2018
2019
2020
U.S.
87.7%
87.6%
86.5%
85.3%
84.7%
84.9%
83.2%
83.8%
84.3%
84.5%
84.6%
85.3%
86.9%
(Standard Error)
(0.3%)
(0.2%)
(0.2%)
(0.2%)
(0.3%)
(0.3%)
(0.3%)
(0.2%)
(0.2%)
(0.2%)
(0.2%)
(0.2%)
(0.2%)
<50
61.6%
59.6%
57.8%
54.7%
52.9%
53.1%
49.8%
47.6%
47.7%
48.3%
47.3%
50.7%
50.5%
(Standard Error)
(0.5%)
(0.5%)
(0.5%)
(0.4%)
(0.6%)
(0.7%)
(0.6%)
(0.6%)
(0.6%)
(0.6%)
(0.6%)
(0.7%)
(0.7%)
50–99
90.7%
89.6%
87.3%
85.6%
84.1%
87.0%
83.0%
85.3%
88.6%
86.3%
88.0%
88.0%
88.5%
(Standard Error)
(0.9%)
(1.3%)
(0.9%)
(1.0%)
(1.4%)
(1.0%)
(1.3%)
(1.2%)
(1.0%)
(1.2%)
(1.1%)
(1.1%)
(1.2%)
100+
98.2%
98.8%
98.5%
98.1%
98.2%
98.0%
97.3%
98.8%
98.9%
98.9%
99.0%
99.0%
98.8%
(Standard Error)
(0.3%)
(0.1%)
(0.2%)
(0.2%)
(0.2%)
(0.2%)
(0.2%)
(0.2%)
(0.1%)
(0.2%)
(0.2%)
(0.1%)
(0.2%)
Source: Medical Expenditure Panel Survey-Insurance Component, private-sector establishments, 2008–2020.
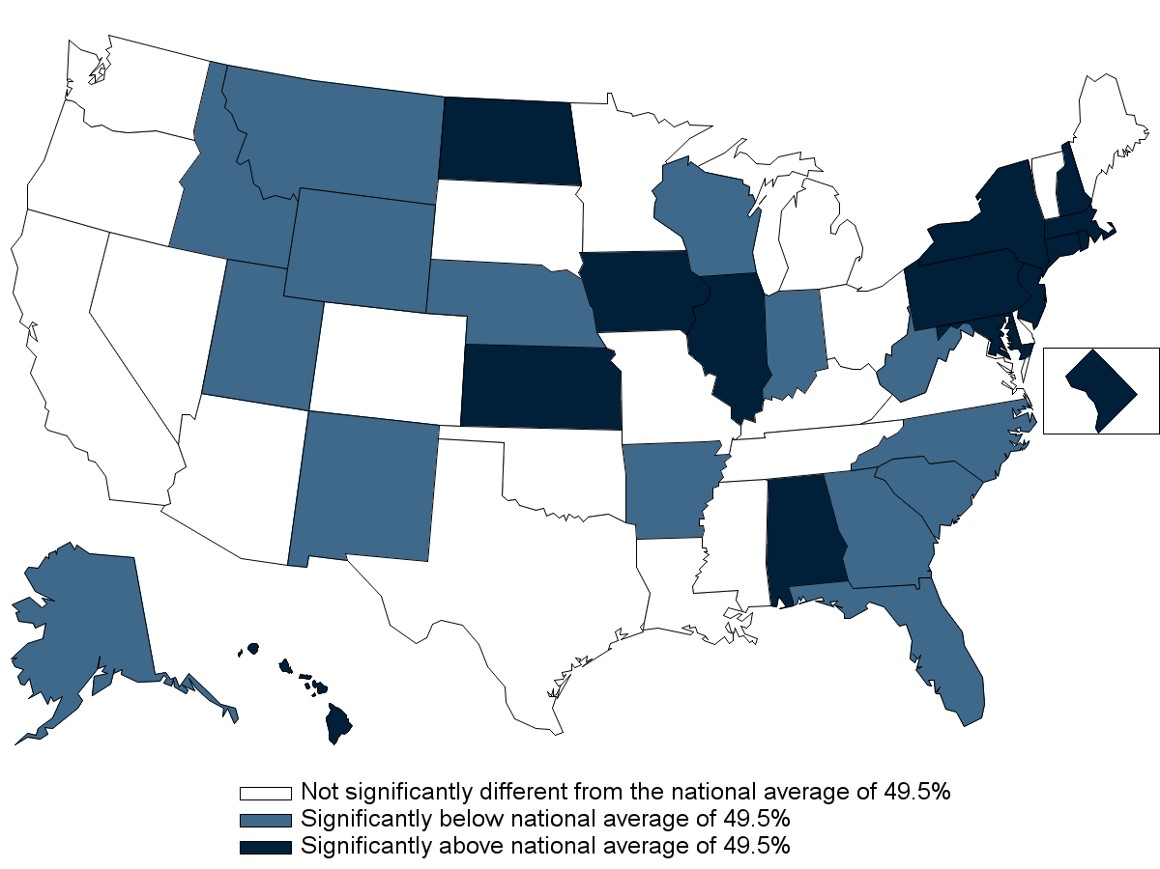
Figure 2. Percentage (standard error) of private-sector employees in establishments that offer health insurance, by State, firm size < 50 employees, 3-year average, 2018-2020
Source: Medical Expenditure Panel Survey-Insurance Component, private-sector establishments, 2008-2020.
Figure 2. Percentage (standard error) of private-sector employees in establishments that offer health insurance, by State, firm size < 50 employees, 3-year average, 2018-2020
TABLE SUMMARY TABLE SUMMARY
State
Percentage
State
Percentage
State
Percentage
Alabama
54.9%*
Kentucky
49.4%
North Dakota
56.3%*
(Standard Error)
(2.3%)
(Standard Error)
(2.6%)
(Standard Error)
(2.1%)
Alaska
35.5%*
Louisiana
50.2%
Ohio
50.0%
(Standard Error)
(2.3%)
(Standard Error)
(2.5%)
(Standard Error)
(2.4%)
Arizona
45.5%
Maine
45.0%
Oklahoma
50.2%
(Standard Error)
(2.7%)
(Standard Error)
(2.4%)
(Standard Error)
(2.3%)
Arkansas
40.4%*
Maryland
56.8%*
Oregon
48.2%
(Standard Error)
(2.5%)
(Standard Error)
(2.4%)
(Standard Error)
(2.1%)
California
50.2%
Massachusetts
62.5%*
Pennsylvania
55.6%*
(Standard Error)
(1.4%)
(Standard Error)
(2.5%)
(Standard Error)
(1.9%)
Colorado
46.1%
Michigan
50.5%
Rhode Island
56.1%*
(Standard Error)
(2.4%)
(Standard Error)
(2.3%)
(Standard Error)
(2.5%)
Connecticut
57.8%*
Minnesota
49.2%
South Carolina
40.8%*
(Standard Error)
(2.3%)
(Standard Error)
(2.4%)
(Standard Error)
(2.4%)
Delaware
50.5%
Mississippi
45.6%
South Dakota
50.1%
(Standard Error)
(2.9%)
(Standard Error)
(2.6%)
(Standard Error)
(2.1%)
District of Columbia
70.4%*
Missouri
49.2%
Tennessee
48.3%
(Standard Error)
(2.6%)
(Standard Error)
(2.4%)
(Standard Error)
(2.5%)
Florida
41.7%*
Montana
37.6%*
Texas
47.4%
(Standard Error)
(2.1%)
(Standard Error)
(2.1%)
(Standard Error)
(1.7%)
Georgia
41.1%*
Nebraska
41.2%*
Utah
38.1%*
(Standard Error)
(2.5%)
(Standard Error)
(2.3%)
(Standard Error)
(2.5%)
Hawaii
90.2%*
Nevada
51.3%
Vermont
46.1%
(Standard Error)
(1.3%)
(Standard Error)
(2.9%)
(Standard Error)
(2.0%)
Idaho
39.9%*
New Hampshire
55.3%*
Virginia
50.8%
(Standard Error)
(2.3%)
(Standard Error)
(2.3%)
(Standard Error)
(2.3%)
Illinois
53.7%*
New Jersey
57.1%*
Washington
50.1%
(Standard Error)
(2.0%)
(Standard Error)
(2.3%)
(Standard Error)
(2.2%)
Indiana
43.9%*
New Mexico
40.9%*
West Virginia
44.1%*
(Standard Error)
(2.4%)
(Standard Error)
(2.3%)
(Standard Error)
(2.6%)
Iowa
54.2%*
New York
55.7%*
Wisconsin
44.4%*
(Standard Error)
(2.2%)
(Standard Error)
(1.6%)
(Standard Error)
(2.3%)
Kansas
54.7%*
North Carolina
38.5%*
Wyoming
38.0%*
(Standard Error)
(2.3%)
(Standard Error)
(2.2%)
(Standard Error)
(2.1%)
Source: Medical Expenditure Panel Survey-Insurance Component, private-sector establishments, 2018-2020.
Note: * Statistically different from the national average of 49.5 percent at p < 0.05. Note that the standard error on the national estimate of 49.5 percent is 0.39 percent.
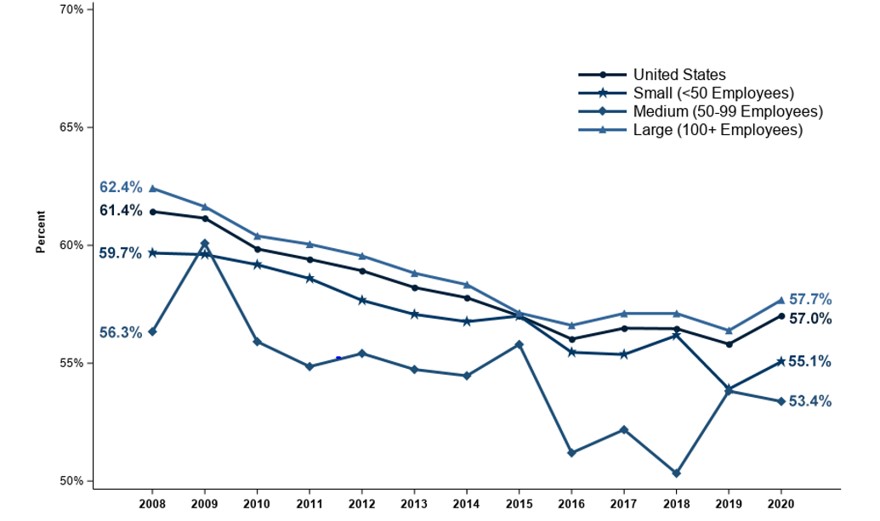
Figure 3. Coverage Rate Percentage of private-sector employees who are enrolled in health insurance at establishments that offer health insurance, overall and by firm size, 2008-2020
Source: Medical Expenditure Panel Survey-Insurance Component, private-sector establishments, 2008-2020.
Denominator: Within each category, all employees in establishments that offer health insurance.
Figure 3. Coverage Rate Percentage (standard error) of private-sector employees who are enrolled in health insurance at establishments that offer health insurance, overall and by firm size, 2008-2020
TABLE SUMMARY TABLE SUMMARY
Number of Employees
2008
2009
2010
2011
2012
2013
2014
2015
2016
2017
2018
2019
2020
U.S.
61.4%
61.1%
59.8%
59.4%
58.9%
58.2%
57.8%
57.0%
56.0%
56.5%
56.5%
55.8%
57.0%
(Standard Error)
(0.4%)
(0.4%)
(0.5%)
(0.2%)
(0.4%)
(0.3%)
(0.4%)
(0.4%)
(0.4%)
(0.4%)
(0.4%)
(0.5%)
(0.4%)
<50
59.7%
59.6%
59.2%
58.6%
57.7%
57.1%
56.8%
57.0%
55.5%
55.4%
56.2%
53.9%
55.1%
(Standard Error)
(0.2%)
(0.4%)
(0.6%)
(0.5%)
(0.5%)
(0.5%)
(0.6%)
(0.6%)
(0.6%)
(0.6%)
(0.6%)
(0.6%)
(0.7%)
50–99
56.3%
60.1%
55.9%
54.9%
55.4%
54.7%
54.5%
55.8%
51.2%
52.2%
50.3%
53.8%
53.4%
(Standard Error)
(1.0%)
(1.0%)
(0.8%)
(1.0%)
(1.2%)
(0.8%)
(1.3%)
(1.2%)
(1.2%)
(1.2%)
(1.2%)
(1.2%)
(1.3%)
100+
62.4%
61.6%
60.4%
60.0%
59.5%
58.8%
58.3%
57.1%
56.6%
57.1%
57.1%
56.4%
57.7%
(Standard Error)
(0.5%)
(0.6%)
(0.6%)
(0.3%)
(0.4%)
(0.3%)
(0.5%)
(0.5%)
(0.5%)
(0.5%)
(0.5%)
(0.6%)
(0.5%)
Source: Medical Expenditure Panel Survey-Insurance Component, private-sector establishments, 2008–2020.
Denominator: Within each category, all employees in establishments that offer health insurance.
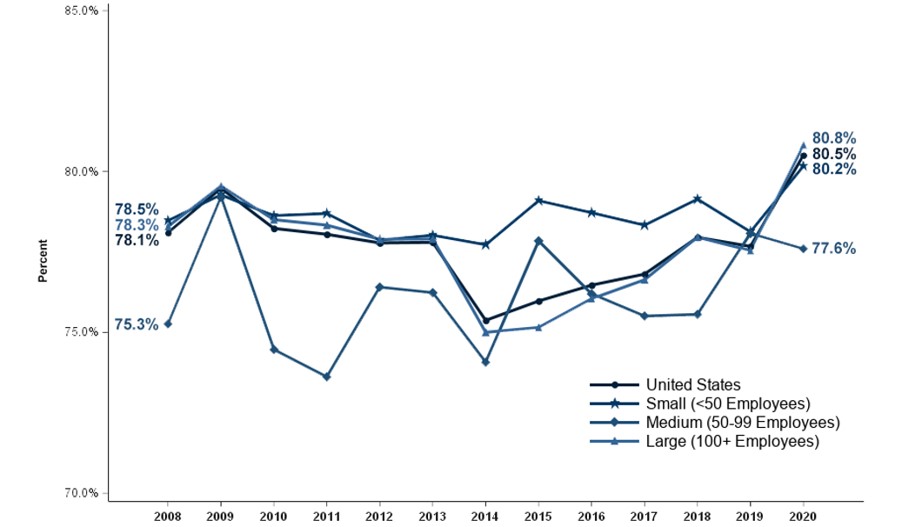
Figure 4. Percentage (standard error) of private-sector employees eligible for health insurance at establishments that offer health insurance, overall and by firm size, 2008–2020.
Source: Medical Expenditure Panel Survey-Insurance Component, private-sector establishments, 2008–2020.
Denominator: Within each category, all employees in establishments that offer health insurance.
Figure 4. Percentage (standard error) of private-sector employees eligible for health insurance at establishments that offer health insurance, overall and by firm size, 2008–2020
TABLE SUMMARY TABLE SUMMARY
Number of Employees
2008
2009
2010
2011
2012
2013
2014
2015
2016
2017
2018
2019
2020
U.S.
78.1%
79.5%
78.2%
78.0%
77.8%
77.8%
75.4%
76.0%
76.5%
76.8%
78.0%
77.7%
80.5%
(Standard Error)
(0.4%)
(0.3%)
(0.5%)
(0.4%)
(0.3%)
(0.2%)
(0.4%)
(0.4%)
(0.4%)
(0.4%)
(0.4%)
(0.4%)
(0.4%)
<50
78.5%
79.3%
78.6%
78.7%
77.9%
78.0%
77.7%
79.1%
78.7%
78.3%
79.1%
78.1%
80.2%
(Standard Error)
(0.4%)
(0.5%)
(0.5%)
(0.6%)
(0.5%)
(0.4%)
(0.6%)
(0.6%)
(0.6%)
(0.6%)
(0.6%)
(0.6%)
(0.6%)
50–99
75.3%
79.2%
74.5%
73.6%
76.4%
76.2%
74.1%
77.8%
76.2%
75.5%
75.6%
78.1%
77.6%
(Standard Error)
(1.3%)
(0.8%)
(0.6%)
(1.0%)
(1.2%)
(0.8%)
(1.4%)
(1.2%)
(1.2%)
(1.2%)
(1.2%)
(1.2%)
(1.4%)
100+
78.3%
79.6%
78.5%
78.3%
77.9%
77.9%
75.0%
75.2%
76.0%
76.6%
78.0%
77.5%
80.8%
(Standard Error)
(0.4%)
(0.5%)
(0.6%)
(0.4%)
(0.3%)
(0.3%)
(0.5%)
(0.5%)
(0.4%)
(0.5%)
(0.5%)
(0.5%)
(0.5%)
Source: Medical Expenditure Panel Survey-Insurance Component, private-sector establishments, 2008–2020.
Denominator: Within each category, all employees in establishments that offer health insurance.
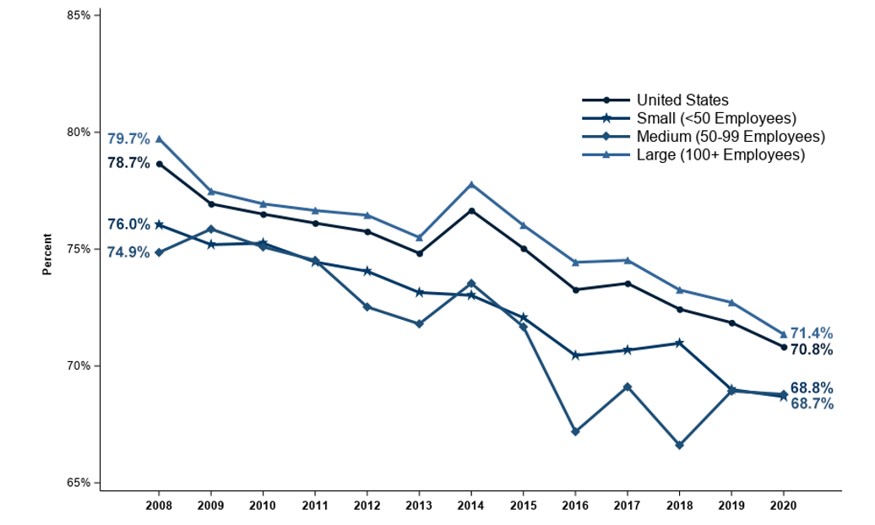
Figure 5. Take-Up Rate Percentage of eligible private-sector employees who are enrolled in health insurance at establishments that offer health insurance, overall and by firm size, 2008-2020
Source: Medical Expenditure Panel Survey-Insurance Component, private-sector establishments, 2008–2020.
Denominator: Within each category, eligible employees in establishments that offer health insurance.
Figure 5. Take-Up Rate Percentage (standard error) of eligible private-sector employees who are enrolled in health insurance at establishments that offer health insurance, overall and by firm size, 2008-2020
TABLE SUMMARY TABLE SUMMARY
Number of Employees
2008
2009
2010
2011
2012
2013
2014
2015
2016
2017
2018
2019
2020
U.S.
78.7%
76.9%
76.5%
76.1%
75.8%
74.8%
76.7%
75.0%
73.3%
73.5%
72.4%
71.9%
70.8%
(Standard Error)
(0.3%)
(0.3%)
(0.2%)
(0.3%)
(0.3%)
(0.2%)
(0.3%)
(0.3%)
(0.3%)
(0.3%)
(0.4%)
(0.4%)
(0.4%)
<50
76.0%
75.2%
75.3%
74.4%
74.1%
73.1%
73.0%
72.1%
70.4%
70.7%
71.0%
69.0%
68.7%
(Standard Error)
(0.3%)
(0.3%)
(0.6%)
(0.4%)
(0.4%)
(0.6%)
(0.5%)
(0.5%)
(0.5%)
(0.6%)
(0.6%)
(0.6%)
(0.6%)
50–99
74.9%
75.9%
75.1%
74.5%
72.5%
71.8%
73.5%
71.7%
67.2%
69.1%
66.6%
68.9%
68.8%
(Standard Error)
(0.5%)
(0.9%)
(0.7%)
(0.6%)
(0.8%)
(1.0%)
(1.0%)
(1.1%)
(1.2%)
(1.1%)
(1.1%)
(1.0%)
(1.0%)
100+
79.7%
77.5%
76.9%
76.7%
76.4%
75.5%
77.8%
76.0%
74.4%
74.5%
73.3%
72.7%
71.4%
(Standard Error)
(0.4%)
(0.5%)
(0.3%)
(0.3%)
(0.4%)
(0.3%)
(0.3%)
(0.3%)
(0.4%)
(0.4%)
(0.4%)
(0.5%)
(0.4%)
Source: Medical Expenditure Panel Survey-Insurance Component, private-sector establishments, 2008–2020.
Denominator: Within each category, eligible employees in establishments that offer health insurance.
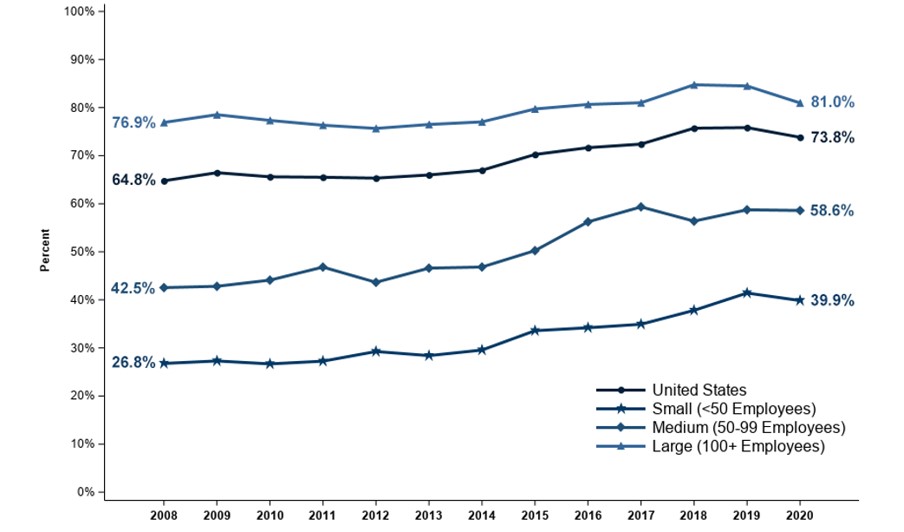
Figure 6. Percentage of private-sector employees working in establishments that offer two or more health insurance plans, overall and by firm size, 2008-2020
Source: Medical Expenditure Panel Survey-Insurance Component, private-sector establishments, 2008–2020.
Denominator: Within each category, all employees in establishments that offer health insurance.
Figure 6. Percentage (standard error) of private-sector working in establishments that offer two or more health insurance plans, overall and by firm size, 2008–2020
TABLE SUMMARY TABLE SUMMARY
Number of Employees
2008
2009
2010
2011
2012
2013
2014
2015
2016
2017
2018
2019
2020
U.S.
64.8%
66.5%
65.6%
65.5%
65.3%
66.0%
67.0%
70.2%
71.7%
72.4%
75.7%
75.8%
73.8%
(Standard Error)
(0.6%)
(0.7%)
(0.8%)
(0.5%)
(0.7%)
(0.6%)
(0.6%)
(0.5%)
(0.5%)
(0.5%)
(0.5%)
(0.5%)
(0.6%)
<50
26.8%
27.3%
26.7%
27.2%
29.3%
28.4%
29.6%
33.6%
34.2%
34.9%
37.8%
41.4%
39.9%
(Standard Error)
(0.7%)
(0.9%)
(0.8%)
(0.9%)
(0.8%)
(1.0%)
(0.9%)
(1.1%)
(1.0%)
(1.0%)
(1.0%)
(1.1%)
(1.1%)
50–99
42.5%
42.8%
44.1%
46.8%
43.7%
46.6%
46.8%
50.2%
56.2%
59.3%
56.4%
58.7%
58.6%
(Standard Error)
(1.7%)
(2.0%)
(1.9%)
(2.2%)
(1.7%)
(2.2%)
(2.1%)
(2.2%)
(2.0%)
(1.9%)
(1.9%)
(2.0%)
(2.1%)
100+
76.9%
78.5%
77.3%
76.3%
75.7%
76.5%
77.0%
79.7%
80.7%
81.0%
84.7%
84.5%
81.0%
(Standard Error)
(0.7%)
(0.7%)
(1.0%)
(0.7%)
(0.7%)
(0.7%)
(0.6%)
(0.6%)
(0.6%)
(0.6%)
(0.5%)
(0.6%)
(0.6%)
Source: Medical Expenditure Panel Survey-Insurance Component, private-sector establishments, 2008–2020.
Denominator: Within each category, all employees in establishments that offer health insurance.
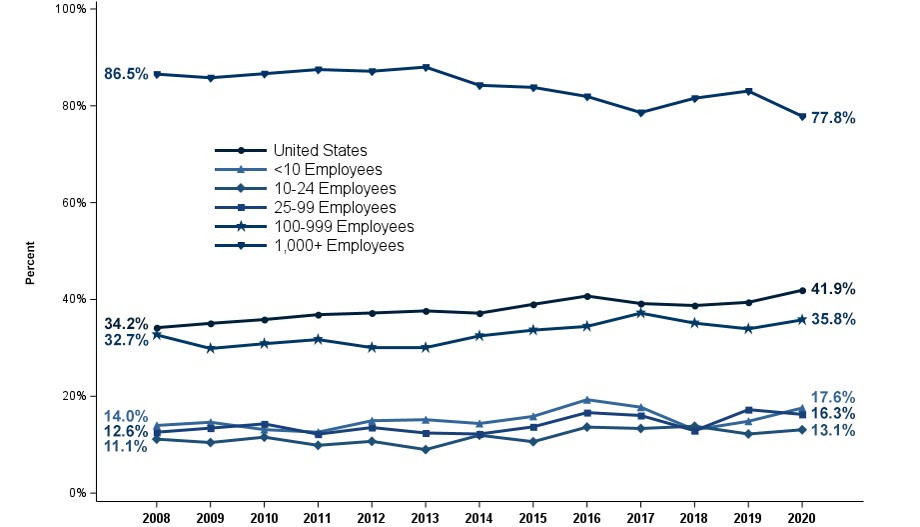
Figure 7. Percentage of private-sector establishments that offer health insurance that self-insure at least one plan, overall and by detailed firm size, 2008-2020
Source: Medical Expenditure Panel Survey-Insurance Component, private-sector establishments, 2008–2020.
Figure 7. Percentage (standard error) of private-sector establishments that offer health insurance that self-insure at least one plan, overall and by detailed firm size, 2008-2020
TABLE SUMMARY TABLE SUMMARY
Number of Employees
2008
2009
2010
2011
2012
2013
2014
2015
2016
2017
2018
2019
2020
U.S.
34.2%
35.1%
35.8%
36.9%
37.2%
37.6%
37.2%
39.0%
40.7%
39.2%
38.7%
39.4%
41.9%
(Standard Error)
(0.4%)
(0.4%)
(0.5%)
(0.5%)
(0.5%)
(0.5%)
(0.5%)
(0.5%)
(0.6%)
(0.6%)
(0.6%)
(0.6%)
(0.7%)
<10
14.0%
14.6%
13.1%
12.6%
14.9%
15.2%
14.4%
15.8%
19.3%
17.7%
13.1%
14.8%
17.6%
(Standard Error)
(0.8%)
(0.7%)
(0.5%)
(0.8%)
(0.9%)
(0.4%)
(0.8%)
(1.0%)
(1.4%)
(1.4%)
(1.1%)
(1.3%)
(1.7%)
10–24
11.1%
10.4%
11.6%
9.9%
10.7%
9.0%
12.0%
10.6%
13.6%
13.3%
13.8%
12.2%
13.1%
(Standard Error)
(0.9%)
(0.4%)
(0.8%)
(0.7%)
(0.7%)
(0.7%)
(1.0%)
(1.0%)
(1.1%)
(1.2%)
(1.2%)
(1.1%)
(1.2%)
25–99
12.6%
13.4%
14.3%
12.2%
13.5%
12.4%
12.2%
13.7%
16.6%
16.0%
12.9%
17.2%
16.3%
(Standard Error)
(0.8%)
(0.7%)
(0.7%)
(0.7%)
(0.7%)
(0.7%)
(0.8%)
(0.9%)
(0.9%)
(0.9%)
(0.8%)
(0.9%)
(0.9%)
100–999
32.7%
29.9%
30.9%
31.7%
30.1%
30.1%
32.5%
33.7%
34.4%
37.2%
35.1%
33.9%
35.8%
(Standard Error)
(1.3%)
(0.7%)
(0.9%)
(1.1%)
(0.8%)
(1.0%)
(1.2%)
(1.2%)
(1.2%)
(1.3%)
(1.2%)
(1.1%)
(1.2%)
1,000+
86.5%
85.8%
86.6%
87.5%
87.1%
88.0%
84.2%
83.8%
81.9%
78.6%
81.6%
83.1%
77.8%
(Standard Error)
(0.5%)
(0.4%)
(0.6%)
(0.5%)
(0.7%)
(0.5%)
(0.8%)
(0.8%)
(0.8%)
(0.8%)
(0.8%)
(0.8%)
(0.9%)
Source: Medical Expenditure Panel Survey-Insurance Component, private-sector establishments, 2008–2020.
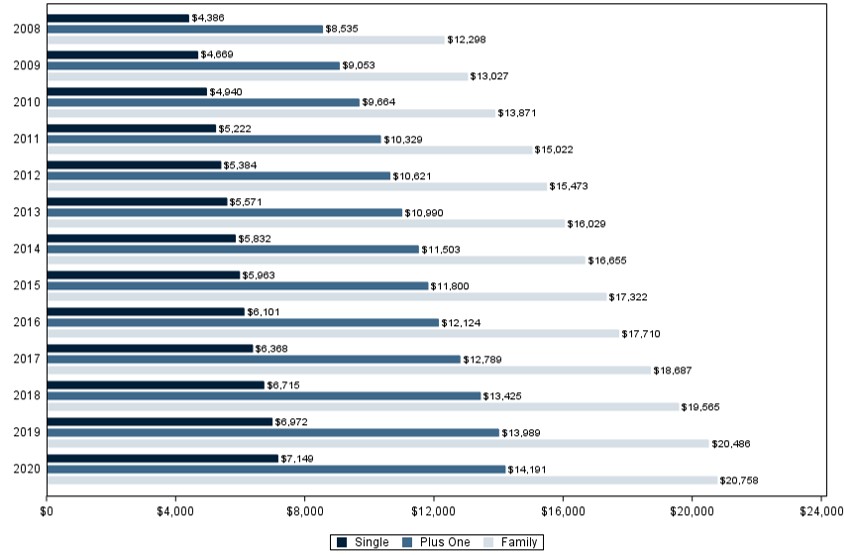
Figure 8. Average total premiums (standard error) per enrolled employee for single, employee-plus-one and family coverage, 2008-2020
Source: Medical Expenditure Panel Survey-Insurance Component, private-sector establishments, 2008–2020.
Figure 8. Average total premiums (standard error) per enrolled employee for single, employee-plus-one and family coverage, 2008-2020
TABLE SUMMARY TABLE SUMMARY
Coverage
2008
2009
2010
2011
2012
2013
2014
2015
2016
2017
2018
2019
2020
Single
$4,386
$4,669
$4,940
$5,222
$5,384
$5,571
$5,832
$5,963
$6,101
$6,368
$6,715
$6,972
$7,149
(Standard Error)
($15)
($21)
($22)
($26)
($28)
($23)
($25)
($26)
($27)
($28)
($31)
($35)
($35)
Plus One
$8,535
$9,053
$9,664
$10,329
$10,621
$10,990
$11,503
$11,800
$12,124
$12,789
$13,425
$13,989
$14,191
(Standard Error)
($43)
($34)
($60)
($105)
($56)
($54)
($60)
($58)
($60)
($70)
($70)
($83)
($93)
Family
$12,298
$13,027
$13,871
$15,022
$15,473
$16,029
$16,655
$17,322
$17,710
$18,687
$19,565
$20,486
$20,758
(Standard Error)
($81)
($25)
($75)
($98)
($95)
($61)
($79)
($95)
($84)
($105)
($104)
($125)
($124)
Source: Medical Expenditure Panel Survey-Insurance Component, private-sector establishments, 2008–2020.
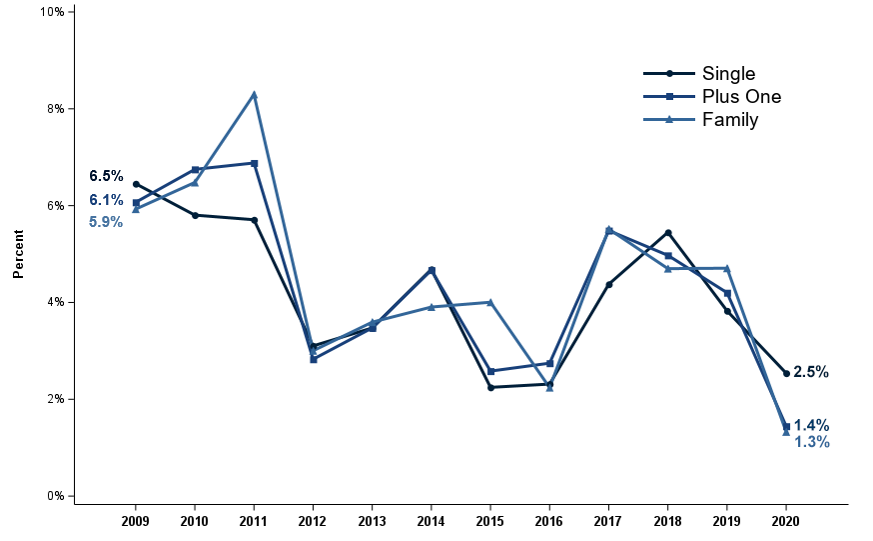
Figure 9. Percentage change (standard error) in total premiums from previous year per enrolled employee for single, employee-plus-one, and family coverage, 2009-2020
Source: Medical Expenditure Panel Survey-Insurance Component, private-sector establishments, 2008–2020.
Figure 9. Percentage change (standard error) in total premiums from previous year per enrolled employee for single, employee-plus-one, and family coverage, 2009–2020
TABLE SUMMARY TABLE SUMMARY
Year
Single
Employee-Plus-One
Family
2009
6.5%
6.1%
5.9%
(Standard Error)
(0.6%)
(0.7%)
(0.7%)
2010
5.8%
6.7%
6.5%
(Standard Error)
(0.7%)
(0.8%)
(0.6%)
2011
5.7%
6.9%
8.3%
(Standard Error)
(0.7%)
(1.3%)
(0.9%)
2012
3.1%
2.8%
3.0%
(Standard Error)
(0.7%)
(1.2%)
(0.9%)
2013
3.5%
3.5%
3.6%
(Standard Error)
(0.7%)
(0.7%)
(0.7%)
2014
4.7%
4.7%
3.9%
(Standard Error)
(0.6%)
(0.7%)
(0.6%)
2015
2.2%
2.6%
4.0%
(Standard Error)
(0.6%)
(0.7%)
(0.8%)
2016
2.3%
2.7%
2.2%
(Standard Error)
(0.6%)
(0.7%)
(0.7%)
2017
4.4%
5.5%
5.5%
(Standard Error)
(0.7%)
(0.8%)
(0.8%)
2018
5.4%
5.0%
4.7%
(Standard Error)
(0.7%)
(0.8%)
(0.8%)
2019
3.8%
4.2%
4.7%
(Standard Error)
(0.7%)
(0.8%)
(0.8%)
2020
2.5%
1.4%
1.3%
(Standard Error)
(0.7%)
(0.9%)
(0.9%)
Source: Medical Expenditure Panel Survey-Insurance Component, private-sector establishments, 2008–2020.
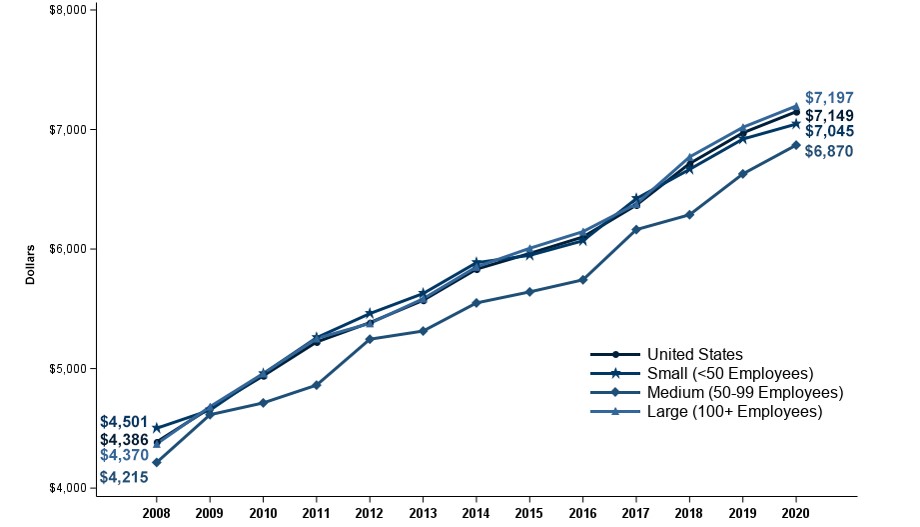
Figure 10. Average total single premium (standard error) per enrolled employee, by firm size, 2008-2020
Source: Medical Expenditure Panel Survey-Insurance Component, private-sector establishments, 2008–2020.
Figure 10. Average total single premium (standard error) per enrolled employee, by firm size, 2008–2020
TABLE SUMMARY TABLE SUMMARY
Number of Employees
2008
2009
2010
2011
2012
2013
2014
2015
2016
2017
2018
2019
2020
U.S.
$4,386
$4,669
$4,940
$5,222
$5,384
$5,571
$5,832
$5,963
$6,101
$6,368
$6,715
$6,972
$7,149
(Standard Error)
($15)
($21)
($22)
($26)
($28)
($23)
($25)
($26)
($27)
($28)
($31)
($35)
($35)
<50
$4,501
$4,652
$4,956
$5,258
$5,460
$5,628
$5,886
$5,947
$6,070
$6,421
$6,667
$6,920
$7,045
(Standard Error)
($31)
($31)
($34)
($39)
($60)
($39)
($55)
($55)
($53)
($61)
($63)
($73)
($70)
50–99
$4,215
$4,614
$4,713
$4,861
$5,246
$5,314
$5,549
$5,642
$5,743
$6,163
$6,287
$6,629
$6,870
(Standard Error)
($37)
($82)
($52)
($75)
($39)
($73)
($82)
($104)
($96)
($121)
($111)
($99)
($129)
100+
$4,370
$4,681
$4,959
$5,252
$5,378
$5,584
$5,851
$6,006
$6,146
$6,377
$6,770
$7,019
$7,197
(Standard Error)
($26)
($38)
($23)
($31)
($28)
($29)
($30)
($31)
($32)
($33)
($37)
($42)
($41)
Source: Medical Expenditure Panel Survey-Insurance Component, private-sector establishments, 2008–2020.
Figure 11. Average total employee-plus-one premium (standard error) per enrolled employee, by firm size, 2008-2020
Source: Medical Expenditure Panel Survey-Insurance Component, private-sector establishments, 2008–2020.
Figure 11. Average total employee-plus-one premium (standard error) per enrolled employee, by firm size, 2008-2020
TABLE SUMMARY TABLE SUMMARY
Number of Employees
2008
2009
2010
2011
2012
2013
2014
2015
2016
2017
2018
2019
2020
U.S.
$8,535
$9,053
$9,664
$10,329
$10,621
$10,990
$11,503
$11,800
$12,124
$12,789
$13,425
$13,989
$14,191
(Standard Error)
($43)
($34)
($60)
($105)
($56)
($54)
($60)
($58)
($60)
($70)
($70)
($83)
($93)
<50
$8,631
$9,124
$9,850
$10,253
$10,524
$11,050
$11,386
$11,666
$11,833
$12,558
$13,044
$13,619
$13,522
(Standard Error)
($110)
($119)
($80)
($104)
($121)
($92)
($163)
($158)
($156)
($170)
($176)
($248)
($212)
50–99
$8,421
$8,852
$9,166
$9,615
$10,178
$10,673
$10,845
$10,885
$11,389
$11,931
$12,593
$13,248
$13,766
(Standard Error)
($88)
($148)
($124)
($192)
($185)
($330)
($187)
($198)
($227)
($232)
($236)
($321)
($246)
100+
$8,527
$9,058
$9,669
$10,394
$10,672
$11,006
$11,571
$11,892
$12,225
$12,878
$13,537
$14,105
$14,304
(Standard Error)
($60)
($34)
($62)
($113)
($70)
($59)
($68)
($66)
($68)
($79)
($79)
($92)
($106)
Source: Medical Expenditure Panel Survey-Insurance Component, private-sector establishments, 2008–2020.
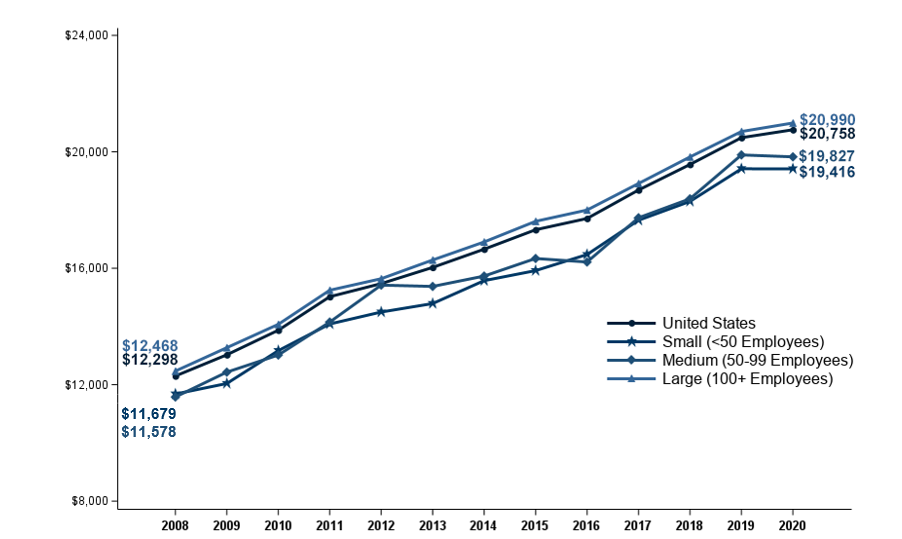
Figure 12. Average total family premium (standard error) per enrolled employee, by firm size, 2008-2020
Source: Medical Expenditure Panel Survey-Insurance Component, private-sector establishments, 2008–2020.
Figure 12. Average total family premium (standard error) per enrolled employee, by firm size, 2008-2020
TABLE SUMMARY TABLE SUMMARY
Number of Employees
2008
2009
2010
2011
2012
2013
2014
2015
2016
2017
2018
2019
2020
U.S.
$12,298
$13,027
$13,871
$15,022
$15,473
$16,029
$16,655
$17,322
$17,710
$18,687
$19,565
$20,486
$20,758
(Standard Error)
($81)
($25)
($75)
($98)
($95)
($61)
($79)
($95)
($84)
($105)
($104)
($125)
($124)
<50
$11,679
$12,041
$13,170
$14,086
$14,496
$14,787
$15,575
$15,919
$16,471
$17,649
$18,296
$19,417
$19,416
(Standard Error)
($182)
($129)
($111)
($145)
($181)
($89)
($177)
($212)
($207)
($192)
($231)
($303)
($283)
50–99
$11,578
$12,431
$13,019
$14,151
$15,421
$15,376
$15,732
$16,336
$16,214
$17,735
$18,386
$19,893
$19,827
(Standard Error)
($128)
($229)
($153)
($168)
($273)
($268)
($274)
($335)
($348)
($327)
($473)
($435)
($422)
100+
$12,468
$13,271
$14,074
$15,245
$15,641
$16,284
$16,903
$17,612
$18,000
$18,911
$19,824
$20,697
$20,990
(Standard Error)
($95)
($33)
($85)
($117)
($114)
($82)
($91)
($110)
($95)
($122)
($118)
($143)
($139)
Source: Medical Expenditure Panel Survey-Insurance Component, private-sector establishments, 2008–2020.
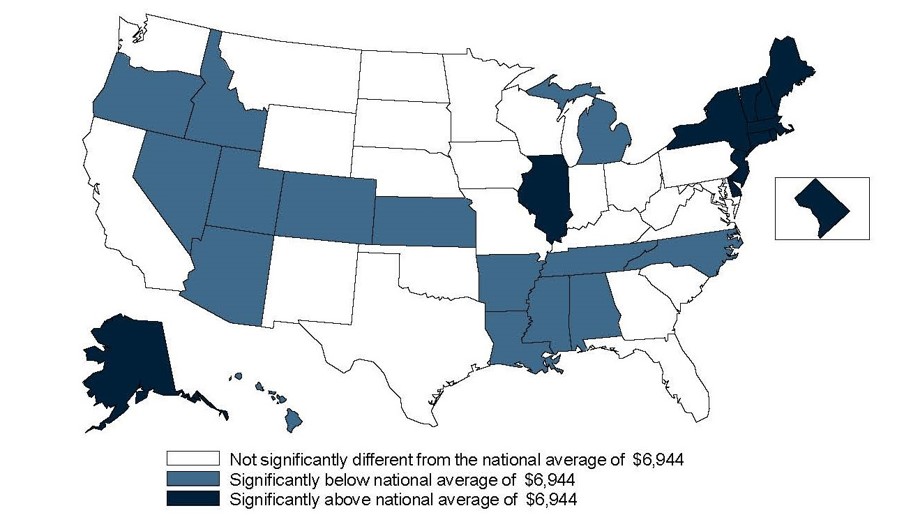
Figure 13. Average total single premium (standard error) per enrolled employee, by State, 3-year average, 2018-2020
Source: Medical Expenditure Panel Survey-Insurance Component, private-sector establishments, 2018-2020.
Figure 13. Average total single premium (standard error) per enrolled employee, by State, 3-year average, 2018-2020
TABLE SUMMARY TABLE SUMMARY
State
Average Premium
State
Average Premium
State
Average Premium
Alabama
$6,336*
Kentucky
$6,770
North Dakota
$6,841
(Standard Error)
($102)
(Standard Error)
($100)
(Standard Error)
($75)
Alaska
$8,672*
Louisiana
$6,666*
Ohio
$6,995
(Standard Error)
($206)
(Standard Error)
($106)
(Standard Error)
($98)
Arizona
$6,453*
Maine
$7,261*
Oklahoma
$6,807
(Standard Error)
($88)
(Standard Error)
($89)
(Standard Error)
($103)
Arkansas
$6,152*
Maryland
$7,048
Oregon
$6,669*
(Standard Error)
($107)
(Standard Error)
($116)
(Standard Error)
($113)
California
$6,884
Massachusetts
$7,477*
Pennsylvania
$7,059
(Standard Error)
($72)
(Standard Error)
($114)
(Standard Error)
($87)
Colorado
$6,662*
Michigan
$6,564*
Rhode Island
$7,208*
(Standard Error)
($94)
(Standard Error)
($100)
(Standard Error)
($81)
Connecticut
$7,426*
Minnesota
$6,865
South Carolina
$6,950
(Standard Error)
($104)
(Standard Error)
($108)
(Standard Error)
($95)
Delaware
$7,427*
Mississippi
$6,256*
South Dakota
$7,058
(Standard Error)
($151)
(Standard Error)
($91)
(Standard Error)
($86)
District of Columbia
$7,370*
Missouri
$6,875
Tennessee
$6,358*
(Standard Error)
($95)
(Standard Error)
($107)
(Standard Error)
($79)
Florida
$6,830
Montana
$6,871
Texas
$6,849
(Standard Error)
($113)
(Standard Error)
($99)
(Standard Error)
($77)
Georgia
$6,848
Nebraska
$7,007
Utah
$6,315*
(Standard Error)
($131)
(Standard Error)
($110)
(Standard Error)
($93)
Hawaii
$6,731*
Nevada
$6,365*
Vermont
$7,369*
(Standard Error)
($79)
(Standard Error)
($110)
(Standard Error)
($84)
Idaho
$6,428*
New Hampshire
$7,544*
Virginia
$6,780
(Standard Error)
($104)
(Standard Error)
($124)
(Standard Error)
($86)
Illinois
$7,217*
New Jersey
$7,554*
Washington
$6,996
(Standard Error)
($76)
(Standard Error)
($115)
(Standard Error)
($114)
Indiana
$7,016
New Mexico
$6,932
West Virginia
$6,988
(Standard Error)
($102)
(Standard Error)
($107)
(Standard Error)
($132)
Iowa
$6,791
New York
$7,937*
Wisconsin
$7,021
(Standard Error)
($94)
(Standard Error)
($105)
(Standard Error)
($94)
Kansas
$6,417*
North Carolina
$6,723*
Wyoming
$7,205
(Standard Error)
($93)
(Standard Error)
($72)
(Standard Error)
($133)
Source: Medical Expenditure Panel Survey-Insurance Component, private-sector establishments, 2018-2020.
Note: * Statistically different from national average of $6,944 at p < 0.05. Note that the standard error on the
national estimate of $6,944 is $19.
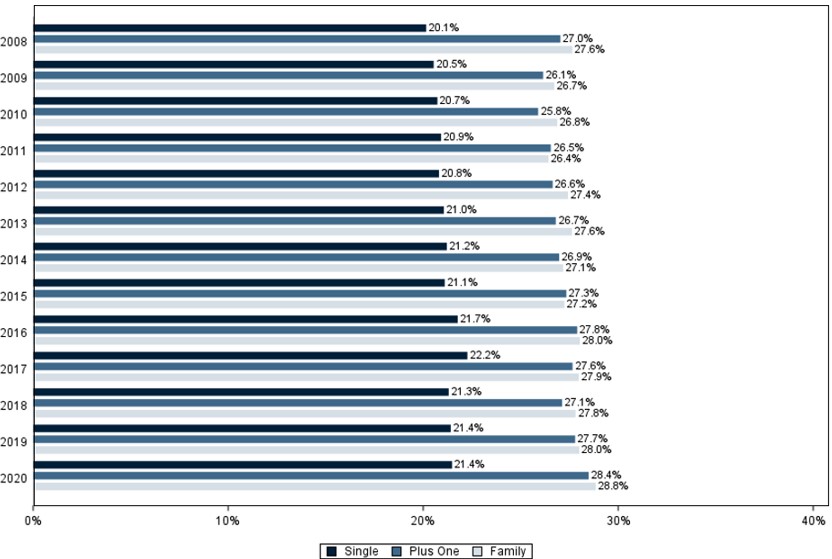
Figure 14. Average percentage of premium contributed by employees for single, employee-plus-one, and family coverage, 2008-2020
Source: Medical Expenditure Panel Survey-Insurance Component, private-sector establishments, 2008–2020.
Figure 14. Average percentage (standard error) of premium contributed by employees for single, employee-plus-one, and family coverage, 2008-2020
TABLE SUMMARY TABLE SUMMARY
Coverage
2008
2009
2010
2011
2012
2013
2014
2015
2016
2017
2018
2019
2020
Single
20.1%
20.5%
20.7%
20.9%
20.8%
21.0%
21.2%
21.1%
21.7%
22.2%
21.3%
21.4%
21.4%
(Standard Error)
(0.2%)
(0.3%)
(0.2%)
(0.2%)
(0.3%)
(0.3%)
(0.2%)
(0.2%)
(0.2%)
(0.2%)
(0.2%)
(0.3%)
(0.2%)
Plus One
27.0%
26.1%
25.8%
26.5%
26.6%
26.7%
26.9%
27.3%
27.8%
27.6%
27.1%
27.7%
28.4%
(Standard Error)
(0.3%)
(0.3%)
(0.3%)
(0.3%)
(0.4%)
(0.2%)
(0.3%)
(0.3%)
(0.3%)
(0.3%)
(0.3%)
(0.4%)
(0.4%)
Family
27.6%
26.7%
26.8%
26.4%
27.4%
27.6%
27.1%
27.2%
28.0%
27.9%
27.8%
28.0%
28.8%
(Standard Error)
(0.4%)
(0.3%)
(0.4%)
(0.3%)
(0.4%)
(0.3%)
(0.3%)
(0.3%)
(0.3%)
(0.4%)
(0.3%)
(0.4%)
(0.4%)
Source: Medical Expenditure Panel Survey-Insurance Component, private-sector establishments, 2008–2020.
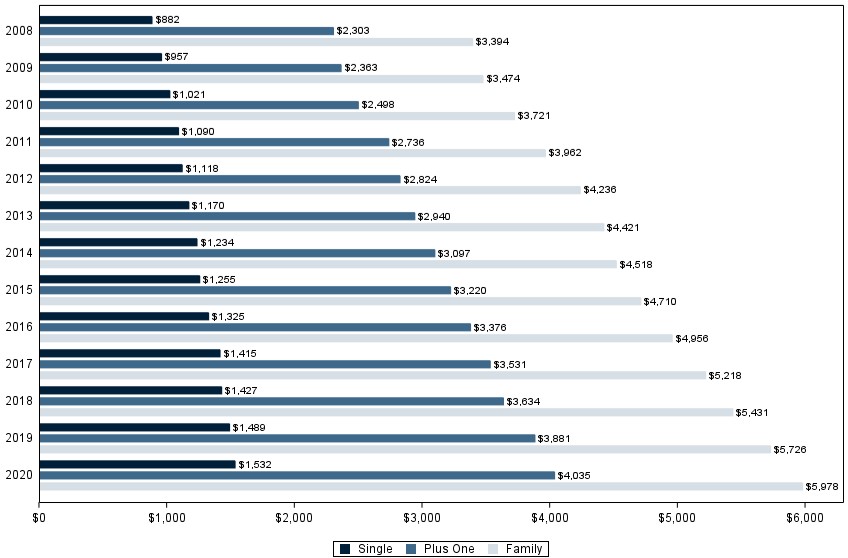
Figure 15. Average annual employee contribution (in dollars) (standard error) for single, employee-plus-one, and family coverage, 2008-2020
Source: Medical Expenditure Panel Survey-Insurance Component, private-sector establishments, 2008–2020.
Figure 15. Average annual employee contribution (in dollars) (standard error) for single, employee-plus-one, and family coverage, 2008-2020
TABLE SUMMARY TABLE SUMMARY
Coverage
2008
2009
2010
2011
2012
2013
2014
2015
2016
2017
2018
2019
2020
Single
$882
$957
$1,021
$1,090
$1,118
$1,170
$1,234
$1,255
$1,325
$1,415
$1,427
$1,489
$1,532
(Standard Error)
($6)
($13)
($14)
($9)
($14)
($16)
($13)
($14)
($13)
($15)
($14)
($18)
($16)
Plus One
$2,303
$2,363
$2,498
$2,736
$2,824
$2,940
$3,097
$3,220
$3,376
$3,531
$3,634
$3,881
$4,035
(Standard Error)
($22)
($27)
($42)
($36)
($46)
($23)
($40)
($35)
($36)
($39)
($39)
($54)
($52)
Family
$3,394
$3,474
$3,721
$3,962
$4,236
$4,421
$4,518
$4,710
$4,956
$5,218
$5,431
$5,726
$5,978
(Standard Error)
($54)
($44)
($53)
($42)
($69)
($50)
($48)
($56)
($56)
($64)
($63)
($82)
($76)
Source: Medical Expenditure Panel Survey-Insurance Component, private-sector establishments, 2008–2020.
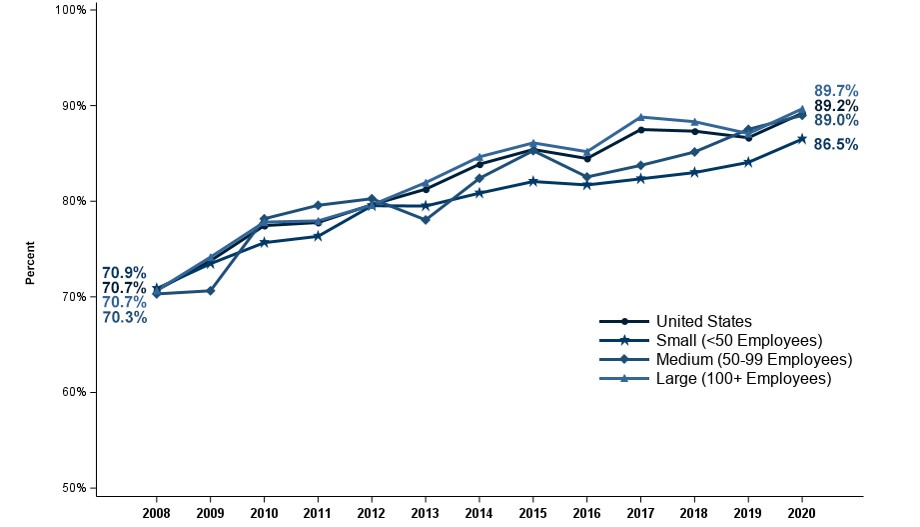
Figure 16. Percentage of private-sector enrolled employees in a health insurance plan with a deductible, overall and by firm size, 2008–2020
Source: Medical Expenditure Panel Survey-Insurance Component, private-sector establishments, 2008–2020.
Figure 16. Percentage (standard error) of private-sector enrolled employees in a health insurance plan with a deductible, overall and by firm size, 2008–2020
TABLE SUMMARY TABLE SUMMARY
Number of Employees
2008
2009
2010
2011
2012
2013
2014
2015
2016
2017
2018
2019
2020
U.S.
70.7%
73.8%
77.5%
77.8%
79.6%
81.3%
83.9%
85.4%
84.5%
87.5%
87.3%
86.6%
89.2%
(Standard Error)
(0.5%)
(0.5%)
(0.3%)
(0.7%)
(0.6%)
(0.7%)
(0.5%)
(0.5%)
(0.5%)
(0.4%)
(0.4%)
(0.5%)
(0.4%)
<50
70.9%
73.5%
75.7%
76.3%
79.5%
79.5%
80.8%
82.1%
81.7%
82.3%
83.0%
84.1%
86.5%
(Standard Error)
(0.7%)
(0.7%)
(0.7%)
(0.4%)
(1.0%)
(0.8%)
(0.8%)
(0.8%)
(0.8%)
(0.8%)
(0.8%)
(0.9%)
(0.8%)
50–99
70.3%
70.6%
78.2%
79.6%
80.3%
78.0%
82.4%
85.3%
82.5%
83.7%
85.1%
87.5%
89.0%
(Standard Error)
(1.4%)
(1.9%)
(1.5%)
(1.7%)
(1.4%)
(1.1%)
(1.5%)
(1.5%)
(1.5%)
(1.6%)
(1.4%)
(1.5%)
(1.5%)
100+
70.7%
74.2%
77.8%
77.9%
79.6%
81.9%
84.6%
86.1%
85.2%
88.8%
88.3%
87.1%
89.7%
(Standard Error)
(0.6%)
(0.6%)
(0.3%)
(1.0%)
(0.7%)
(0.7%)
(0.6%)
(0.6%)
(0.6%)
(0.4%)
(0.5%)
(0.5%)
(0.5%)
Source: Medical Expenditure Panel Survey-Insurance Component, private-sector establishments, 2008–2020.
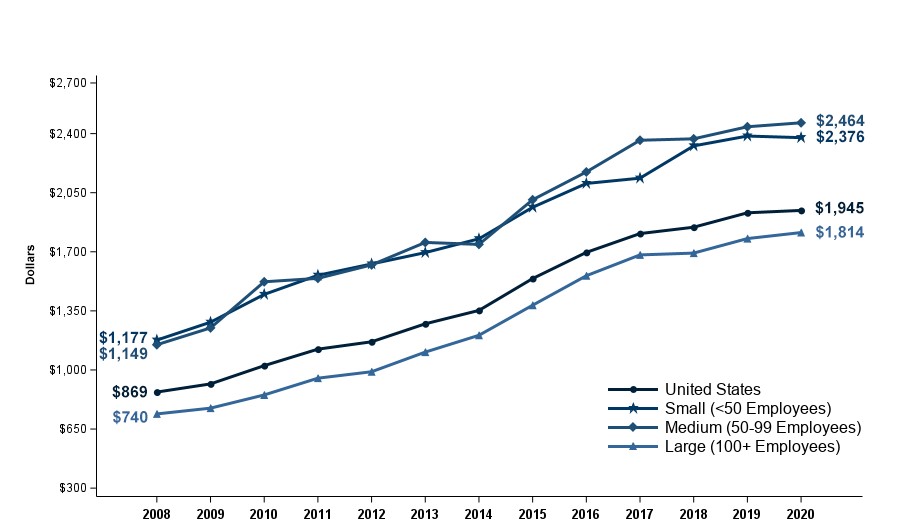
Figure 17. Average individual deductible (in dollars) per employee enrolled with single coverage in a health insurance plan with a deductible, overall and by firm size, 2008–2020
Source: Medical Expenditure Panel Survey-Insurance Component, private-sector establishments, 2008–2020.
Note: In 2015, the methodology for calibrating the upper edit bound for the individual deductible amount changed, causing the average individual deductible per employee enrolled with single coverage in a heath insurance plan with a deductible to increase by about 5 percent at the national level in 2015 relative to the earlier methodology.
Figure 17. Average individual deductible (in dollars) (standard error) per employee enrolled with single coverage in a health insurance plan with a deductible, overall and by firm size, 2008-2020
TABLE SUMMARY TABLE SUMMARY
Number of Employees
2008
2009
2010
2011
2012
2013
2014
2015
2016
2017
2018
2019
2020
U.S.
$869
$917
$1,025
$1,123
$1,167
$1,273
$1,353
$1,541
$1,696
$1,808
$1,846
$1,931
$1,945
(Standard Error)
($7)
($9)
($18)
($12)
($8)
($20)
($13)
($16)
($16)
($17)
($17)
($18)
($18)
<50
$1,177
$1,283
$1,447
$1,561
$1,628
$1,695
$1,777
$1,964
$2,105
$2,136
$2,327
$2,386
$2,376
(Standard Error)
($13)
($24)
($21)
($26)
($25)
($24)
($28)
($35)
($34)
($35)
($36)
($35)
($39)
50–99
$1,149
$1,249
$1,522
$1,543
$1,622
$1,755
$1,744
$2,008
$2,173
$2,361
$2,369
$2,441
$2,464
(Standard Error)
($62)
($46)
($57)
($49)
($64)
($49)
($59)
($62)
($64)
($85)
($65)
($67)
($67)
100+
$740
$774
$852
$951
$989
$1,106
$1,205
$1,383
$1,558
$1,681
$1,692
$1,778
$1,814
(Standard Error)
($8)
($7)
($20)
($14)
($10)
($19)
($14)
($18)
($18)
($20)
($19)
($21)
($20)
Source: Medical Expenditure Panel Survey-Insurance Component, private-sector establishments, 2008–2020.
Note: In 2015, the methodology for calibrating the upper edit bound for the individual deductible amount changed, causing the
average individual deductible per employee enrolled with single coverage in a health insurance plan with a deductible to increase by
about 5 percent at the national level in 2015 relative to the earlier methodology.