Research
Findings #12: Health Care Expenses in the United States, 1996
Joel W. Cohen, Ph.D., Steven R. Machlin, M.S.,
Samuel H. Zuvekas, Ph.D., Marie N. Stagnitti, M.P.A., and Joshua
M. Thorpe, M.P.H., Agency for Healthcare Research and Quality
Abstract
This report from the Agency for Healthcare Research and Quality presents
descriptive data on health care spending in the United States. Data come
from the 1996 Medical Expenditure Panel Survey (MEPS) and cover the
civilian noninstitutionalized U.S. population. Information is given on
total health care expenses combined and also for hospital inpatient
services, ambulatory services, prescription medicines, dental services,
home health services, and other medical equipment and supplies. The
proportion of people with expenses; mean and median expenses; and the
proportion of expenses paid by various sources, including out-of-pocket,
Medicare, Medicaid, and private insurance, are shown for each type of
service. In addition, distributions of expenses and sources of payment
across the population are examined by selected demographic,
socioeconomic, and health insurance characteristics.
^top
Introduction
The Medical Expenditure Panel Survey (MEPS)
is the Nation's primary source of detailed, nationally representative
data on medical care spending and sources of payment for the civilian
noninstitutionalized population of the United States. One of the
main objectives of the survey is to provide researchers and policymakers
with data on the types of health care services Americans use, how
frequently they use them, how much is paid for those services,
and who pays what portion of the payments. Detailed information
of this sort has not been available since the data from the 1987
National Medical Expenditure Survey (NMES) were released in the
early 1990s (for example, Hahn and Lefkowitz, 1992). Since that
time, the health care system in the United States has undergone
tremendous change, making the need for updated expenditure data
critical. The rapid evolution of managed care, improvements in
medical technologies and medical practices, changes in reimbursement
mechanisms, changes in the social insurance and safety net system,
and increases in the number of uninsured have all contributed to
changes in aggregate health care spending. In addition, these factors
have contributed to changes in the distribution of expenses and
sources of payments across the population.
This report presents
descriptive data on spending in 1996 for hospital, office-based,
home health, and other types
of care by source of payment and characteristics of users. Data
for all types of health care combined and for each type of service
are presented: the proportion of people with expenses; mean and
median expenses; and the proportion of expenses paid by various
sources, including out-of-pocket, Medicare, Medicaid, and private
insurance. In addition, distributions of expenses and sources of
payment across the population are examined by selected demographic,
socioeconomic, and health insurance characteristics. Only differences
between estimates that are statistically significant at the .05
level are discussed in the text. Detailed information on data sources
and methods of estimation, along with definitions of the categories
used in this report, are included in the Technical Appendix.
^top
Type of Service
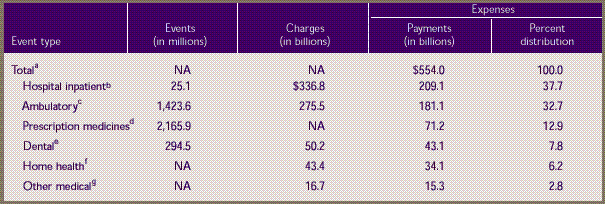
In 1996, about $554 billion in payments were
made for the health care services and supplies received by the
approximately 269 million people in the U.S. civilian noninstitutionalized
population. Table
1 shows that inpatient hospital care, the largest component,
accounted for nearly 4 of every 10 dollars spent (38 percent),
followed by ambulatory services, which accounted for about 1 in
3 dollars spent (33 percent). Prescribed medicines accounted for
about 13 percent of the total. The remaining expenses were for
dental care (8 percent), home health services (6 percent), and
other medical services (3 percent).
A total of $209.1
billion was paid for 25.1 million inpatient hospital stays for
all people in the civilian
noninstitutionalized population in 1996, and $181.1 billion in
payments were made for about 1.4 billion ambulatory visits to offices,
clinics, and outpatient departments. In addition, a total of $71.2
billion was paid for 2.2 billion acquisitions of prescribed medicines
(including refills and free samples) and $43.1 billion in expenses
were incurred for nearly 295 million visits to dental professionals.
^top
Total Expenses and Sources
of Payment
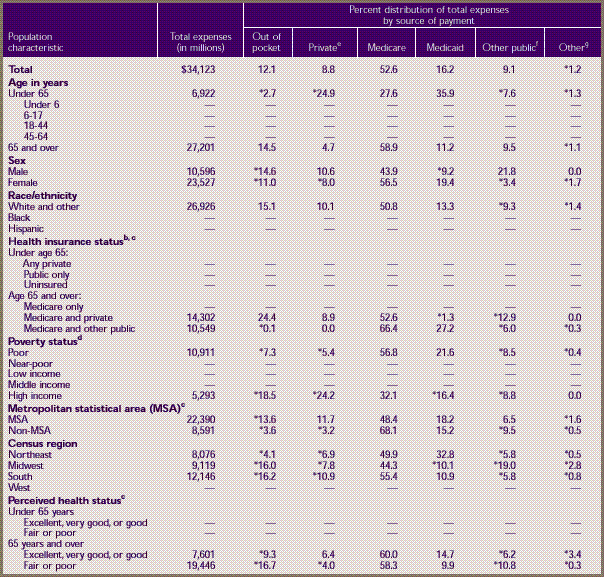
In 1996, about 86 percent of the U.S. community
population had medical expenses (Table
2). The average (mean) expense per person with expenses was
$2,398. However, half of all people with medical expenses had expenses
of less than $559 (the median value). This large discrepancy between
the mean and median values occurs because a small proportion of
people incurred a disproportionately large share of medical expenses.
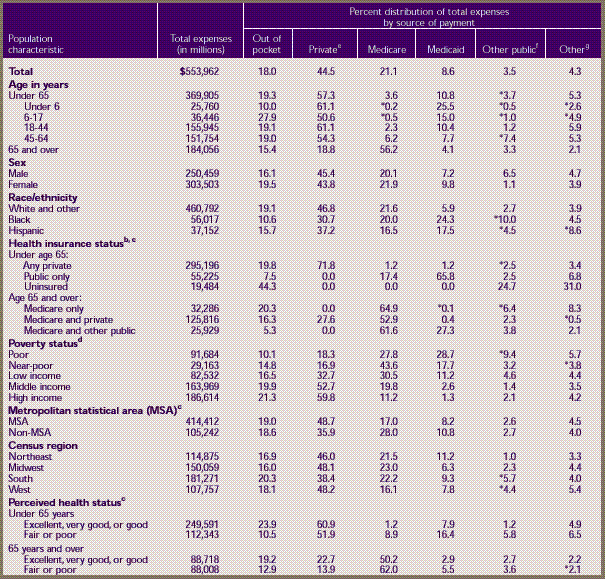
Third-party payers
accounted for 82 percent of all health care expenses in 1996,
while 18 percent were paid
out of pocket. Private health insurance, which paid for about 45
percent of all expenses, was the largest third-party payer, followed
by Medicare (21 percent) and Medicaid (9 percent).
Demographic Characteristics
The percent of people using health care services
was highest among the elderly, who also had the highest per capita
expenditures; 96 percent of those age 65 and over had expenses,
with an average expense per person of $5,644. In contrast, only
85 percent of people under 65 years of age had medical expenses,
and their average expense was about one-third as large ($1,865).
The largest single payer of medical expenses for the elderly was
Medicare, which paid for over half of their expenses (56 percent).
For the non-elderly, private insurance was the largest payer, assuming
half or more of total expenses in each age group under 65.
Ninety percent of
children under age 6 incurred an expense for health services,
compared with 83 percent of those
aged 6–17. Private insurance was the largest single payer
for both groups. However, the proportion paid out of pocket was
substantially lower for children under 6 than for children 6–17
years old (10 vs. 28 percent), a disparity largely attributable
to differences in the use of dental services.
A significantly higher percent of females than
males had medical expenses (90 vs. 82 percent), and median expenses
for females were $224 higher than those for males. However, there
was not a significant difference between males and females in average
expenses per person, and the distributions by source of payment
were generally similar.
Only three-quarters of blacks and Hispanics
incurred expenses for health care services in 1996, compared to
89 percent of whites. A substantially higher percent of expenses
for blacks and Hispanics than for whites was paid by Medicaid;
a higher percent of expenses for whites than for blacks and Hispanics
was paid out of pocket or by private health insurance. Among those
with health care expenses, the average expense was significantly
higher for whites than for Hispanics ($2,521 vs. $1,666).
Neither the percent of the population with
an expense nor the average annual expense per person varied significantly
between metropolitan statistical areas (MSAs) and rural areas.
However, private health insurance paid for a higher percent of
expenses incurred by people living in urban areas. In contrast,
Medicare paid for a higher proportion of expenses incurred by people
in rural areas.
A slightly smaller
proportion of people in the South and West than in other regions
incurred a medical expense
in 1996, yet average expenses per person did not vary significantly
by region. Also, there were no dramatic differences in the distribution
of expenses by source of payment among the regions.
Among people under 65 years of age, those reported
to have fair or poor health were more likely to have incurred medical
expenses than people in better health (92 vs. 84 percent), and
their average per capita expenses were also substantially higher
($6,438 vs. $1,385). While the overwhelming majority of people
age 65 and over had medical expenses in 1996, average expenses
per person were substantially higher for elderly people in fair
or poor health ($9,729, compared to $3,831 for elderly people in
better health). Among the elderly, the Medicare and Medicaid programs
paid for larger proportions of expenses incurred by those in fair
or poor health, and larger proportions were paid out of pocket
or by private health insurance for those in better health.
Insurance and Income
Among people under 65, only 63 percent of the
uninsured had medical expenses, compared to 88 percent of those
with private insurance coverage and 85 percent of those with public
coverage at any time in 1996. The average expense per person with
an expense was highest for those with public insurance ($2,323)
and lowest for the uninsured ($942). About two-thirds of expenses
for people under age 65 with public insurance were paid by the
Medicaid program. Out-of-pocket payments constituted a substantially
higher proportion of expenses for the uninsured (44 percent) than
for people with private (20 percent) or public insurance (8 percent).
Among the population age 65 and over, people
with Medicare and supplemental private insurance coverage were
slightly more likely to have expenses than Medicare beneficiaries
with supplemental public insurance coverage or no supplemental
coverage. Expenses were highest among people with combined Medicare
and other public coverage; their average was $7,727 per person
with an expense, of which only 5 percent was paid out of pocket.
Out-of-pocket spending was substantially higher for people with
Medicare only (20 percent) and for those with Medicare plus additional
private coverage (16 percent).
High-income individuals
were more likely to have medical care expenses than those who
were poor (91 vs. 80
percent). The proportions of expenses paid out of pocket and by
private health insurance generally rose as income increased. Conversely,
Medicaid paid for over one-quarter of total medical expenses for
the poor (29 percent), but this percentage declined sharply with
higher income.
^top
Inpatient Hospital
Services
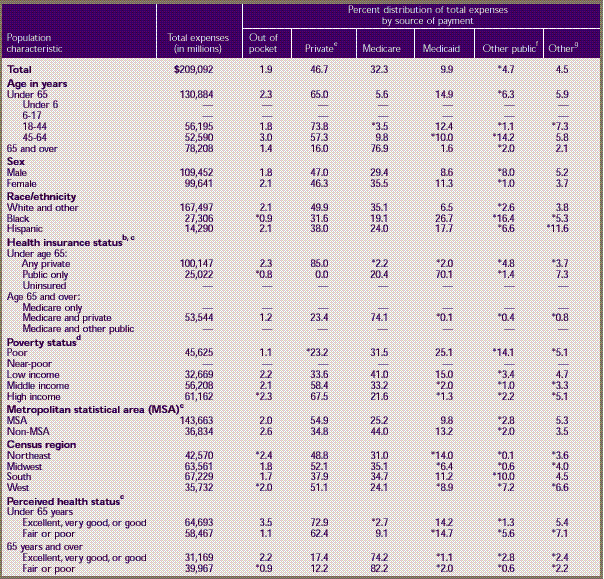
The inpatient expenditure
estimates shown in Table
3 include room and board and all hospital diagnostic and
laboratory expenses associated with the basic facility charge,
payments for separately billed physician inpatient services,
and emergency room expenses incurred immediately prior to inpatient
stays. As shown in the table, approximately 7 percent of the
population had expenses for at least one inpatient hospital stay
in 1996, with an average expense of $11,492 per person for those
with inpatient expenses. The median expense per person with an
expense was less than half that amount ($5,330), reflecting the
skewed distribution of expenses for inpatient care. The bulk
of expenses were paid by private insurance (47 percent) and Medicare
(32 percent), with relatively little paid out of pocket (2 percent).
Demographic Characteristics
The elderly were more likely than people in
younger age groups to incur expenses for inpatient care, with almost
1 in 5 elderly people having inpatient expenses. In general, the
elderly were more than three times as likely to incur expenses
as the non-elderly (18 vs. 5 percent). Average expenses per person,
however, were not significantly higher for the elderly than for
the non-elderly. About three-quarters of expenses for the elderly
(77 percent) were paid by the Medicare program, but only 2 percent
by Medicaid. In contrast, Medicare paid 6 percent of inpatient
expenses for the population under 65, while Medicaid paid 15 percent.
Moreover, although private insurance covered only 16 percent of
inpatient expenses for the elderly, it paid nearly two-thirds of
the expenses for the non-elderly.
Females were more likely than males to have
inpatient expenses (8 vs. 6 percent), but average expense for those
with an expense was higher for males ($15,133 vs. $9,090). There
were no significant differences in the distribution of payment
sources by sex.
There were no differences in the probability
of expense by race/ethnicity, and there was no significant difference
in average expenses between whites and blacks. However, average
expense for those with an expense was higher for whites than for
Hispanics ($11,710 vs. $7,976). There were some differences in
the distribution of payments among whites, blacks, and Hispanics.
For example, private insurance paid for half of inpatient hospital
expenses for whites, but only about one-third for blacks. Similarly,
Medicare paid for about one-third of inpatient expenses for whites,
compared with only about one-fifth for blacks. In contrast, the
Medicaid program covered a higher proportion of expenses for blacks
and Hispanics than for whites. Medicaid paid for about one-quarter
of inpatient hospital expenses for blacks and just under one-fifth
for Hispanics, compared with less than one-tenth (7 percent) for
whites.
The percent of people with hospital expenses
did not vary by MSA, but there were some differences by Census
Region. Those living in the West were less likely to incur inpatient
expenses than people living in any of the other three regions (6
percent compared with approximately 7 percent in each of the other
regions). The distribution of sources of payment did not vary significantly
by Census Region. However, people living outside MSAs were less
likely than those living in MSAs to have their expenses paid by
private insurance (35 percent vs. 55 percent) and were more likely
to have them paid by Medicare (44 percent vs. 25 percent).
For both the elderly
and non-elderly, perceived health status was associated with
both the probability of incurring
inpatient expenses and the mean expense per person with an expense.
Among the group under age 65, those in fair or poor health were
more than four times as likely to have inpatient expenses as those
in good to excellent health (18 percent vs. 4 percent). In addition,
their average annual expenses were more than twice as high ($17,000
vs. $8,000). The same pattern was true for the population 65 and
over, although the differences were not quite as large. There were
no significant differences in the distribution of sources of payment
by health status.
Insurance and Income
For the population under age 65, the probability
of incurring inpatient hospital expenses was lowest for the uninsured
and highest for those with public insurance only. The average expense
per person with an expense did not differ significantly between
the publicly and privately insured, however. The sources of payment
for the non-elderly population varied by insurance status, with
the privately insured having the overwhelming majority (85 percent)
of their expenses covered by private insurance and the publicly
insured having the bulk of their expenses (70 percent) covered
by Medicaid. For the elderly, no significant differences in the
probability of incurring inpatient expenses were associated with
insurance status.
People with high
incomes were the least likely to have inpatient expenses (5 percent);
those in the poor and near-poor
groups were about twice as likely to incur expenses. Mean annual
expenses per person with an expense did not vary significantly
by income level, however. With respect to sources of payment, private
insurance paid for more than half of the expenses for the middle-
and high-income populations, compared with only one-third for the
low-income population. The lower income groups had substantial
portions of their expenses paid for by Medicaid (as much as one-quarter
for those with incomes below poverty). Medicare was the other major
payer of inpatient expenses for all income groups, with payments
ranging from 22 percent of the total for those with high incomes
to 41 percent of the total for the low-income group.
^top
Ambulatory Services
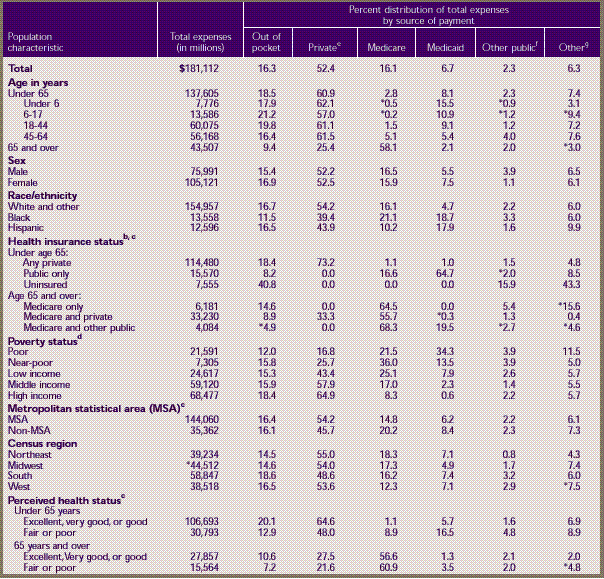
Nearly three-quarters
of the civilian noninstitutionalized population had expenses
for physician and nonphysician medical
providers seen in office-based settings or clinics, hospital outpatient
departments, emergency rooms, and clinics owned and operated by
hospitals (Table 4). For those with
expenses, annual expenses for ambulatory services during 1996 averaged
$920, while the median expense was $274. Private insurance was
the single largest payer, accounting for 52 percent of ambulatory
expenses, while Medicare and Medicaid accounted for 16 and 7 percent,
respectively. About 16 percent of all ambulatory expenses were
paid out of pocket.
Demographic Characteristics
More than four-fifths
(84 percent) of children under 6 had ambulatory expenses, compared
to two-thirds (67 percent)
of children ages 6–17. There were no differences between younger
and older children in average expenses for those with expenses.
Both younger and older children had substantially lower average
expenses than adults age 45 and over (about $400 vs. over $1,300).
Among adults, those
65 and over were the most likely to have ambulatory expenses
(89 percent) and had the highest
average expenses ($1,436) for those with expenses. People 45–64
years of age were more than 10 percentage points less likely than
the elderly to have expenses, but they had a similar average expense.
Adults ages 18–44 were about as likely (66 percent) as children
ages 6–17 to have expenses, but their average expenses of
$829 were almost twice the average for children under age 18. The
average expenses of adults ages 18–44 were more than 40 percent
less than those for adults 65 and over.
Among the non-elderly,
private insurance paid for approximately three-fifths (61 percent)
of ambulatory expenses,
out-of-pocket spending accounted for about one-fifth (19 percent),
and Medicaid accounted for 8 percent. Among the elderly, Medicare
paid for almost three-fifths (58 percent) of expenses, private
insurance paid for another quarter (25 percent), out-of-pocket
spending accounted for only 9 percent, and Medicaid paid for only
2 percent.
Females were more likely than males to have
ambulatory expenses (79 vs. 68 percent) and had higher expenses
on average ($972 vs. $855). A slightly higher proportion of expenses
for females than for males was paid by Medicaid, but there were
no differences in the other sources of payment.
Whites were more
likely than blacks or Hispanics to have ambulatory expenses
(77 vs. 63 and 61 percent, respectively)
and also had higher average ambulatory expenses ($984 vs.
$639 and $688, respectively). The distribution of sources of
payment
also varied by race/ethnicity. Private insurance paid for
a greater percent of expenses for whites, while blacks and Hispanics
had
significantly greater percents paid for by Medicaid. Whites
and Hispanics also spent a greater proportion out of pocket
(16–17
percent) than blacks (12 percent). Medicare paid for more
than twice the share of expenses for blacks (21 percent) as for
Hispanics (10 percent).
There were no differences
by MSA status in either the percent with ambulatory expenses
or average expenses.
However, private insurance paid a slightly higher proportion of
expenses in urban areas, while Medicare paid a higher proportion
in rural areas. In terms of regional comparisons, the Northeast
and Midwest had the largest percent of people with ambulatory expenses.
The distribution of sources of payment was fairly similar across
the four regions.
People in fair or poor health were substantially
more likely to have ambulatory expenses, and they had higher average
expenses than those in good to excellent health. Among the population
under 65, 86 percent of those in poor or fair health had ambulatory
expenses (average expense, $1,894), compared with 70 percent of
those in good to excellent health (average expense, $712). Differences
between those in fair or poor health and those in better health
were smaller among those 65 and over than for the non-elderly.
Insurance and Income
Among people under 65, there was no difference
between the privately and publicly insured in the percent with
ambulatory expenses (75 percent), but the uninsured were substantially
less likely to have any expenses (47 percent). Among the non-elderly
who had ambulatory expenses, those with private insurance had the
highest level of expenditures, $877, compared to $751 for those
with public insurance only and $490 for the uninsured. As expected,
the uninsured also had the highest levels of out-of-pocket expenses
for ambulatory services; they paid 41 percent of their expenses
out of pocket, compared to 8 percent for those with public insurance
and 18 percent for those with private insurance.
Among people age 65 and over, those with Medicare
and supplemental private coverage were more likely than those with
Medicare only to have ambulatory expenses (91 vs. 85 percent),
and they had higher average expenses ($1,604 vs. $961). Sources
of payment also varied depending on insurance status for people
65 and over. In particular, those with Medicare only had the highest
level of out-of-pocket spending (15 percent).
The percent of people
with any ambulatory expenses tended to increase with income.
There was little difference in
average ambulatory expenses across most income groups. However,
of people with expenses, those in the highest income group had
significantly higher average expenses ($986) than those with family
incomes near ($810) or below ($831) the poverty level. As income
increased, a smaller portion of ambulatory care was paid for by
public sources and a larger portion was paid for by private insurance.
Those in the high income group paid somewhat more out of pocket
(18 percent) than those in the low-income (15 percent) and poor
groups (12 percent).
^top
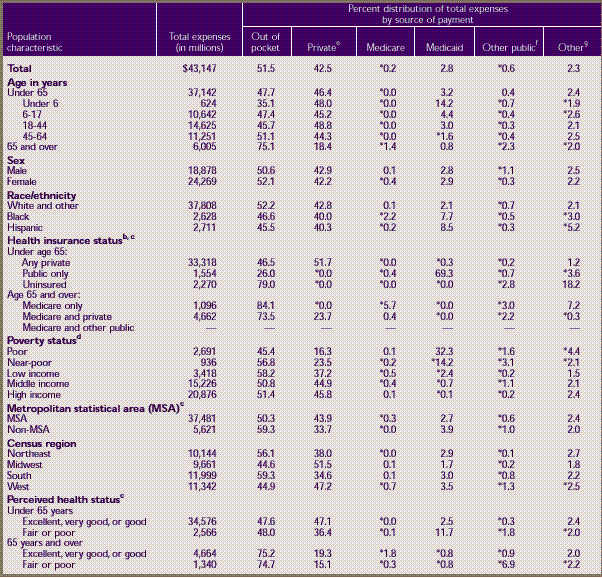
Prescribed
Medicines
Nearly two-thirds
of the population incurred expenses for prescription medicines
in 1996 (Table
5). The average annual expense for those incurring expenses
was $406. However, the median was only about one-quarter as large
($107). Out-of-pocket spending and private insurance paid the bulk
of these expenses: 45 and 40 percent, respectively. In contrast,
Medicare and Medicaid combined paid a total of only about 12 percent
of prescribed medicine expenses, most of which (10 percent) was
paid by Medicaid.
Demographic Characteristics
The population age 65 and over was much more
likely to have a prescription medicine expense than the non-elderly
population (87 vs. 62 percent) and had average expenses that were
more than twice as large ($825 vs. $321). The elderly paid just
over half of these expenses out of pocket (52 percent), compared
with 41 percent for people under 65. Private insurance paid only
31 percent of expenses for the elderly, compared to 45 percent
for the population under age 65. Medicaid paid for a larger percent
of prescribed medicine expenses for children under 18 than for
the older age groups.
Females were more likely than males to have
a prescription medicine expense (71 percent compared to 59 percent).
In addition, females had higher average annual expenses for those
with expenses than males ($434 vs. $371).
About two-thirds
of whites had prescription medicine expenses, compared to 56
percent of blacks and 54 percent
of Hispanics. Whites with expenses also had higher mean annual
expenses ($430) than blacks ($333) or Hispanics ($281). In addition,
a higher proportion of expenses were paid out of pocket and by
private insurance for whites than for blacks or Hispanics. Blacks
and Hispanics had higher proportions of their prescribed medicine
expenses paid by Medicaid (28 percent and 22 percent, respectively)
than whites did (7 percent).
There was no significant difference between
MSA and non-MSA areas in the percent of people with a prescribed
medicine expense in 1996, but a small amount of variation existed
among regions, ranging from 61 percent in the West to 68 percent
in the Midwest. The mean annual expenses per person with expenses
were highest in the South and Midwest.
In general, people in fair or poor health were
more likely than people in better health to have a prescribed medicine
expense and had higher average expenses. Among the population age
65 and over, approximately 94 percent of those in fair or poor
health had a prescribed medicine expense in 1996, compared to 85
percent of those in excellent, very good, or good health. In addition,
the elderly in fair or poor health had higher mean annual expenses
($1,133) than those in better health ($703). For the population
under 65 there were larger discrepancies by perceived health status;
84 percent of those in fair or poor health had a prescribed medicine
expense, compared to 60 percent of those in better health, and
average expenses for those groups were $844 and $258, respectively.
Insurance and Income
In the population under 65, about two-thirds
of people with public or private insurance, but only 41 percent
of the uninsured, had expenses for prescription medicines. Non-elderly
people with public insurance had higher mean annual expenses ($408)
than those with private insurance ($318) or the uninsured ($232).
The uninsured paid 88 percent of their prescription expenses out
of pocket, compared to 40 percent for those with private insurance
and 27 percent for those with public insurance.
In the population age 65 and over, people with
only Medicare coverage were the least likely to have prescription
medicine expenses (79 percent). Among elderly people with expenses,
those with Medicare and other public insurance had the highest
mean annual expenditures ($1,048). Expenses paid out of pocket
varied by type of insurance. People with Medicare only paid nearly
three-fourths of their expenses out of pocket, compared to about
half for those with Medicare and private insurance, and about one-fourth
for those with Medicare and other public coverage. Medicaid paid
63 percent of expenses for those with Medicare and other public
coverage, while private insurance paid 45 percent of expenses for
those with Medicare and private insurance.
There was little variation by income group
in the percent of the population with prescription medicine expenses
or in average expenses. The proportion of prescribed medicine expenses
paid by private insurance increased with income, rising from about
13 percent for the poor to just over half for those with high incomes
(52 percent). As expected, the percent paid by Medicaid was highest
for the poor (about 41 percent) and decreased steadily with increasing
income. Out-of-pocket payments as a proportion of total prescribed
medicine expenses were highest for the near-poor (53 percent) and
lowest for the poor (39 percent).
^top
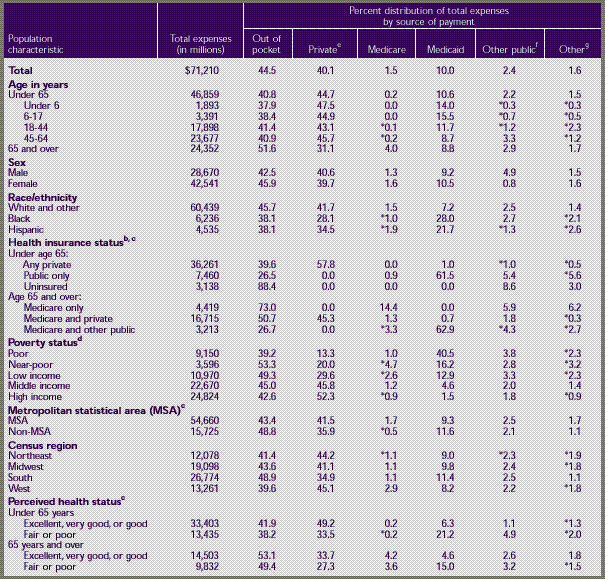
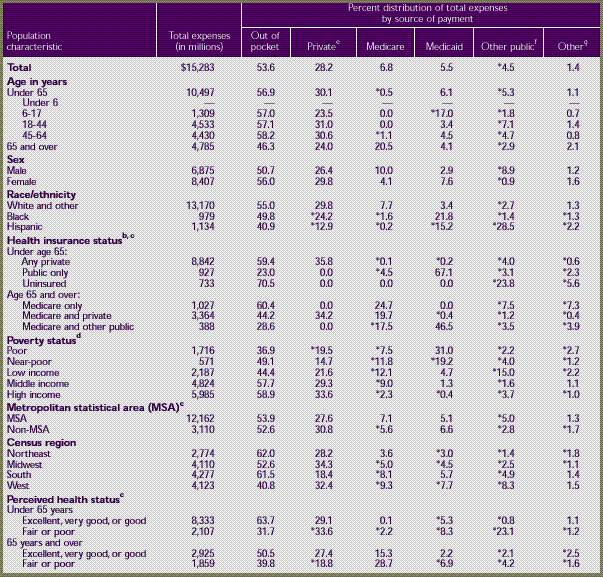
Dental Services
In 1996, less than
half (42 percent) of the civilian noninstitutionalized population
of the United States had
dental care expenses (Table 6). The
average and median expenses for those with an expense were $384
and $136 per year, respectively. The overwhelming majority of dental
expenses were paid either out of pocket (52 percent) or by private
insurance (43 percent). Public programs were not a major source
of payment for dental care. Medicare does not cover most dental
services, and Medicaid paid for only about 3 percent of all dental
services in 1996.
Demographic Characteristics
Children under age
6 were the least likely to have any dental expenses (21 percent),
and their average expenses
were significantly less than those for any other age group. In
contrast, children ages 6–17 were the most likely to have
expenses for dental care (51 percent). The elderly paid the highest
percent of dental expenses out of pocket (75 percent) and had the
lowest percent reimbursed by private insurance (18 percent).
Females were slightly more likely to have dental
expenses than males (45 percent vs. 39 percent), but average expenses
did not vary significantly by sex. There were no differences between
males and females in the distribution of payments by source.
Nearly half of whites had a dental expense
(47 percent), compared to only one-quarter of blacks and 28 percent
of Hispanics. Whites also had higher average expenses. Whites paid
a slightly higher percent out of pocket (52 percent) than Hispanics
(46 percent), but there were no differences by racial/ethnic background
in the amount paid by private insurance. Medicaid paid a higher
percentage of dental expenses for blacks (8 percent) and Hispanics
(9 percent) than for whites (2 percent).
People living in metropolitan areas were slightly
more likely to have a dental expense than people in nonmetropolitan
areas (43 vs. 38 percent) and had higher average expenses ($406
vs. $282). The proportion of people with an expense ranged among
regions from 37 percent in the South to 48 percent in the Midwest.
Average dental expenses for those with an expense were greater
in the Northeast and West than in the South and Midwest. People
in the Northeast and South paid a higher proportion out of pocket
(56 and 59 percent, respectively) than those in the Midwest and
West (45 percent in both regions).
Among people under age 65, those in excellent,
very good, or good health were more likely to have a dental expense
(43 percent) than people in fair or poor health (34 percent). Although
the average dental expense and the percent paid out of pocket were
similar, the percent paid by private insurance was less for those
in fair or poor health (36 percent) than for those in better health
(47 percent). Medicaid paid a significantly greater proportion
of dental expenses for non-elderly people in fair or poor health
(12 percent) than for those in excellent, very good, or good health
(3 percent).
Health status was
also associated with the likelihood of having a dental expense
for people 65 years and over.
About 44 percent of elderly people in excellent, very good, or
good health had an expense, compared to only 27 percent of those
in fair or poor health. For both the non-elderly and elderly populations,
average dental expenses for those with expenses did not differ
significantly across health status groups.
Insurance and Income
Among people under age 65, those with private
insurance were more likely to have a dental expense (49 percent)
than those with public coverage only (27 percent) or without health
insurance (19 percent). Average expenses for those with an expense
were much lower for people with public coverage only ($207) than
for those with any private insurance ($390) or the uninsured ($362).
The proportion of dental expenses paid out of pocket was more than
three times higher for the uninsured (79 percent) than for those
with public coverage only (26 percent) and was 1.7 times greater
for the uninsured than for those with any private insurance (47
percent).
Private insurance was also associated with
an increased likelihood of having a dental expense among people
65 years and over. Forty-six percent of the elderly with a combination
of Medicare and private insurance had dental care expenses, about
three times the rate for people with Medicare and other public
coverage (15 percent) and 1.6 times the rate for those with only
Medicare coverage (30 percent).
Generally, the percent of people with an expense
and average expenses tended to increase with income. Only about
one-quarter of people in the poor and near-poor categories had
a dental expense, compared to over half of people with high incomes
(55 percent). Of all income groups, the high- and middle-income
groups had the highest average expenses ($424 and $392, respectively).
The percent paid by private insurance also generally increased
with family income. Medicaid paid for about one-third of dental
expenses for the poor (32 percent) and 14 percent for the near-poor.
The percent paid out of pocket did not vary by income group.
^top
Home
Health Services
Only a small proportion
(about 2 percent) of the population had home health expenses
in 1996 (Table
7). Expenses per person for those individuals were relatively
high, however, averaging about $5,200 for the year, with a median
of $1,540. The majority of home health expenses were paid for by
Medicare (53 percent), followed by Medicaid (16 percent) and out-of-pocket
spending (12 percent). Private insurance accounted for approximately
9 percent of total payments, and other public programs for another
9 percent.
Demographic Characteristics
The elderly were by far the most likely to
have home health expenses. Thirteen percent of people age 65 and
over had expenses for home health care, compared with less than
1 percent of people under age 65. In addition, the average annual
expense per person for those with expenses was much higher for
the elderly than the non-elderly ($6,041 vs. $3,342). As would
be expected, Medicare was the primary source of payment for home
health services for the elderly, covering almost 60 percent of
all payments, but it was also a major source of payment for the
population under 65, covering more than one-quarter of the payments
for this group. The elderly paid a relatively large proportion
of home health care expenses out of pocket (15 percent) but had
less than 5 percent of their expenses covered by private insurance.
Females were more likely than males to have
home health expenses, but average expenses per person with any
expense did not differ significantly by sex. Among racial and ethnic
groups, Hispanics were the least likely to have home health expenses;
there was no difference between blacks and whites in the probability
of incurring expenses. Not surprisingly, among both the non-elderly
and the elderly, people in fair or poor health were far more likely
than those in good to excellent health to have expenses for home
health services. Among those 65 and over, average expenses per
person with expenses were more than 1 1/2 times as high for those
in fair or poor health as for those in better health ($7,365 vs.
$4,321).
People living outside
of MSAs were slightly more likely to have home health expenses
than those living in MSAs
and also had a higher proportion of their expenses paid for by
Medicare (68 vs. 48 percent). There were no significant differences
by region in the percent of people with an expense, mean expenses,
or the distribution of mean expenses across sources of payment,
at least partly because of small sample sizes.
Insurance and Income
Non-elderly people with public insurance were
approximately five times as likely as the non-elderly with private
insurance to incur expenses for home health care. Elderly people
with both Medicare and other public insurance were nearly three
times as likely as those with Medicare only or Medicare and private
insurance to incur expenses for home health care. In addition,
the average annual expense per person with an expense was nearly
twice as high for people with Medicare and other public insurance
($9,984) as it was for those who had Medicare and private insurance
($5,550).
High-income people were less likely than the
poor or near-poor to have home health expenses. The average expense
per person with an expense was significantly higher for poor people
than for high-income people, and the poor had a much higher proportion
of expenses paid for by Medicare. There were few other significant
differences by income, largely because of small sample sizes.
^top
Other
Medical Equipment and Services
In 1996, about one out of five people had expenses
for other medical equipment and services (Table
8), totaling $15.3 billion. The mean and median expenses for
those with expenses were $286 and $158, respectively. Over half
of all expenses (54 percent) were paid out of pocket, while private
insurance paid 28 percent.
The elderly were
more likely than the non-elderly to have other medical expenses
(33 percent vs. 18 percent), and
they had higher average expenses among those with an expense ($432
vs. $248). The elderly with Medicare only paid a significantly
higher proportion out of pocket (60 percent) than the elderly with
Medicare and either other public insurance (29 percent) or private
insurance (44 percent). In addition, whites were more likely to
have other medical expenses than either blacks or Hispanics (22
percent vs. 13 percent for both blacks and Hispanics). Among both
the elderly and non-elderly, those in poor or fair health were
more likely to have other medical expenses, and paid a significantly
smaller portion out of pocket, than those in better health. Finally,
high-income people were more likely than poor people to have an
expense ( 24 percent vs. 14 percent) and paid a much larger percentage
out of pocket (59 percent vs. 37 percent).
^top
Summary
In 1996, 86 percent of the U.S. civilian noninstitutionalized
population incurred health care expenses. Aggregate expenses totaled
$554 billion. The average expense per person with any medical expense
was about $2,400, but half of these individuals had expenses totaling
less than $559 (the median value). Average expenses varied considerably
across the population by age, race/ethnicity, health insurance
status, and health status. For example, the average expense for
uninsured people with expenses was less than half the average expense
for those with private or public health insurance.
Hospital inpatient care, despite declining
substantially as a proportion of total expenses over the last two
decades (Hahn and Lefkowitz, 1992), was still the largest component
of health care expenses in 1996, making up 38 percent of the total.
The second largest category of expenses in 1996, ambulatory services
from both physicians and nonphysician providers, accounted for
approximately one-third of the total. The proportion of expenses
attributable to purchases of prescription medicines was 13 percent
in 1996, a substantial increase over the proportion a decade earlier
(Hahn and Lefkowitz, 1992).
Private insurance was the largest source of
payments in 1996, comprising 45 percent of total expenses, while
Medicare accounted for 21 percent and Medicaid 9 percent. The proportion
of total expenses paid out of pocket, which has declined in recent
years (Hahn and Lefkowitz, 1992), was about 18 percent in 1996.
The proportion paid by different sources varied considerably by
type of service. For example, 45 percent of prescription medicine
expenses and 52 percent of dental expenses were paid out of pocket,
compared to only 2 percent for inpatient services.
In summary, MEPS
data for 1996 indicate that levels of expenses and the distribution
of payments by source varied
by both type of service and characteristics of the population.
The estimates presented here represent the first in a series of
annual estimates based on the ongoing Medical Expenditure Panel
Survey. Future MEPS surveys will allow for a more thorough examination
of trends in total health care expenses and the distribution of
those expenses and sources of payment across the population.
^top
References
Cohen JW. Design
and methods of the Medical Expenditure Panel Survey Household
Component. Rockville (MD): Agency
for Health Care Policy and Research; 1997. MEPS Methodology Report
No. 1. AHCPR Pub. No. 97–0026.
Cohen JW, Monheit
AC, Beauregard KM, et al. The Medical Expenditure Panel Survey:
a national health information
resource. Inquiry 1996;33:373–89.
Cohen S. Sample
design of the 1996 Medical Expenditure Panel Survey Household
Component. Rockville (MD): Agency
for Health Care Policy and Research; 1997. MEPS Methodology Report
No. 2. AHCPR Pub. No. 97–0027.
Hahn B, Lefkowitz
D. Annual expenses and sources of payment for health care services.
1992. National Medical Expenditure
Survey Research Findings 14. Rockville (MD): Agency for Health
Care Policy and Research; AHCPR Pub. No. 93–0007.
Machlin SR, Taylor
AK. Design, methods, and field results of the 1996 Medical Expenditure
Panel Survey Medical
Provider Component. Rockville (MD): Agency for Healthcare Research
and Quality; 2000. MEPS Methodology Report No. 9. AHRQ Pub. No.
00–0028.
Moeller JF, Stagnitti
MN, Horan E, et al. Outpatient prescription drugs: data collection
and editing in the 1996 Medical
Expenditure Panel Survey. Rockville (MD): Agency for Healthcare
Research and Quality; 2000. MEPS Methodology Report No. 12. AHRQ
Pub. No. 01–0002.
Selden TM, Levit
KA, Cohen JW, et al. Reconciling medical expenditure estimates
from the Medical Expenditure Panel
Survey and the National Health Accounts, 1996. Association for
Health Services Research 2000 Annual Meeting; 2000 June 25–27;
Los Angeles.
^top
Tables
showing information on:
Table 1. Events, charges, and expenses by
event type: United States, 1996
a Total
includes inpatient hospital and physician services, ambulatory
physician and nonphysician services, prescribed medicines, home
health services, dental services, and various other medical equipment,
supplies, and services that were purchased or rented during the
year. Over-the-counter medications, alternative care services,
and phone contacts are excluded.
b Hospital admissions that did not involve an overnight
stay are excluded but are counted as ambulatory events. Expenses
include room and board and all hospital diagnostic and laboratory
expenses associated with the basic facility charge, payments
for separately billed physician inpatient services, and emergency
room expenses incurred immediately prior to inpatient stays.
Events for newborns who left the hospital on the same day as
the mother are treated as separate events, but associated expenses
are included in expense estimates.
c Events and expenses for both physician and nonphysician
medical providers seen in office-based settings or clinics, hospital
outpatient departments, emergency rooms (except visits resulting
in an overnight hospital stay), and clinics owned and operated
by hospitals are included, as are events and expenses for hospital
admissions without an overnight stay.
d All prescribed medicines initially purchased or
otherwise obtained during 1996, as well as refills and free samples,
are included.
e Services provided by general dentists, dental hygienists,
dental technicians, dental surgeons, orthodontists, endodontists,
and periodontists are included.
f Expenses for care provided by home health agencies
and independent home health providers are included. Most home
health expenses (82.5 percent) were for agency providers.
g Expenses for eyeglasses, ambulance services, orthopedic
items, hearing devices, prostheses, bathroom aids, medical equipment,
disposable supplies, and other miscellaneous items or services
that were obtained, purchased, or rented during the year are
included.
NA-- not available.
Note: These
estimates are for a target population of approximately 268.9 million
persons who were in the civilian noninstitutionalized population
for all or part of 1996. Percents may not add to 100 because of
rounding.
Source: Center
for Financing, Access, and Cost Trends, Agency for Healthcare Research
and Quality: Medical Expenditure Panel Survey, 1996.
Table
2. Total health services a median and
mean expenses per person with expense and distribution of expenses
by source of payment: United States, 1996
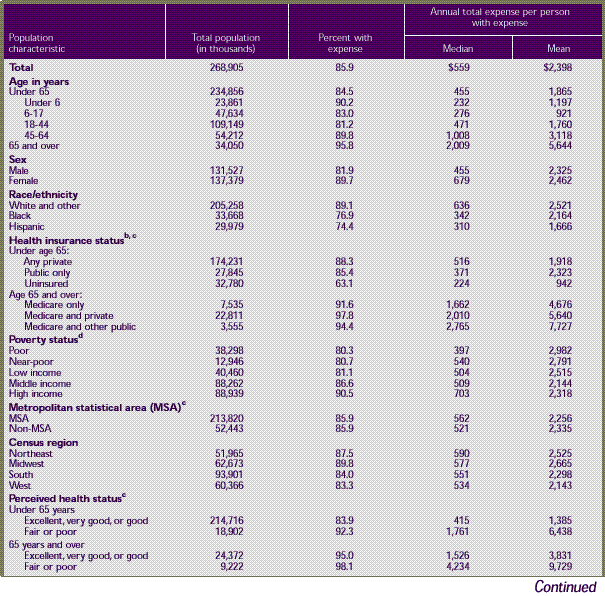
Table 2. Total
health services a median
and mean expenses per person with expense and distribution of
expenses by source of payment: United States, 1996 (continued)
a Inpatient hospital
and physician services, ambulatory physician and nonphysician services,
prescribed medicines, home health services, dental services, and
various other medical equipment and services that were purchased
or rented during the year are included. Over-the-counter medications,
alternative care services, and telephone contacts are excluded.
b For health insurance status, uninsured refers to
persons uninsured during the entire year. Public and private
health insurance categories refer to individuals with public
or private insurance at any time during the period; individuals
with both public and private insurance and those with CHAMPUS
or CHAMPVA (Armed-Forces-related coverage) are classified as
having private insurance.
c Number of persons and amount of expenses do not
add to overall total because data on this variable were not available
for some sample persons.
d Poor refers to incomes at or below the Federal poverty
line; near-poor, over the poverty line through 125 percent of
the poverty line; low income, over 125 percent through 200 percent
of the poverty line; middle income, over 200 percent to 400 percent
of the poverty line; and high income, over 400 percent of the
poverty line.
e For source of payment, private includes CHAMPUS
and CHAMPVA (Armed-Forces-related coverage).
f For source of payment, other public includes Department
of Veterans Affairs (except CHAMPVA); other Federal sources (Indian
Health Service, military treatment facilities, and other care
provided by the Federal Government); other State and local sources
(community and neighborhood clinics, State and local health departments,
and State programs other than Medicaid); and other public (Medicaid
payments reported for persons who were not enrolled in the Medicaid
program at any time during the year).
g For source of payment, other includes Worker's Compensation;
other unclassified sources (e.g., automobile, homeowner's, liability,
and other miscellaneous or unknown sources); and other private
insurance (any type of private insurance payments reported for
persons without private health insurance coverage during the
year, as defined in MEPS).
* Relative standard error equal to or greater
than 30 percent.
Note: Restricted
to civilian noninstitutionalized population. Percents may not add
to 100 because of rounding.
Source: Center
for Financing, Access, and Cost Trends, Agency for Healthcare Research
and Quality: Medical Expenditure Panel Survey, 1996.
Table
3. Hospital inpatient services a median
and mean expenses per person with expense and distribution of
expenses by source of payment: United States, 1996
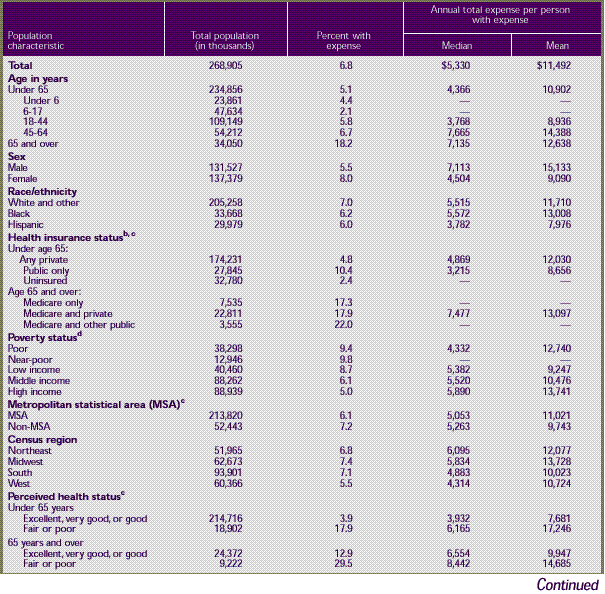
Table 3. Hospital
inpatient services a median
and mean expenses per person with expense and distribution of
expenses by source of payment: United States, 1996 (continued)
a Room and board and all hospital
diagnostic and laboratory expenses associated with the basic facility
charge, payments for separately billed physician inpatient services,
and emergency room expenses incurred immediately prior to inpatient
stays are included. Expenses for hospital discharges that did not
involve an overnight stay, which are included as ambulatory expenses (Table
4) are excluded. Expenses for newborns who left the hospital
on the same day as the mother are included in the mother's record.
b For health insurance status, uninsured refers to
persons uninsured during the entire year. Public and private
health insurance categories refer to individuals with public
or private insurance at any time during the period; individuals
with both public and private insurance and those with CHAMPUS
or CHAMPVA (Armed-Forces-related coverage) are classified as
having private insurance.
c Number of persons and amount of expenses do not
add to overall total because data on this variable were not available
for some sample persons.
d Poor refers to incomes at or below the Federal poverty
line; near-poor, over the poverty line through 125 percent of
the poverty line; low income, over 125 percent through 200 percent
of the poverty line; middle income, over 200 percent to 400 percent
of the poverty line; and high income, over 400 percent of the
poverty line.
e For source of payment, private includes CHAMPUS
and CHAMPVA (Armed-Forces-related coverage).
f For source of payment, other public includes Department
of Veterans Affairs (except CHAMPVA); other Federal sources (Indian
Health Service, military treatment facilities, and other care
provided by the Federal Government); other State and local sources
(community and neighborhood clinics, State and local health departments,
and State programs other than Medicaid); and other public (Medicaid
payments reported for persons who were not enrolled in the Medicaid
program at any time during the year).
g For source of payment, other includes Worker's Compensation;
other unclassified sources (e.g., automobile, homeowner's, liability,
and other miscellaneous or unknown sources); and other private
insurance (any type of private insurance payments reported for
persons without private health insurance coverage during the
year, as defined in MEPS).
-- Less than
100 sample cases with expenses.
* Relative standard error equal to or greater
than 30 percent.
Note: Restricted
to civilian noninstitutionalized population. Percents may not add
to 100 because of rounding.
Source: Center
for Financing, Access, and Cost Trends, Agency for Healthcare Research
and Quality: Medical Expenditure Panel Survey, 1996.
Table
4. Ambulatory services a median and
mean expenses per person with expense and distribution of expenses
by source of payment: United States, 1996
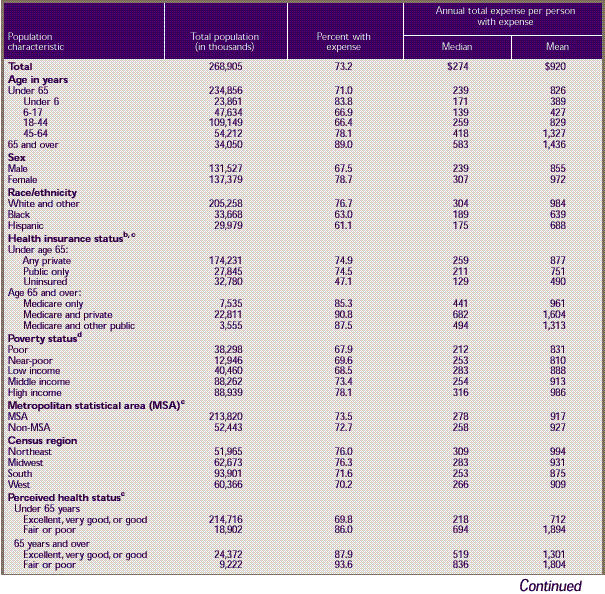
Table 4. Ambulatory
services a median and
mean expenses per person with expense and distribution of expenses
by source of payment: United States, 1996 (continued)
a Expenses for visits to medical
providers seen in office-based settings or clinics, hospital outpatient
departments, emergency rooms (except visits resulting in an overnight
hospital stay), and clinics owned and operated by hospitals, as
well as expenses for events reported as hospital admissions without
an overnight stay, are included.
b For health insurance status, uninsured refers to
persons uninsured during the entire year. Public and private
health insurance categories refer to individuals with public
or private insurance at any time during the period; individuals
with both public and private insurance and those with CHAMPUS
or CHAMPVA (Armed-Forces-related coverage) are classified as
having private insurance.
c Number of persons and amount of expenses do not
add to overall total because data on this variable were not available
for some sample persons.
d Poor refers to incomes at or below the Federal poverty
line; near-poor, over the poverty line through 125 percent of
the poverty line; low income, over 125 percent through 200 percent
of the poverty line; middle income, over 200 percent to 400 percent
of the poverty line; and high income, over 400 percent of the
poverty line.
e For source of payment, private includes CHAMPUS
and CHAMPVA (Armed-Forces-related coverage).
f For source of payment, other public includes Department
of Veterans Affairs (except CHAMPVA); other Federal sources (Indian
Health Service, military treatment facilities, and other care
provided by the Federal Government); other State and local sources
(community and neighborhood clinics, State and local health departments,
and State programs other than Medicaid); and other public (Medicaid
payments reported for persons who were not enrolled in the Medicaid
program at any time during the year).
g For source of payment, other includes Worker's Compensation;
other unclassified sources (e.g., automobile, homeowner's, liability,
and other miscellaneous or unknown sources); and other private
insurance (any type of private insurance payments reported for
persons without private health insurance coverage during the
year, as defined in MEPS).
* Relative standard error equal to or greater
than 30 percent.
Note: Restricted
to civilian noninstitutionalized population. Percents may not add
to 100 because of rounding.
Source: Center
for Financing, Access, and Cost Trends, Agency for Healthcare Research
and Quality: Medical Expenditure Panel Survey, 1996.
Table
5. Prescription medicines a median
and mean expenses per person with expense and distribution of
expenses by source of payment: United States, 1996
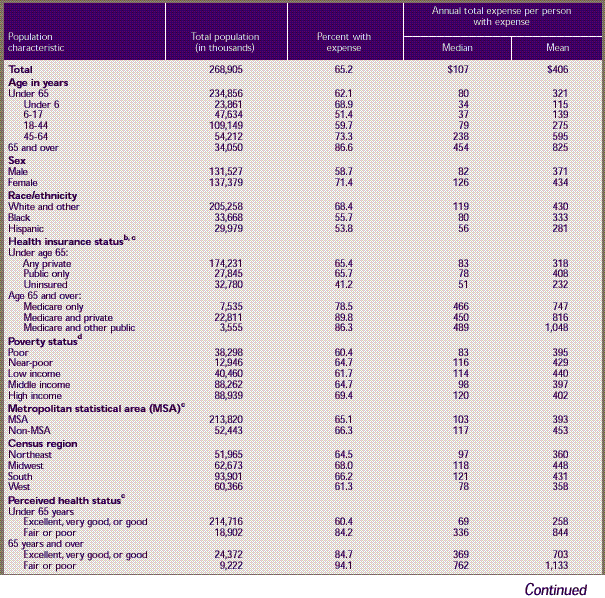
Table 5. Prescription
medicines a median
and mean expenses per person with expense and distribution of
expenses by source of payment: United States, 1996 (continued)
a Expenses for all prescribed medicines
initially purchased or otherwise obtained during 1996, as well
as any refills, are included. Free samples are included in the
estimate of percent of persons with any expense.
b For health insurance status, uninsured refers to
persons uninsured during the entire year. Public and private
health insurance categories refer to individuals with public
or private insurance at any time during the period; individuals
with both public and private insurance and those with CHAMPUS
or CHAMPVA (Armed-Forces-related coverage) are classified as
having private insurance.
c Number of persons and amount of expenses do not
add to overall total because data on this variable were not available
for some sample persons.
d Poor refers to incomes at or below the Federal poverty
line; near-poor, over the poverty line through 125 percent of
the poverty line; low income, over 125 percent through 200 percent
of the poverty line; middle income, over 200 percent to 400 percent
of the poverty line; and high income, over 400 percent of the
poverty line.
e For source of payment, private includes CHAMPUS
and CHAMPVA (Armed-Forces-related coverage).
f For source of payment, other public includes Department
of Veterans Affairs (except CHAMPVA); other Federal sources (Indian
Health Service, military treatment facilities, and other care
provided by the Federal Government); other State and local sources
(community and neighborhood clinics, State and local health departments,
and State programs other than Medicaid); and other public (Medicaid
payments reported for persons who were not enrolled in the Medicaid
program at any time during the year).
g For source of payment, other includes Worker's Compensation;
other unclassified sources (e.g., automobile, homeowner's, liability,
and other miscellaneous or unknown sources); and other private
insurance (any type of private insurance payments reported for
persons without private health insurance coverage during the
year, as defined in MEPS).
* Relative standard error equal to or greater
than 30 percent.
Note: Restricted
to civilian noninstitutionalized population. Percents may not add
to 100 because of rounding.
Source: Center
for Financing, Access, and Cost Trends, Agency for Healthcare Research
and Quality: Medical Expenditure Panel Survey, 1996.
Table
6. Dental services a median and mean
expenses per person with expense and distribution of expenses
by source of payment: United States, 1996
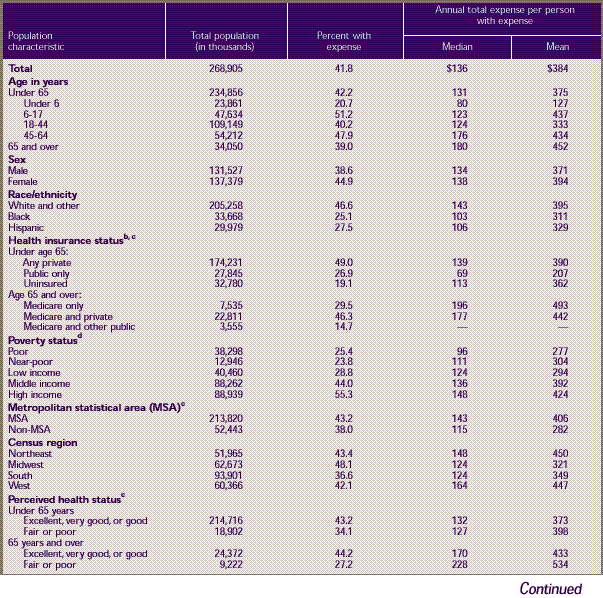
Table 6. Dental
services a median and mean
expenses per person with expense and distribution of expenses
by source of payment: United States, 1996 (continued)
a Expenses from any type of dental
care providers are included.
b For health insurance status, uninsured refers to
persons uninsured during the entire year. Public and private
health insurance categories refer to individuals with public
or private insurance at any time during the period; individuals
with both public and private insurance and those with CHAMPUS
or CHAMPVA (Armed-Forces-related coverage) are classified as
having private insurance.
c Number of persons and amount of expenses do not
add to overall total because data on this variable were not available
for some sample persons.
d Poor refers to incomes at or below the Federal poverty
line; near-poor, over the poverty line through 125 percent of
the poverty line; low income, over 125 percent through 200 percent
of the poverty line; middle income, over 200 percent to 400 percent
of the poverty line; and high income, over 400 percent of the
poverty line.
e For source of payment, private includes CHAMPUS
and CHAMPVA (Armed-Forces-related coverage).
f For source of payment, other public includes Department
of Veterans Affairs (except CHAMPVA); other Federal sources (Indian
Health Service, military treatment facilities, and other care
provided by the Federal Government); other State and local sources
(community and neighborhood clinics, State and local health departments,
and State programs other than Medicaid); and other public (Medicaid
payments reported for persons who were not enrolled in the Medicaid
program at any time during the year).
g For source of payment, other includes Worker's Compensation;
other unclassified sources (e.g., automobile, homeowner's, liability,
and other miscellaneous or unknown sources); and other private
insurance (any type of private insurance payments reported for
persons without private health insurance coverage during the
year, as defined in MEPS).
--Less than
100 sample cases with expenses.
* Relative standard error equal to or greater
than 30 percent.
Note: Restricted
to civilian noninstitutionalized population. Percents may not add
to 100 because of rounding.
Source: Center
for Financing, Access, and Cost Trends, Agency for Healthcare Research
and Quality: Medical Expenditure Panel Survey, 1996.
Table 7. Home health
services a median and
mean expenses per person with expense and distribution of expenses
by source of payment: United States, 1996
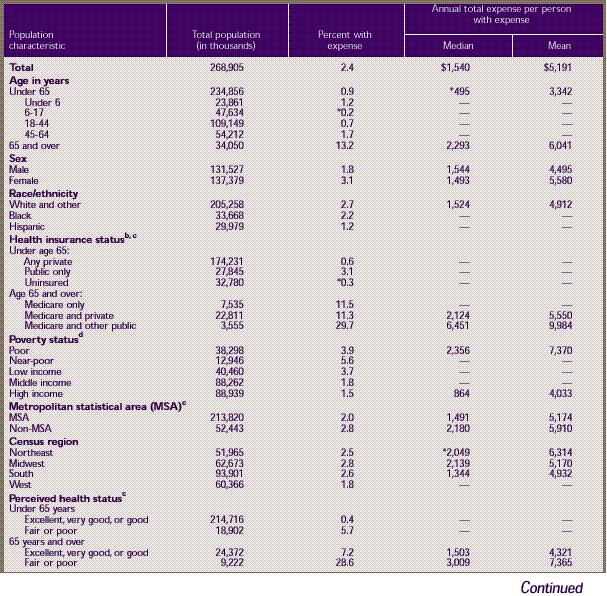
Table 7. Home
health services a median and
mean expenses per person with expense and
distribution of expenses by source of payment: United States,
1996 (continued)
a Expenses for care provided by
home health agencies and independent home health providers are
included. Most home health expenses (82.5 percent) were for agency
providers.
b For health insurance status, uninsured refers to
persons uninsured during the entire year. Public and private
health insurance categories refer to individuals with public
or private insurance at any time during the period; individuals
with both public and private insurance and those with CHAMPUS
or CHAMPVA (Armed-Forces-related coverage) are classified as
having private insurance.
c Number of persons and amount of expenses do not
add to overall total because data on this variable were not available
for some sample persons.
d Poor refers to incomes at or below the Federal poverty
line; near-poor, over the poverty line through 125 percent of
the poverty line; low income, over 125 percent through 200 percent
of the poverty line; middle income, over 200 percent to 400 percent
of the poverty line; and high income, over 400 percent of the
poverty line.
e For source of payment, private includes CHAMPUS
and CHAMPVA (Armed-Forces-related coverage).
f For source of payment, other public includes Department
of Veterans Affairs (except CHAMPVA); other Federal sources (Indian
Health Service, military treatment facilities, and other care
provided by the Federal Government); other State and local sources
(community and neighborhood clinics, State and local health departments,
and State programs other than Medicaid); and other public (Medicaid
payments reported for persons who were not enrolled in the Medicaid
program at any time during the year).
g For source of payment, other includes Worker's Compensation;
other unclassified sources (e.g., automobile, homeowner's, liability,
and other miscellaneous or unknown sources); and other private
insurance (any type of private insurance payments reported for
persons without private health insurance coverage during the
year, as defined in MEPS).
-- Less than
100 sample cases with expenses.
* Relative standard error equal to or greater
than 30 percent.
Note: Restricted
to civilian noninstitutionalized population. Percents may not add
to 100 because of rounding.
Source: Center
for Financing, Access, and Cost Trends, Agency for Healthcare Research
and Quality: Medical Expenditure Panel Survey, 1996.
Table
8. Other medical equipment and services a median and mean expenses
per person with expense and distribution of expenses by source
of payment: United States, 1996
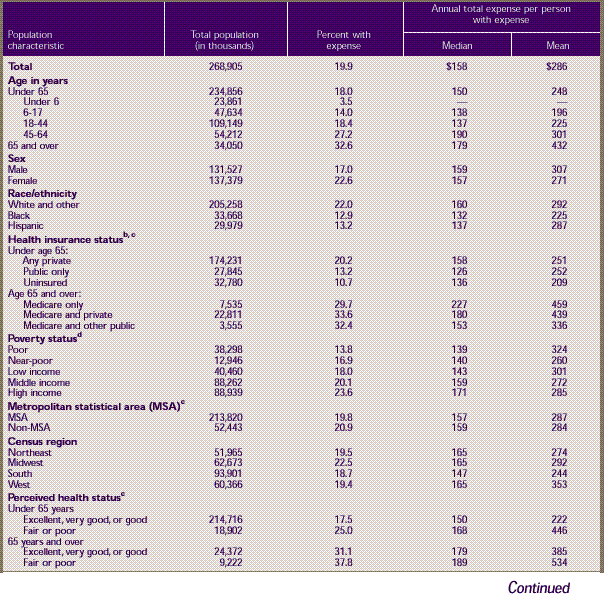
Table 8. Other
medical equipment and services a median and mean expenses
per person with expense and distribution of expenses by source
of payment: United States, 1996 (continued)
a Expenses for eyeglasses, ambulance
services, orthopedic items, hearing devices, prostheses, bathroom
aids, medical equipment, disposable supplies, and other miscellaneous
items or services that were obtained, purchased, or rented during
the year are included. About half the expenses in this category
were for vision items.
b For health insurance status, uninsured refers to
persons uninsured during the entire year. Public and private
health insurance categories refer to individuals with public
or private insurance at any time during the period; individuals
with both public and private insurance and those with CHAMPUS
or CHAMPVA (Armed-Forces-related coverage) are classified as
having private insurance.
c Number of persons and amount of expenses do not
add to overall total because data on this variable were not available
for some sample persons.
d Poor refers to incomes at or below the Federal poverty
line; near-poor, over the poverty line through 125 percent of
the poverty line; low income, over 125 percent through 200 percent
of the poverty line; middle income, over 200 percent to 400 percent
of the poverty line; and high income, over 400 percent of the
poverty line.
e For source of payment, private includes CHAMPUS
and CHAMPVA (Armed-Forces-related coverage).
f For source of payment, other public includes Department
of Veterans Affairs (except CHAMPVA); other Federal sources (Indian
Health Service, military treatment facilities, and other care
provided by the Federal Government); other State and local sources
(community and neighborhood clinics, State and local health departments,
and State programs other than Medicaid); and other public (Medicaid
payments reported for persons who were not enrolled in the Medicaid
program at any time during the year).
g For source of payment, other includes Worker's Compensation;
other unclassified sources (e.g., automobile, homeowner's, liability,
and other miscellaneous or unknown sources); and other private
insurance (any type of private insurance payments reported for
persons without private health insurance coverage during the
year, as defined in MEPS).
-- Less than
100 sample cases with expenses.
* Relative standard error equal to or greater
than 30 percent.
Note: Restricted
to civilian noninstitutionalized population. Percents may not add
to 100 because of rounding.
Source: Center
for Financing, Access, and Cost Trends, Agency for Healthcare Research
and Quality: Medical Expenditure Panel Survey, 1996.
^top
Technical Appendix
The data in this report were obtained in the
first three rounds of interviews for the Household Component (HC)
of the 1996 Medical Expenditure Panel Survey (MEPS). MEPS is cosponsored
by the Agency for Healthcare Research and Quality (AHRQ) and the
National Center for Health Statistics (NCHS). The focus of the
MEPS HC is to collect detailed data on demographic characteristics,
health conditions, health status, use of medical care services,
charges and payments for those services, access to care, health
insurance coverage, income, and employment of the U.S. civilian
noninstitutionalized population. In other components of MEPS, data
are collected on the use, charges, and payments reported by providers
(Medical Provider Component), residents of licensed or certified
nursing homes (Nursing Home Component), and the supply side of
the insurance market (Insurance Component).
The sample for the MEPS HC was selected from
respondents to the 1995 National Health Interview Survey (NHIS),
which was conducted by NCHS. NHIS provides a nationally representative
sample of the U.S. civilian noninstitutionalized population and
reflects an oversampling of Hispanics and blacks. The MEPS HC collects
data through an overlapping panel design. In this design, data
are collected through a precontact interview that is followed by
a series of five rounds of interviews over a period of 2 1/2 years.
Interviews are conducted with one member of each family, who reports
on the health care experiences of the entire family. Two calendar
years of medical expenditure and utilization data are collected
in each household and captured using computer-assisted personal
interviewing (CAPI). This series of data collection rounds is launched
again each subsequent year on a new sample of households to provide
overlapping samples of survey data that will provide continuous
and current estimates of health care expenditures.
The reference period
for Round 1 of the MEPS HC was from January 1, 1996, to the date
of the first interview,
which occurred during the period from March through August 1996.
The reference period for Round 2 of the MEPS HC was from the date
of the first interview (March–August 1996) to the date of
the second interview, which took place during the period from August
through December 1996. While the reference period for Round 3 was
from the date of the second interview (August–December 1996)
to the date of the third interview (February–July 1997), only
expenditures from the 1996 portion of the Round 3 interview are
included in the estimates contained in this report.
The estimates of
total expenditures in each table are based on 21,571 sample persons.
They are weighted to
develop population estimates for a total of268,905,490 persons
who were in the U.S. civilian noninstitutionalized population for
part or all of 1996. For persons who were in the target population
for the full year, all expenditures from January 1 through December
31, 1996, were included in the estimates. People with part-year
information include newborns, people who died during the year,
and people who resided in an institution, were in the military,
or lived outside the country for part of the year. Expenditures
for deceased persons were measured for the period from January
1 through the date of death, while those for newborns were measured
from the date of birth through December 31. Expenses incurred during
periods of full-time active-duty military service, institutionalization,
or residency outside the country were not included.
The estimates in this report are based on the
most recent data available from MEPS at the time the report was
written. However, selected elements of MEPS data may be revised
on the basis of additional analyses, which could result in slightly
different estimates from those shown here. Please check the MEPS
Web site for the most current file releases.
MEPS Expenditures
Definition
Expenditures in this report refer to payments
for health care services. More specifically, expenditures in MEPS
are defined as the sum of direct payments for care provided during
the year, including out-of-pocket payments and payments by private
insurance, Medicaid, Medicare, and other sources. Payments for
over-the-counter drugs, alternative care services, and phone contacts
with medical providers are not included in MEPS total expenditure
estimates. Indirect payments not related to specific medical events,
such as Medicaid Disproportionate Share and Medicare Direct Medical
Education subsidies, also are not included.
The definition of
expenditures used in MEPS is somewhat different from the definition
used in its predecessor
surveys, the 1987 National Medical Expenditure Survey (NMES) and
the 1977 National Medical Care Expenditure Survey (NMCES), where "charges" rather
than "sum of payments" were used to measure expenditures.
This change was adopted because charges became a less appropriate
proxy for medical expenditures during the 1990s due to the increasingly
common practice of discounting charges. One impact of this change
is that charges associated with uncollected liability, bad debt,
and charitable care (unless provided by a public clinic or hospital)
are not counted as expenditures.
Differences Between MEPS and National Health
Accounts Estimates
MEPS and the National Health Accounts (NHA)
of the Health Care Financing Administration (HCFA) have substantial
differences in methodologies and objectives. In particular, the
NHA are based on a composite of data from multiple sources at the
national level and are used primarily to track aggregate medical
expenditures in the U.S. economy. In contrast, MEPS collects survey
data on individuals that can be used to estimate direct payments
made for medical care and services purchased by the civilian noninstitutionalized
population. Data from MEPS are widely used for behavioral and socioeconomic
analyses of the relationship between individual characteristics
and health care spending.
National health
care expenditure estimates from MEPS are lower than those from
the NHA for several reasons.
First, the NHA include a larger range of expenditures. For example,
the NHA include expenditures for over-the-counter drugs, nursing
home care, program administration, government public health activities,
and construction, as well as some hospital and physician revenues
not associated with patient care. Second, the NHA include health
care expenditures for individuals who are not members of the civilian
noninstitutionalized population, such as individuals in the military
and those residing in nursing homes, assisted living facilities,
and prisons. Researchers at AHRQ and HCFA estimate that adjustments
for differences in the scope of included expenditures and population
reduce the NHA's national estimate to about $604 billion, compared
to the corresponding MEPS national estimate of $554 billion (Selden,
Levit, Cohen, et al., 2000). For the most part, the remaining difference
is likely to reflect some combination of (a) irreconcilable definition
and measurement differences between the NHA and MEPS and (b) statistical
uncertainty associated with sampling error in both MEPS and the
NHA.
Estimation Methodology
Expenditure estimates
in this report are based on the sum of total payments for 1996
medical events reported in
Rounds 1–3 of the MEPS HC. The HC collected annual data on
the use of and associated expenditures for office and hospital-based
care, home health care, dental services, prescribed medicines,
vision aids, and other medical supplies and equipment. In addition,
the MEPS Medical Provider Component (MPC) collected expenditure
data from a sample of medical and pharmaceutical providers that
provided care and medicines to sample people in 1996. Expenditure
data collected in the MPC are generally regarded as more accurate
than comparable data collected in the HC and were used to improve
the overall quality of MEPS expenditure data in this report. For
a more detailed description of the MPC, see Machlin and Taylor
(2000).
Expenditure data were imputed to replace missing
data, provide estimates for care delivered under capitated reimbursement
arrangements, and adjust household-reported insurance payments
because respondents were often unaware that their insurer paid
a discounted amount to the provider. This section contains a general
description of the approaches used for these three situations.
A more detailed description of the editing and imputation procedures
is provided in the documentation for the MEPS event-level files,
which are available through the AHRQ Web site at http://www.ahrq.gov/.
For more information on the approach used to impute missing expenditure
data on prescribed medicines, see Moeller, Stagnitti, Horan, et
al. (2000).
Missing data on expenditures were imputed using
a weighted sequential hot-deck procedure for most medical visits
and services. In general, this procedure imputes data from events
with complete information to events with missing information but
similar characteristics. For each event type, selected predictor
variables with known values (e.g., total charge; demographic characteristics;
region; provider type; and characteristics of the event of care,
such as whether it involved surgery) were used to form groups of
donor events with known data on expenditures, as well as identical
groups of recipient events with missing data. Within such groups,
data were assigned from donors to recipients, taking into account
the weights associated with the complex MEPS survey design. Only
MPC data were used as donors for hospital-based events, while data
from both the HC and MPC were used as donors for office-based physician
visits.
Because payments for medical care provided
under capitated reimbursement arrangements and through public clinics
and Department of Veterans Affairs (VA) hospitals are not tied
to particular medical events, expenditures for events covered under
those types of arrangements and settings were also imputed. Events
covered under capitated arrangements were imputed from events covered
under managed care arrangements that were paid based on a discounted
fee-for-service method, while imputations for visits to public
clinics and VA hospitals were based on similar events that were
paid on a fee-for-service basis. As for other events, selected
predictor variables were used to form groups of donor and recipient
events for the imputations.
An adjustment also was applied to some HC-reported
expenditure data because an evaluation of matched HC/MPC data showed
that respondents who reported that charges and payments were equal
were often unaware that insurance payments for the care had been
based on a discounted charge. To compensate for this systematic
reporting error, a weighted sequential hot-deck imputation procedure
was implemented to determine an adjustment factor for HC-reported
insurance payments when charges and payments were reported to be
equal.
In some situations,
it was reported that one charge covered multiple contacts between
a sample person and a
medical provider (e.g., obstetrical services, orthodontia). In
these situations, total payments for the fee (sometimes called
a flat or global fee) were included if the initial service was
provided in 1996. For example, all payments for an orthodontist's
fee that covered multiple visits over 3 years were included if
the initial visit occurred in 1996. However, if a 1996 visit to
an orthodontist was part of a flat fee for which the initial visit
occurred in 1995, then none of the payments for the flat fee were
included. Most of the expenditures for medical care reported by
MEPS participants were associated with medical events that were
not part of a flat-fee arrangement.
Respondents sometimes reported medical events
for which, in actuality, no payments were made. This situation
could occur for several reasons, including when free care or a
free sample of medicine was provided, bad debt was incurred, or
no charge was made for a followup visit (e.g., after a surgical
procedure). These types of events were treated as valid $0 payments
when developing the estimates contained in this report.
Type-of-Service Categories
In addition to expenditures for total health
services (Table 2), expenses are
classified in this report into six broad types of service: hospital
inpatient, ambulatory, prescribed medicines, dental, home health,
and other medical equipment and services. These categories are
described below and, where relevant, in the footnotes to the tables
in this report.
- Hospital inpatient services (Table
3)—This category includes room and board and
all hospital diagnostic and laboratory expenses associated
with the basic facility charge, payments for separately billed
physician inpatient services, and emergency room expenses
incurred immediately prior to inpatient stays. It excludes
expenses for hospital discharges that did not involve an
overnight stay, which are classified as ambulatory expenses.
- Ambulatory services (Table
4)—This category includes expenses for visits
to medical providers seen in office-based settings or clinics,
hospital outpatient departments, emergency rooms (except
visits resulting in an overnight hospital stay), and clinics
owned and operated by hospitals. It also includes expenses
for events reported as hospital admissions without an overnight
stay.
- Prescribed medicines (Table
5)—This category includes expenses for all prescribed
medications that were initially purchased or otherwise obtained
during 1996, as well as any refills.
- Dental services (Table
6)—This category covers expenses for any type
of dental care provider, including general dentists, dental
hygienists, dental technicians, dental surgeons, orthodontists,
endodontists, and periodontists.
- Home health services (Table
7)—This category includes expenses for care
provided by home health agencies and independent home health
providers. Agency providers accounted for most (about 83
percent) of the expenses in this category.
- Other medical equipment and services (Table
8)—This category includes expenses for eyeglasses,
contact lenses, ambulance services, orthopedic items, hearing
devices, prostheses, bathroom aids, medical equipment, disposable
supplies, and other miscellaneous items or services that
were obtained, purchased, or rented during the year. About
half the expenditures in this category were for vision items.
Source-of-Payment Categories
Estimates of sources of payment presented in
this report represent the percentage of the total sum of expenditures
paid for by each source. Sources of payment are classified as follows.
- Out of pocket by user or family.
- Private insurance—Includes payments
made by insurance plans covering hospital and medical care (excluding
payments from Medicare, Medicaid, and other public sources).
Payments from Medigap plans or CHAMPUS and CHAMPVA (Armed-Forces-related
coverage) are included. Payments from plans that provide coverage
for a single service only, such as dental or vision coverage,
are not included.
- Medicare—A federally financed
health insurance plan for the elderly, persons receiving Social
Security disability payments, and most persons with end-stage
renal disease. Medicare Part A, which provides hospital insurance,
is automatically given to those who are eligible for Social Security.
Medicare Part B provides supplementary medical insurance that
pays for medical expenses and can be purchased for a monthly
premium.
- Medicaid—A means-tested government
program jointly financed by Federal and State funds that provides
health care to those who are eligible. Program eligibility criteria
vary significantly by State, but the program is designed to provide
health coverage to families and individuals who are unable to
afford necessary medical care.
- Other public
programs—Includes
payments from the Department of Veterans Affairs (excluding CHAMPVA);
other Federal sources (Indian Health Service, military treatment
facilities, and other care provided by the Federal Government);
various State and local sources (community and neighborhood clinics,
State and local health departments, and State programs other
than Medicaid); and Medicaid payments reported for people who
were not enrolled in the Medicaid program at any time during
the year.
- Other sources—Includes payments
from Worker's Compensation; other unclassified sources (automobile,
homeowner's, or liability insurance, and other miscellaneous
or unknown sources); and other private insurance (any type of
private insurance payments reported for people without private
health insurance coverage during the year as defined in MEPS).
Population Characteristics
In general, estimates in this report are based
on characteristics as of December 31, 1996, or the last date that
the sample person was part of the civilian noninstitutionalized
population living in the United States prior to December 31, 1996.
Age
The respondent was asked to report the age
of each family member as of the date of each interview for Rounds
1, 2, and 3. In this report, age is usually based on the sample
person's age as of December 31, 1996. If data were not collected
during Round 3 because the sample person was out of scope (e.g.,
deceased or institutionalized), then age at the time of the Round
2 interview was used. Similarly, if age at Round 2 was not collected
because the person was out of scope, then age at Round 1 was used.
Race/Ethnicity
Classification by race and ethnicity is based
on information reported for each family member. Respondents were
asked if the race of the sample person was best described as American
Indian, Alaska Native, Asian or Pacific Islander, black, white,
or other. They also were asked if the sample person's main national
origin or ancestry was Puerto Rican; Cuban; Mexican, Mexicano,
Mexican American, or Chicano; other Latin American; or other Spanish.
All persons whose main national origin or ancestry was reported
in one of these Hispanic groups, regardless of racial background,
are classified as Hispanic. Since the Hispanic grouping can include
black Hispanic, white Hispanic, and other Hispanic, the race categories
of black, white, and other do not include Hispanic people.
Health Insurance Status
Individuals under
age 65 were classified into the following three insurance categories
based on household responses
to health insurance status questions administered during Rounds
1–3 of the MEPS HC.
- Any private health insurance—Individuals
who, at any time during the year, had insurance that provides
coverage for hospital and physician care (other than Medicare,
Medicaid, or other public hospital/physician coverage) are classified
as having private insurance. Coverage by CHAMPUS/CHAMPVA (Armed-Forces-related
coverage) is also included as private health insurance. Insurance
that provides coverage for a single service only, such as dental
or vision coverage, is not included.
- Public coverage
only—Individuals
are considered to have public coverage only if they met both
of the following criteria:
- They were not covered by private insurance
at any time during the year.
- They were covered by one of the following
public programs at any point during the year: Medicare,
Medicaid, or other public hospital/physician coverage.
- Uninsured—The uninsured
are defined as people not covered by Medicare, CHAMPUS/CHAMPVA,
Medicaid, other public hospital/physician programs,
or private hospital/physician insurance at any time
during the entire year or period of eligibility for
the survey. Individuals covered only by noncomprehensive
State-specific programs (e.g., Maryland Kidney Disease
Program, Colorado Child Health Plan) or private single-service
plans (e.g., coverage for dental or vision care only,
coverage for accidents or specific diseases) are
not considered to be insured.
Individuals age 65 and over were classified
into the following three insurance categories:
- Medicare only.
- Medicare and private.
- Medicare and other public.
Poverty Status
Each sample person
was classified according to the total 1996 income of his or her
family. Within a household,
all individuals related by blood, marriage, or adoption were considered
to be a family. Personal income from all family members was summed
to create family income. Possible sources of income included annual
earnings from wages, salaries, bonuses, tips, and commissions;
business and farm gains and losses; unemployment and Worker's Compensation;
interest and dividends; alimony, child support, and other private
cash transfers; private pensions, individual retirement account
(IRA) withdrawals, Social Security, and Department of Veterans
Affairs payments; Supplemental Security Income and cash welfare
payments from public assistance, Aid to Families with Dependent
Children and Aid to Dependent Children; gains or losses from estates,
trusts, partnerships, S corporations, rent, and royalties; and
a small amount of "other" income.
Poverty status is the ratio of family income
to the 1996 Federal poverty thresholds, which control for family
size and age of the head of family. Categories are defined as follows:
- Poor—This refers to persons in
families with income less than or equal to the poverty line and
includes those who reported negative income.
- Near-poor—This group includes
persons in families with income over the poverty line through
125 percent of the poverty line.
- Low income—This category includes
persons in families with income over 125 percent through 200
percent of the poverty line.
- Middle income—This category includes
persons in families with income over 200 percent through 400
percent of the poverty line.
- High income—This category includes
persons in families with income over 400 percent of the poverty
line.
Place of Residence
Individuals are identified as residing either
inside or outside a metropolitan statistical area (MSA) as designated
by the U.S. Office of Management and Budget, which applied 1990
standards using population counts from the 1990 U.S. census. An
MSA is a large population nucleus combined with adjacent communities
that have a high degree of economic and social integration with
the nucleus. Each MSA has one or more central counties containing
the area's main population concentration. In New England, metropolitan
areas consist of cities and towns rather than whole counties. MSA
data are based on MSA status as of December 31, 1996. If MSA status
as of December 31 was not known, then MSA status at the time of
the Round 3 interview was used.
Region
Each MEPS sample person was classified as living
in one of the following four regions as defined by the Bureau of
the Census:
- Northeast—Maine, New Hampshire,
Vermont, Massachusetts, Rhode Island, Connecticut, New York,
New Jersey, and Pennsylvania.
- Midwest—Ohio, Indiana, Illinois,
Michigan, Wisconsin, Minnesota, Iowa, Missouri, North Dakota,
South Dakota, Nebraska, and Kansas.
- South—Delaware, Maryland, District
of Columbia, Virginia, West Virginia, North Carolina, South Carolina,
Georgia, Florida, Kentucky, Tennessee, Alabama, Mississippi,
Arkansas, Louisiana, Oklahoma, and Texas.
- West—Montana, Idaho, Wyoming,
Colorado, New Mexico, Arizona, Utah, Nevada, Washington, Oregon,
California, Alaska, and Hawaii.
Perceived Health Status
The MEPS respondent
was asked to rate the health of each person in the family at
the time of the Round 1 and Round
2 interviews according to the following categories: excellent,
very good, good, fair, and poor. Perceived health status in this
report is based primarily on responses obtained in the Round 2
interview. For persons with missing health status in Round 2, however,
the response for health status at Round 1 was used, if available.
In the tables in this report, the five health status categories
were collapsed into the following two broad categories: (1) excellent,
very good, or good health and (2) fair or poor health.
Sample Design and Accuracy of Estimates
The sample selected for the 1996 MEPS, a subsample
of the 1995 NHIS, was designed to produce national estimates that
are representative of the civilian noninstitutionalized population
of the United States. Round 1 data were obtained for approximately
9,400 households in MEPS, resulting in a survey response rate of
78 percent. This figure reflects participation in both NHIS and
MEPS. For Round 2, the response rate was 95 percent, resulting
in a response rate of 74 percent overall from the NHIS interview
through Round 2 of MEPS. For Round 3, the response rate was 95
percent, resulting in a full-year response rate of 70 percent.
The statistics presented in this report are
affected by both sampling error and sources of nonsampling error,
which include nonresponse bias, respondent reporting errors, and
interviewer effects. For a detailed description of the MEPS survey
design, the adopted sample design, and methods used to minimize
sources of nonsampling error, see J. Cohen (1997), S. Cohen (1997),
and Cohen, Monheit, Beauregard, et al. (1996).
The MEPS person-level
estimation weights include nonresponse adjustments and poststratification
adjustments to population
totals obtained from the March 1997 Current Population Survey (CPS)
to reflect Census Bureau estimated population distributions as
of December 1996. The person-level poststratification incorporated
the following variables: poverty status, region, MSA, race/ethnicity,
sex, and age. The weighting process also included poststratification
to population totals obtained from the 1996 Medicare Current Beneficiary
Survey (MCBS) for the number of deaths among Medicare beneficiaries
in 1996, and poststratification to population totals obtained from
the 1996 MEPS Nursing Home Component for the number of individuals
admitted to nursing homes.
Overall, the weighted population estimate for
the civilian noninstitutionalized population as of December 31,
1996, is 265,439,511. The inclusion of people who were in scope
at some time in 1996 but were out of scope (deceased, institutionalized,
active-duty military, or out of the country) as of December 31,
1996, brings the estimated total number of people represented by
MEPS respondents over the course of the year up to 268,905,490.
Tests of statistical
significance were used to determine whether the differences between
populations exist
at specified levels of confidence or whether they occurred by chance.
Differences were tested using Z-scores having asymptotic normal
properties at the 0.05 level of significance. Unless otherwise
noted, only statistically significant differences between estimates
are discussed in the text.
Rounding
Estimates presented in the tables are rounded
as follows:
- Percentages are rounded to the nearest 0.1
percentage point.
- Mean and median
expenditures are rounded to the nearest dollar.
- Total expenditures
are rounded to the nearest million dollar unit.
Some of the estimates
for population totals of subgroups presented in the tables will
not add exactly to the
overall estimated population total as a consequence of rounding.
Standard Error Tables
Table A. Standard errors for events, charges,
and expenses, by event type: United States, 1996
Corresponds to Table 1
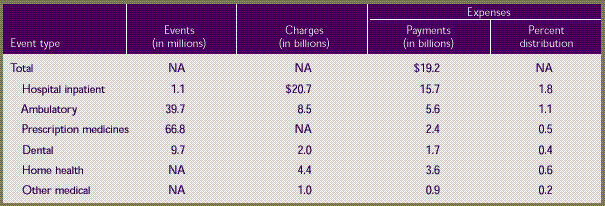
NA— not
available.
Note: These estimates are for a target
population of approximately 268.9 million persons who were in the
civilian noninstitutionalized population for all or part of 1996.
Percents may not add to 100 because rounding.
Source: Center
for Financing, Access, and Cost Trends, Agency for Healthcare
Research and Quality: Medical
Expenditure Panel Survey, 1996.
Table B. Standard
errors for total health servicesmedian and mean expenses per
person with expense and distribution of expenses by source
of payment: United States,
1996
Corresponds to Table 2
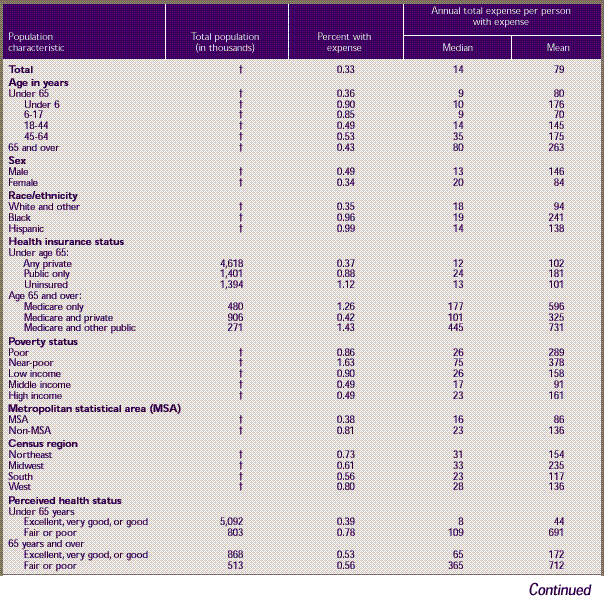
Table B. Standard
errors for total health servicesmedian and mean expenses per
person with expense and distribution of expenses by source
of payment: United States,
1996 (continued)
Corresponds to Table 2
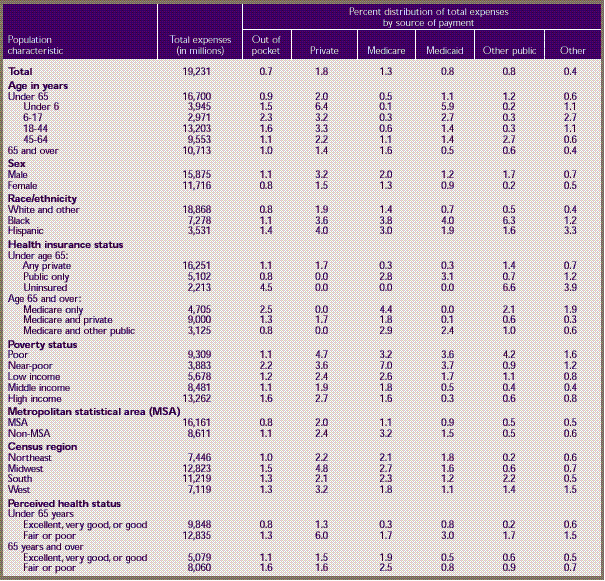
† Standard
error approximately zero because of poststratification to Census
Bureau population
control totals.
Note: Restricted to civilian noninstitutionalized
population.
Source: Center for Financing, Access,
and Cost Trends, Agency for Healthcare Research and Quality: Medical
Expenditure Panel Survey, 1996.
Table C. Standard
errors for hospital inpatient servicesmedian and mean expenses
per person with expense and distribution of expenses by source
of payment: United States,
1996
Corresponds to Table 3
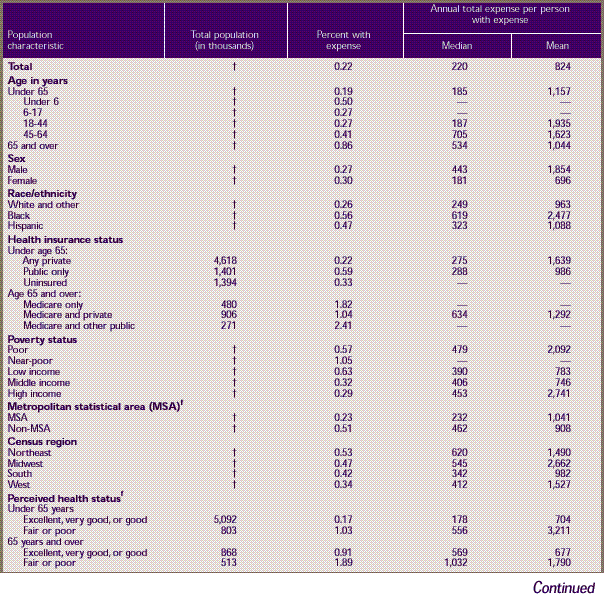
Table C. Standard
errors for hospital inpatient servicesmedian and mean expenses
per person with expense and distribution of expenses by source
of payment: United States,
1996 (continued)
Corresponds to Table 3
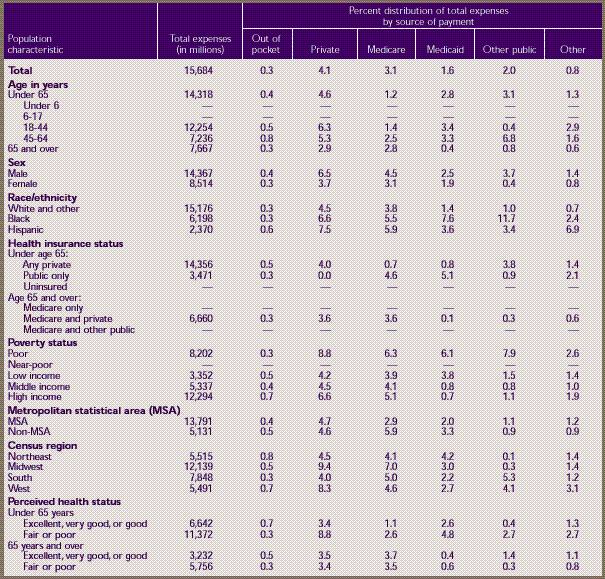
† Standard
error approximately zero because of poststratification to Census
Bureau population control totals.
– Less than
100 sample cases with expenses.
Note: Restricted
to civilian noninstitutionalized population.
Source: Center
for Financing, Access, and Cost Trends, Agency for Healthcare Research
and Quality: Medical Expenditure Panel Survey, 1996
Table D. Standard
errors for ambulatory servicesmedian
and mean expenses per person with expense and distribution of
expenses by source of payment: United States, 1996
Corresponds to Table 4
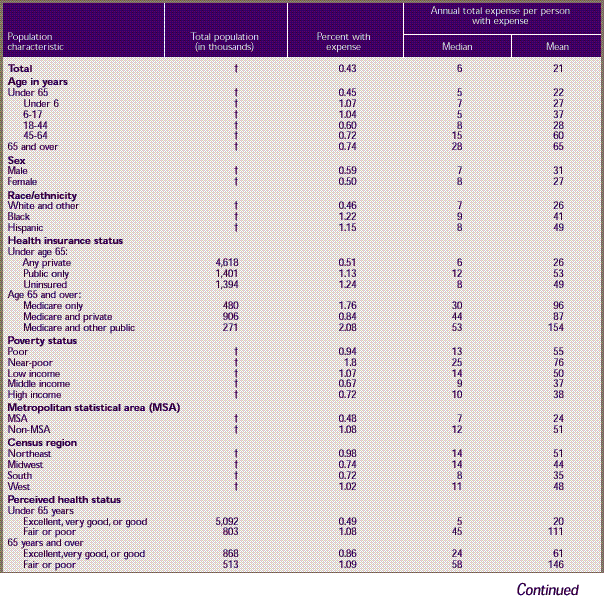
Table D. Standard
errors for ambulatory servicesmedian
and mean expenses per person with expense and distribution of
expenses by source of payment: United States, 1996 (continued)
Corresponds to Table 4
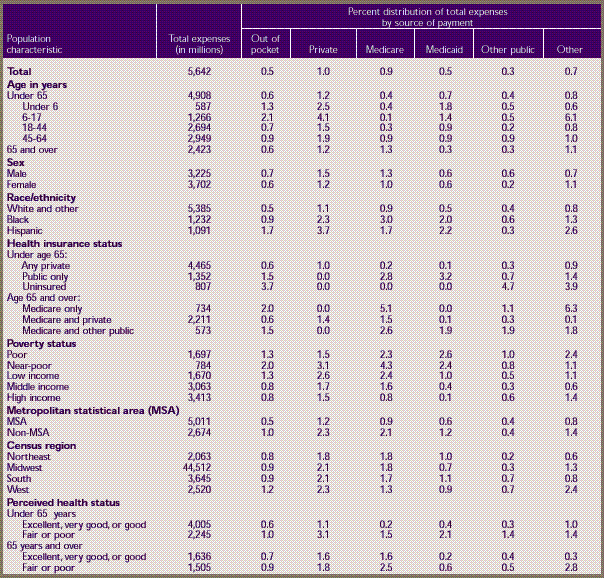
† Standard
error approximately zero because of poststratification to Census
Bureau population control totals.
Note: Restricted to civilian noninstitutionalized
population. Percents may not add to 100 because of rounding.
Source: Center
for Financing, Access, and Cost Trends, Agency for Healthcare
Research and Quality: Medical
Expenditure Panel Survey, 1996.
Table E. Standard
errors for prescription medicinesmedian and mean expenses
per person with expense and distribution of expenses by source
of payment: United States,
1996
Corresponds to Table 5

Table E. Standard
errors for prescription medicinesmedian and mean expenses
per person with expense and distribution of expenses by source
of payment: United States,
1996 (continued)
Corresponds to Table 5
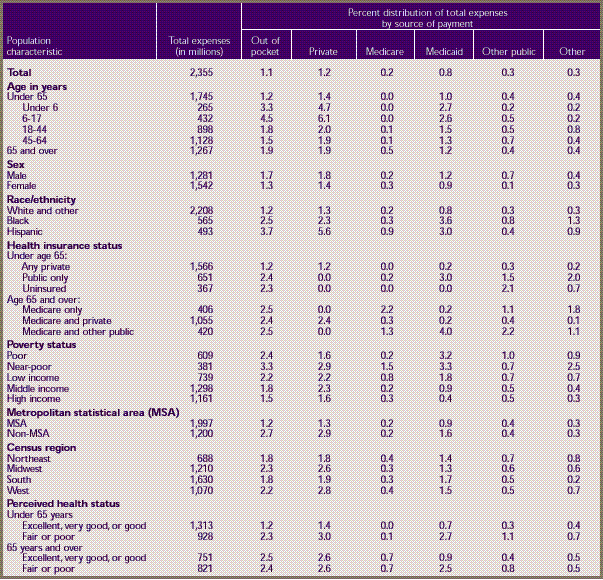
† Standard
error approximately zero because of poststratification to Census
Bureau population control totals.
Note: Restricted to civilian noninstitutionalized
population.
Source: Center
for Financing, Access, and Cost Trends, Agency for Healthcare
Research and Quality: Medical
Expenditure Panel Survey, 1996.
Table F. Standard
errors for dental servicesmedian
and mean expenses per person with expense and distribution of
expenses by source of payment: United States, 1996
Corresponds to Table 6

Table F. Standard
errors for dental servicesmedian
and mean expenses per person with expense and distribution of
expenses by source of payment: United States, 1996 (continued)
Corresponds to Table 6
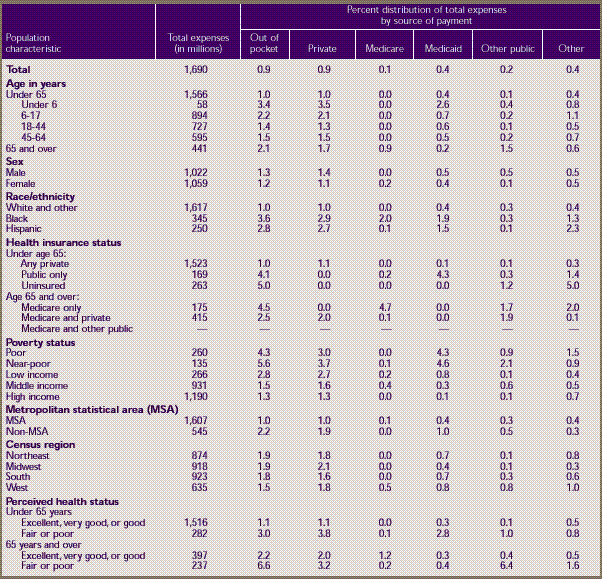
† Standard
error approximately zero because of poststratification to Census
Bureau population control totals.
– Less than
100 sample cases with expenses.
Note: Restricted
to civilian noninstitutionalized population. Percents may not add
to 100 because of rounding.
Source: Center
for Financing, Access, and Cost Trends, Agency for Healthcare Research
and Quality: Medical Expenditure Panel Survey, 1996.
Table G. Standard
errors for home health servicesmedian
and mean expenses per person with expense and distribution of
expenses by source of payment: United States, 1996
Corresponds to Table 7
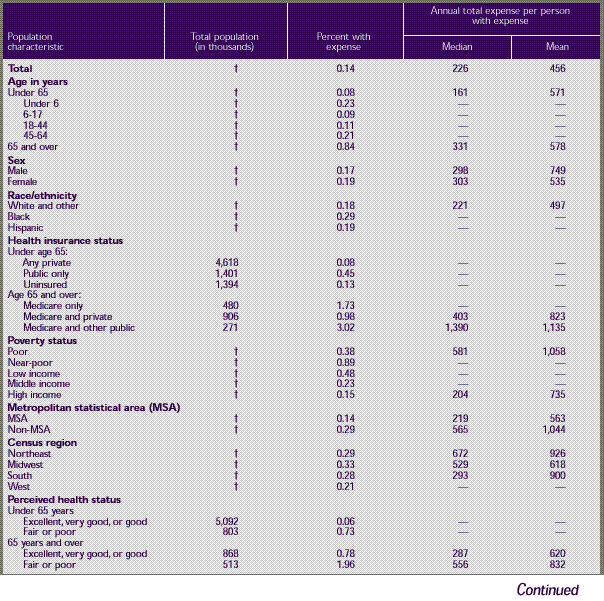
Table G. Standard
errors for home health servicesmedian
and mean expenses per person with expense and distribution of
expenses by source of payment: United States, 1996 (continued)
Corresponds to Table 7

† Standard
error approximately zero because of poststratification to Census
Bureau population control totals.
– Less than
100 sample cases with expenses.
Note: Restricted
to civilian noninstitutionalized population. Percents may not add
to 100 because of rounding.
Source: Center
for Financing, Access, and Cost Trends, Agency for Healthcare Research
and Quality: Medical Expenditure Panel Survey, 1996.
Table H. Standard
errors for other medical equipment and servicesmedian and
mean expenses per person with expense and distribution of expenses
by source of payment: United
States, 1996
Corresponds to Table 8

Table H. Standard
errors for other medical equipment and servicesmedian and
mean expenses per person with expense and distribution of expenses
by source of payment: United
States, 1996 (continued)
Corresponds to Table 8
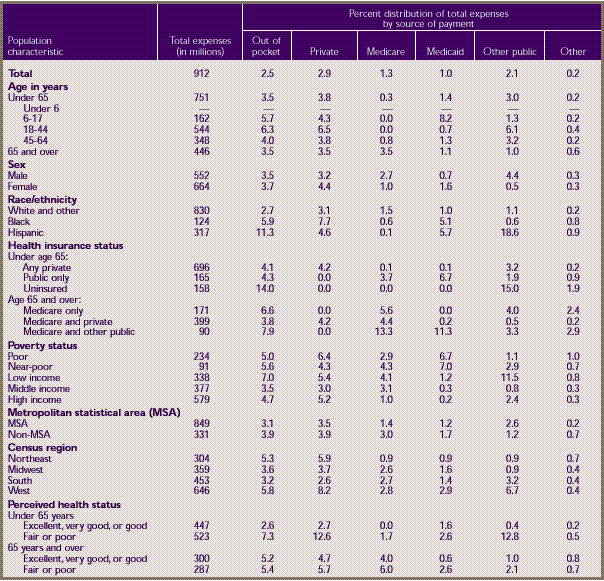
† Standard
error approximately zero because of poststratification to Census
Bureau population control totals.
– Less than
100 sample cases with expenses.
Note: Restricted to civilian noninstitutionalized
population. Percents may not add to 100 because of rounding.
Source: Center for Financing, Access,
and Cost Trends, Agency for Healthcare Research and Quality: Medical
Expenditure Panel Survey, 1996.
^top
Suggested
Citation:
Cohen, J. W., Machlin, M. R., Zuvekas, S. H., Stagnitti,
M. N., and Thorpe, J. M. Research Findings #12: Health Care Expenses in the United States, 1996. December 2000. Agency
for Healthcare Research and Quality, Rockville,
MD.
http://www.meps.ahrq.gov/data_files/publications/rf12/rf12.shtml |
|
