Research Findings #3: Access to Health Care - Sources and Barriers,
1996
Robin M. Weinick, Ph.D., Samuel H. Zuvekas,
Ph.D., and Susan Drilea, M.S.
Introduction
Adequate access to health
care services can significantly influence health
care use and health outcomes. Consequently, measures
of access to care provide an important mechanism
for evaluating the quality of the Nation's health
care system. Limitations in access to care extend
beyond such simple issues as a shortage of health
care providers or facilities in some areas. Even
where health care services are readily available,
individuals may not have a usual source of health
care or may experience barriers to receiving services
because of financial or insurance restrictions,
a lack of availability of providers at night or
on weekends, or other difficulties.
This report describes several
aspects of access to health care in America in 1996,
including the proportion of the population lacking
a usual source of care as well as the types and
characteristics of providers used by those who do
have a usual source of care. A number of measures
of satisfaction with the usual source of health
care are presented. Estimates also are reported
on the percentage of American families that experience
difficulty or delay in obtaining health care or
do not receive needed health care services. Specific
comparisons are made by age, race/ethnicity, sex,
perceived health status, health insurance coverage,
and place of residence.
This report presents estimates
of access to health care by the civilian noninstitutionalized
population of the United States during 1996. The
estimates are derived from 1996 Medical Expenditure
Panel Survey (MEPS) Household Component (HC) data.
A technical appendix at the end of this report presents
detailed descriptions of the MEPS HC, including
data collection methods, questionnaire items, data
editing, sample sizes, and statistical procedures
for deriving estimates.
^top
Usual
Sources of Health Care
Access to health care is a complex, multidimensional
concept. Having a usual source of health care is one indicator
of access that has been studied extensively. Among other findings,
persons with a usual source of health care have been shown to
be more likely than those without a usual source of care to
receive a variety of preventive health care services (Caplan
and Haynes, 1996; Ettner, 1996; Mark and Paramore, 1996; Martin,
Calle, Wingo, et al., 1996) and to receive treatment if they
have hypertension (Moy, Bartman, and Weir, 1995).
Table 1 presents
a profile of Americans' usual sources of health care in 1996.
Nearly 18 percent of the population (17.6 percent) did not have
a usual source of health care. Thus, more than 46 million Americans
had no particular doctor's office, clinic, health center, or
other place that they would usually go if they were sick or
needed advice about their health. Among those who did have a
usual source of health care, 88.3 percent (72.7 percent of all
Americans) had an office-based provider and 11.2 percent (9.2
percent of all Americans) had a hospital outpatient department
or clinic as their usual source of care.
Population Characteristics
Americans' usual sources of health care
can vary among groups with different demographic and health-related
characteristics, including age, race/ethnicity, sex, perceived
health status, health insurance coverage, and place of residence.
Age
Young children and elderly adults were
more likely than adults ages 18-64 to have a usual source of
health care. Still, 5.5 percent of children under age 6, representing
more than 1.3 million children, did not have a usual source
of health care. Likewise, 9.2 percent of persons age 65 and
over had no usual source of health care.
Approximately 23 percent of persons ages
18-64 had no usual source of health care (not shown in Table
1). Young adults ages 18-24 were more likely than any other
age group to lack a usual source of health care (34.0 percent).
Race/Ethnicity
Among the racial/ethnic groups considered
in this report, Hispanics were the least likely to have a usual
source of care. Almost 30 percent (29.6 percent) of Hispanics
lacked a usual source of care, compared with 20.2 percent of
blacks and 15.5 percent of a combined category of whites and
other racial/ethnic groups.
Among those who had a usual source of
care, blacks and Hispanics were more likely than those in the
group of whites and others to have hospital-based providers
(including hospital clinics and outpatient departments) as their
usual source of care. Conversely, whites and other racial/ethnic
groups were more likely to have an office-based usual source
of care.
Sex
Males were substantially more likely to
lack a usual source of health care than females (21.3 percent
versus 14.1 percent). Males were also less likely than females
to have an office-based usual source of care (69.3 percent vs.
76.0 percent).
Perceived
Health Status
Persons whose perceived health status
was poor were more likely to have a usual source of health care
than persons whose health status was reported to be excellent,
very good, or good. Even so, 10.1 percent of those whose health
status was reported to be poor had no usual source of health
care; this represents nearly 800,000 Americans.
Health Insurance Coverage
Health insurance coverage can be an important
determinant of many aspects of access to health care. Table
1 shows that persons under age 65 who were uninsured were
substantially more likely to lack a usual source of health care
(38.0 percent) than those who had either private (14.5 percent)
or public health insurance (13.3 percent). When compared with
their counterparts who had private health insurance, persons
under age 65 who were uninsured were 2.6 times more likely to
lack a usual source of health care. Persons under age 65 who
had private insurance were more likely to have an office-based
usual source of care (77.2 percent) than those who had public
insurance (70.8 percent) or were uninsured (51.8 percent).
Individuals age 65 and over who had Medicare
as their only health insurance coverage were more likely to
lack a usual source of health care (11.9 percent) than persons
with Medicare and additional public or private insurance coverage
(7.7 percent; not shown in Table 1). In addition, among persons
age 65 and over who had a usual source of health care, those
with health insurance coverage in addition to Medicare were
more likely to have an office-based usual source of care than
those for whom Medicare was the sole source of insurance (not
shown in Table 1).
Metropolitan Statistical Areas
Americans living in metropolitan statistical
areas (MSAs) were more likely to lack a usual source of health
care (18.1 percent) than those living outside of MSAs (15.8
percent).
Other Characteristics
Other important aspects of access to care
include reasons why people change their usual source of care,
types and characteristics of usual sources of health care, and
satisfaction.
Changes in Usual Source of Care
The extent to which individuals change
their usual source of health care is of interest when examining
access to health care, as it may reflect a lack of continuity
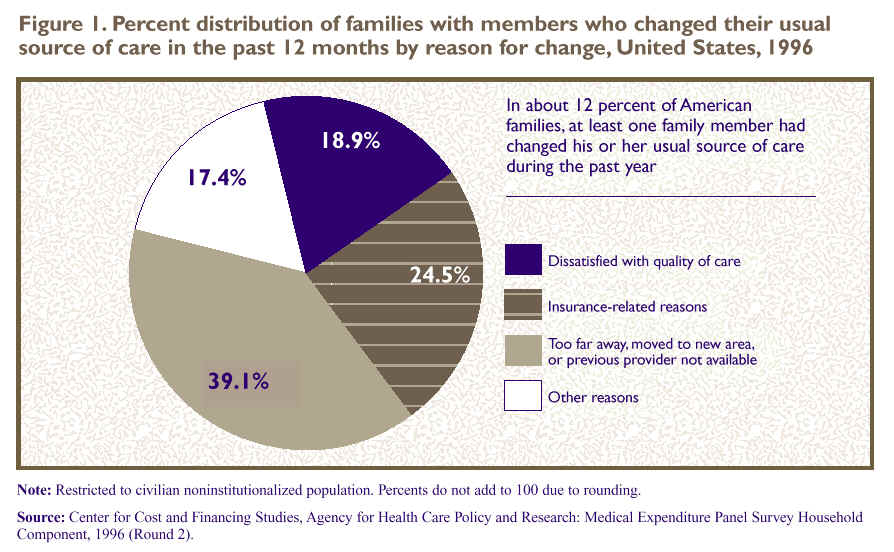
of care, dissatisfaction with care, or poor quality. In approximately
12 percent of American families, at least one member had changed
his or her usual source of health care within the 12-month period
prior to the survey date. To the extent that this represents
an annual rate of change in usual source of care, it suggests
a fairly high rate of turnover in the long run. The reasons
why family members changed their usual source of health care
are displayed in Figure 1. Nearly 25 percent
(24.5 percent) of the families with members who changed their
usual source of care switched for insurance-related reasons,
including having changed health insurance plans or the insurance
plan having changed the doctors it covers. Another 18.9 percent
had family members who made a change because they were dissatisfied
with the quality of care they ere receiving. Almost 40 percent
(39.1 percent) had changed their usual source of health care
because their provider was too far away, they had moved to a
new area, or their previous provider was no longer available.
The remaining 17.4 percent changed their usual source of care
for a variety of other reasons, such as a change in their health
care needs.
Types of
Office-Based Providers
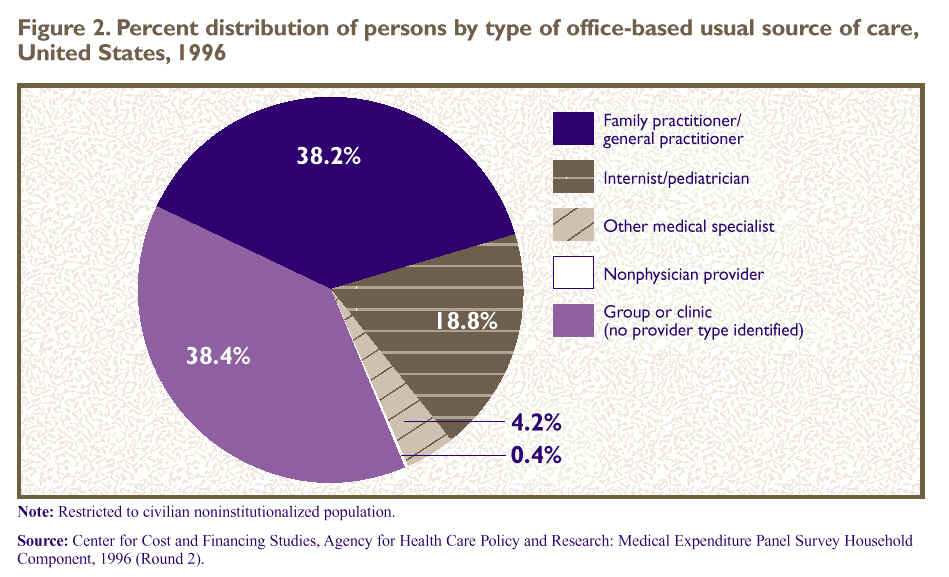
Figure 2 displays
the types of health care providers for the 72.7 percent of Americans
who had an office-based usual source of health care. Of this
group, 38.2 percent had a family practitioner or general practitioner,
18.8 percent had an internist or pediatrician, and 4.2 percent
had another medical specialist--such as an obstetrician/gynecologist
or surgeon--as their usual provider. Another 38.4 percent had
a group or clinic practice as their usual source of health care,
without a particular provider type identified.
Nonphysician providers, including nurses,
nurse practitioners, physician's assistants, midwives, and chiropractors,
comprised less than 1 percent of office-based usual sources
of care for Americans in 1996. However, because many nonphysician
providers practice in group or clinic settings, this probably
understates the impact such providers have on the health care
of the American population.
Characteristics of Usual Sources
of Care
Table 2 describes
the characteristics of Americans' usual sources of health care
(excluding emergency rooms). Nearly half (48.6 percent) of people
whose usual source of health care was either office based or
a hospital outpatient department or clinic had providers with
office hours at night or on weekends. They represented nearly
105 million Americans. Approximately three-fourths (76.3 percent)
usually had an appointment to see their provider, and 23.2 percent
(or 50 million people) found it very difficult or somewhat difficult
to contact their provider by telephone.
Continuity of Care and Satisfaction
Continuity of care and satisfaction with
usual source of health care are additional aspects of access
to care, and they are also key components of quality health
care. Table 3 profiles several dimensions
of satisfaction and continuity of care for the 82 percent of
Americans who had office-based, hospital outpatient department,
or hospital clinic providers as their usual source of care.
Levels of satisfaction with the usual
source of health care were quite high. Nearly all Americans
whose usual source was not an emergency room were "somewhat
satisfied" or "very satisfied" with the overall
quality of care received (97.1 percent) and with the professional
staff (95.5 percent). An equally high proportion of people (96.6
percent) had a usual provider who generally listened to them
and gave them the information they needed about health and health
care. Likewise, 95.9 percent were confident in their usual provider's
ability to help when they had a medical problem. Americans who
had a usual source of health care were overwhelmingly satisfied
with and confident in their provider. However, continuity of
care, as measured by whether their usual provider typically
asked about prescription medications and treatments provided
by other doctors, was experienced by only 77.4 percent of Americans
with a usual source of health care.
^top
Barriers
to Care
American families' experiences of difficulty
in obtaining health care, delays in obtaining care, or not receiving
the health care that family members thought they needed are
shown in Table 4. Approximately 12.8 million
families (11.6 percent of American families) experienced difficulty
or delay in obtaining care or did not receive needed health
care services for one or more of the reasons asked about in
the MEPS HC. (These reasons are shown in detail in the technical
appendix.)
Among families that experienced barriers
to care, inability to afford health care was cited by the majority
(59.9 percent) as the main reason for family members' difficulty,
delay, or not receiving needed health care. Another 19.5 percent
cited insurance-related reasons as the main obstacle to receiving
needed health care. These reasons included their insurance company
not approving, covering, or paying for care; having pre-existing
conditions (for which insurance coverage is often restricted);
referrals being required but unobtainable; and doctors' refusing
to accept the family's insurance plan. The remaining 20.7 percent
of families experienced a variety of other problems receiving
health care, including transportation problems, physical barriers,
communication problems, child care limitations, lack of time
or information, or refusal of services.
Barriers to care vary among families with
different demographic and health characteristics, including
race/ethnicity, perceived health status, and health insurance
status.
Race/Ethnicity of Head of Family
Families with a Hispanic head of the family
were more likely to report barriers to receiving health care
(15.1 percent) than those with heads of family who were either
black (9.9 percent) or white or other race/ethnicity (11.4 percent).
Among families that encountered problems in receiving care,
those headed by Hispanics also were more likely (69.1 percent)
than those headed by persons in the white and other group (58.5
percent) to be unable to afford health care.
Perceived Health Status
Families in which any member's health
status was reported as either fair or poor were almost twice
as likely to experience difficulty, delay, or lack of health
care (17.9 percent) as families in which all members' health
status was reported as excellent, very good, or good (9.9 percent).
There were no significant differences by health status in the
types of problems experienced.
Health Insurance Coverage
Families in which one or more members
lacked health insurance were 2.9 times more likely to experience
difficulty or delay in obtaining health care or to not receive
needed care than families in which all members were insured
(not shown in Table 4). For example, families in which all members
were uninsured were more likely to experience barriers to needed
health care (27.1 percent) than the average for all families
(11.6 percent). This represents almost 3.3 million uninsured
families in which at least one family member experienced difficulty
or delay or did not receive needed health care. Among these,
87.0 percent, or nearly 2.9 million families, identified their
main problem as being unable to afford care.
Families in which only some members were
uninsured were more likely to experience barriers to needed
health care than the average family. Table4 shows
that problems were experienced by:
-
18.1 percent of families
with some uninsured and some privately insured.
-
21.8 percent of families
with some uninsured and some publicly insured.
-
27.5 percent of families
with some uninsured, some privately insured, and some publicly
insured.
Similarly, among families that experienced
obstacles to receiving health care, those in which one or more
members were uninsured generally were more likely than other
families to report the inability to afford care as their main
barrier. Families in which all members were privately insured
were the least likely to report barriers to care (7.0 percent).
^top
Conclusions
Data from the 1996 MEPS HC indicate that satisfaction
with usual source of health care is nearly universal. Even so, almost
12 percent of families had members who had changed their usual source
of care within the last 12 months, frequently for quality-of-care or
insurance-related reasons. A 12-percent annual rate of change suggests
a potentially high rate of turnover in usual sources of health care
in the long run.
Nearly 18 percent of the civilian noninstitutionalized
population had no usual source of health care in 1996, and almost 12
percent of families had members who experienced difficulty or delay
in obtaining health care or did not receive needed care. However, these
experiences were not distributed evenly across the population. Two
groups were consistently at higher risk of lacking a usual source of
care and experiencing barriers to obtaining care: Hispanics and the
uninsured.
Hispanic Americans were substantially more likely
than other Americans to lack a usual source of health care and were
more likely to use hospital-based sources when they did have a usual
source of care. In addition, families with a Hispanic head of family
were more likely than others to experience obstacles to receiving care,
particularly the inability to afford health care. This lack of access
to health care among the Hispanic population of the United States may
reflect the fact that they were among the most likely to be uninsured
(Beauregard, Drilea, and Vistnes, 1997; istnes and Monheit, 1997).
Lacking health insurance is a major factor associated
with the access-to-care measures presented in this report. Uninsured
individuals under age 65 were substantially more likely than others
to lack a usual source of health care. Similarly, families in which
one or more members lacked health insurance were more likely than other
families to experience obstacles that resulted in difficulty or delays
in receiving care or not receiving needed medical care. Among families
that experienced such barriers, those with uninsured members generally
were more likely than those in which everyone had health insurance
to be unable to afford needed health care.
While there are substantial barriers to access
to health care among persons and families that are uninsured, having
health insurance does not guarantee that health care will be accessible
or affordable. A substantial minority of persons with private health
insurance still reported having no usual source of care. Similarly,
more than two-thirds of privately insured families experiencing barriers
to health care cited affordability or health insurance problems as
the main reason for their difficulty. MEPS results indicate that insurance
coverage is strongly associated with access to health care. Monitoring
the relationship between health insurance coverage and measures of
access to health care will provide important information in future
years as the Nation continues efforts to constrain health care costs
while placing increased emphasis on quality of care.
^top
Tables
Table 1. Percent distribution
of population by usual source of health care and selected population
characteristics, United States, 1996
| Population
characteristics |
Total
population in thousands |
No
usual source of health care |
Usual
source of health care is: |
| Office-baseda |
Hospital
outpatient department or clinicb |
Emergency
room |
| Totalc |
262,654
|
Percent
distribution of population
|
17.6
|
72.7
|
9.2
|
0.5
|
| Age
in years |
| Under
6 |
24,164
|
5.5
|
83.8
|
10.1
|
*0.5
|
| 6-17 |
47,253
|
10.4
|
80.2
|
9.0
|
*0.4
|
| 18-24 |
24,854
|
34.0
|
57.4
|
7.6
|
*1.0
|
| 25-54 |
114,359
|
22.7
|
68.1
|
8.8
|
0.4
|
| 55-64 |
20,899
|
13.2
|
75.2
|
10.9
|
*0.7
|
| 65
and over |
31,125
|
9.2
|
80.3
|
10.1
|
*0.4
|
| Race/ethnicity |
| Hispanic |
28,350
|
29.6
|
57.9
|
11.9
|
0.6
|
| Black |
32,838
|
20.2
|
63.6
|
14.9
|
*1.3
|
| White
and other |
201,466
|
15.5
|
76.3
|
7.8
|
0.3
|
| Sex |
| Male |
127,922
|
21.3
|
69.3
|
8.9
|
0.4
|
| Female |
134,732
|
14.1
|
76.0
|
9.4
|
0.5
|
| Perceived
health status |
| Excellent |
95,817
|
18.4
|
73.0
|
8.2
|
0.3
|
| Very
good |
79,193
|
18.3
|
72.4
|
8.8
|
0.5
|
| Good |
58,405
|
18.0
|
71.9
|
9.5
|
*0.5
|
| Fair |
21,115
|
13.3
|
73.1
|
12.8
|
*0.8
|
| Poor |
7,868
|
10.1
|
77.8
|
10.9
|
*1.2
|
| Health
insurance statusd |
| Under
age 65: |
| Any
private |
161,356
|
14.5
|
77.2
|
8.1
|
0.2
|
| Public
only |
26,278
|
13.3
|
70.8
|
14.5
|
1.4
|
| Uninsured |
43,896
|
38.0
|
51.8
|
9.1
|
1.1
|
| Age
65 and over: |
| Medicare
only |
8,123
|
11.9
|
74.9
|
12.8
|
*0.4
|
| Medicare
and private |
19,344
|
7.5
|
83.4
|
8.7
|
*0.3
|
| Medicare
and other public |
3,056
|
8.9
|
78.3
|
12.2
|
*0.5
|
| Metropolitan
statistical area (MSA) |
| MSA |
208,887
|
18.1
|
72.3
|
9.1
|
0.4
|
| Non-MSA |
53,767
|
15.8
|
74.3
|
9.3
|
*0.6
|
- aIncludes
all types of physicians and nonphysician providers seen in an office
setting as well as office-based group practices or clinics.
- bIncludes
outpatient departments and clinics owned and operated by hospitals.
- cIncludes
individuals with unknown health status and those few individuals
age 65 and over who did not have Medicare. Excludes a small number
of persons who were eligible for data collection in the first half
of 1996 but died or were institutionalized in the second half of
the year. See Technical Appendix for details.
- dThis
refers to health insurance status during the first half of 1996.
Uninsured refers to persons uninsured during the entire period.
Public and private insurance categories refer to individuals with
public or private insurance at any time during the period; individuals
with both public and private insurance are considered privately
insured. CHAMPUS and CHAMPVA (Armed-Forces-related coverage) are
considered private health insurance in this report.
- *Relative standard error
is greater than or equal to 30 percent.
Note: Restricted to
civilian noninstitutionalized population. Percents may not add to
100 due to rounding.
Source: Center for
Financing, Access, and Cost Trends, Agency for Health Care Policy
and Research: Medical Expenditure Panel Survey Household Component,
1996 (Rounds 1 and 2).
^top
Table 2. Percent of population by selected characteristics
of usual source of health care, United States, 1996
| Characteristics
of usual source of care |
Percent |
Population
in thousands |
| Has
office hours at night or on weekends |
48.6
|
104,676
|
| Usually
have an appointment |
76.3
|
164,137
|
| Somewhat
difficult or very difficult to contact by telephone |
23.2
|
49,904
|
Note: Excludes
individuals whose usual source of care is an emergency room. Restricted
to civilian noninstitutionalized population.
Source: Center
for Financing, Access, and Cost Trends, Agency for Health Care Policy
and Research: Medical Expenditure Panel Survey Household Component,
1996 (Round 2).
^top
Table 3. Percent of population by satisfaction
with usual source of health care and continuity of care, United
States, 1996
| Satisfaction
or continuity of care |
Percent |
Population
in thousands
|
| Somewhat
satisfied or very satisfied with overall quality of care |
97.1
|
208,976
|
| Somewhat
satisfied or very satisfied with professional staff |
95.5
|
205,469
|
| Provider
generally listens to them and gives them needed health information |
96.6
|
207,786
|
| Confident
in provider's ability to help with a medical problem |
95.9
|
206,443
|
| Provider
usually asks about prescription medications and treatments
from other doctors |
77.4
|
166,539
|
Note: Excludes
individuals whose usual source of care is an emergency room. Restricted
to civilian noninstitutionalized population.
Source: Center
for Financing, Access, and Cost Trends, Agency for Health Care Policy
and Research: Medical Expenditure Panel Survey Household Component,
1996 (Round 2).
^top
Table 4. Percent of families with members experiencing
difficulty or delay in obtaining health care or not receiving needed
health care by main problem in receiving care and family characteristics,
United States, 1996
Family
characteristics
|
Total
number of families in thousands
|
Percent
with any problem
|
Main
problem
|
Inability
to afford care
|
Insurance-related
reasonsa
|
Other
problemsb
|
| Total |
110,207
|
11.6
|
Percent
distribution of families with problem
|
59.9
|
19.5
|
20.7
|
| Race/ethnicity
of head of family |
| Hispanic |
9,408
|
15.1
|
69.1
|
15.8
|
15.0
|
| Black |
12,770
|
9.9
|
60.4
|
12.3
|
27.3
|
| White
and other |
88,029
|
11.4
|
58.5
|
20.9
|
20.6
|
| Perceived
health statusc |
| Any family
member in fair or poor health |
23,227
|
17.9
|
60.9
|
17.9
|
21.3
|
| All family
members in excellent,very good, or good health |
86,938
|
9.9
|
59.3
|
20.3
|
20.4
|
| Health
insurance status of familyd |
| All members
private insurance |
68,539
|
7.0
|
36.7
|
32.2
|
31.1
|
| All members
public insurance |
12,495
|
12.2
|
46.2
|
21.8
|
32.0
|
| All members
uninsured |
12,125
|
27.1
|
87.0
|
6.0
|
7.0
|
| Some
private, some uninsured |
8,006
|
18.1
|
77.4
|
14.2
|
*8.5
|
| Some
public, some uninsured |
4,250
|
21.8
|
80.8
|
*2.5
|
16.7
|
| Some
private, some public |
3,830
|
12.6
|
--
|
--
|
--
|
| Some
private, some public, some uninsured |
962
|
27.5
|
--
|
--
|
--
|
| Metropolitan
statistical area (MSA) |
| MSA |
87,972
|
11.5
|
59.4
|
19.9
|
20.7
|
| Non-MSA |
22,235
|
12.0
|
61.6
|
17.9
|
20.6
|
- aIncludes
insurance company wouldn't approve, cover, or pay for care; pre-existing
condition; insurance required a referral but couldn't get one;
doctor refused to accept family's insurance plan.
- bIncludes
transportation problems (medical care was too far away, can't drive
or don't have car/no public transportation available, too expensive
to get there); physical problems (hard to get into building, hard
to get around inside building, no appropriate equipment in office);
communication problems (hearing impairment or loss, different language);
and other problems (couldn't get time off work, didn't know where
to go to get care, was refused services, couldn't get child care,
didn't have time or took too long).
- cA
small number of families with missing health status for all family
members are excluded from this breakdown but included in the total
line of the table. See Technical Appendix for details.
- dRefers
to health insurance status during the first half of 1996. Uninsured
refers to persons uninsured during the entire period. The public
and private insurance categories refer to individuals with public
or private insurance at any time during the period; individuals
with both public and private insurance are considered privately
insured. CHAMPUS and CHAMPVA (Armed-Forces-related coverage) are
considered private health insurance in this report.
- *Relative
standard error is greater than or equal to 30 percent.
- Sample sizes
are too small to support reliable estimation.
Note: Restricted
to civilian noninstitutionalized population. Percents may not add
to 100 due to rounding .Source: Center for
Financing, Access, and Cost Trends, Agency for Health Care Policy
and Research: Medical Expenditure Panel Survey Household Component,
1996 (Rounds 1 and 2).
^top
References
Beauregard KM, Drilea SK,
Vistnes JP. The uninsured in America--1996. Rockville (MD): Agency
for Health Care Policy and Research; 1997. MEPS Highlights No.
1. AHRQ Pub. No. 97-0025.
Caplan LS, Haynes SG. Breast
cancer screening in older women. Public Health Review 1996;24(2):193-204. Cohen
J. Design and methods of the Medical Expenditure Panel Survey Household
Component. Rockville (MD): Agency for Health Care Policy and Research;
1997. MEPS Methodology Report No. 1. AHRQ Pub. No. 97-0026.
Cohen JW, Monheit AC, Beauregard
KM, et al. The Medical Expenditure Panel Survey: a national health
information resource. Inquiry 1996;33:373-9.
Cohen S. Sample design of
the 1996 Medical Expenditure Panel Survey Household Component. Rockville
(MD): Agency for Health Care Policy and Research; 1997. MEPS
Methodology Report No. 2. AHRQ Pub. No. 97-0027.
Ettner
SL. The timing of preventive services for women and children:
the effect of having a usual source of care. American Journal of Public
Health 1996;86(12):1748-54.
Mark TL, Paramore LC. Pneumococcal
pneumonia and influenza vaccination: access to and use by U.S. Hispanic
Medicare beneficiaries. American Journal of Public Health 1996;86(11):1545-50.
Martin LM, Calle EE, Wingo
PA, Heath CW Jr. Comparison of mammography and Pap test use from
the 1987 and 1992 National Health Interview Surveys: are we closing
the gap? American Journal of Preventive Medicine 1996;12(2):82-90. Moy
E, Bartman BA, Weir MR. Access to hypertensive care: effects of income,
insurance, and source of care. Archives of Internal Medicine 1995;155(14):1497-1502.
Vistnes JP, Monheit AC. Health
insurance status of the U.S. civilian noninstitutionalized population:
1996. Rockville (MD): Agency for Health Care Policy and Research;
1997. MEPS Research Findings No. 1. AHRQ Pub. No. 97-0030.
^top
Technical
Appendix
The data in this report were
obtained in the first and second rounds of interviews for the Household
Component (HC) of the 1996 Medical Expenditure Panel Survey (MEPS).
MEPS is cosponsored by the Agency for Health Care Research and Quality
(AHRQ) and the National Center for Health Statistics (NCHS). The
MEPS HC is a nationally representative survey of the U.S. civilian
noninstitutionalized population that collects medical expenditure
data at both the person and household levels. The focus of the MEPS
HC is to collect detailed data on demographic characteristics, health
conditions, health status, use of medical care services, charges
and payments, access to care, satisfaction with care, health insurance
coverage, income, and employment. In other components of MEPS, data
are collected on residents of licensed or certified nursing homes
and the supply side of the health insurance market.
The sample for the MEPS HC
was selected from respondents to the 1995 National Health Interview
Survey (NHIS), which was conducted by NCHS. NHIS provides a nationally
representative sample of the U.S. civilian noninstitutionalized population
and reflects an oversampling of Hispanics and lacks. The MEPS HC
collects data through an overlapping panel design. In this design,
data are collected through a precontact interview that is followed
by a series of five rounds of interviews over 2 1/2 years. Interviews
are conducted with one member of each family, who reports on the
health care experiences of the entire family. Two calendar years
of medical expenditure and utilization data are collected from each
household and captured using computer-assisted personal interviewing
(CAPI). This series of data collection rounds is launched again each
subsequent year on a new sample of households to provide overlapping
panels of survey data that will provide continuous and current estimates
of health care expenditures. The reference period for Round 1 of
the MEPS HC was from January 1, 1996, to the date of the first interview,
which occurred during the period from March through July 1996. The
reference period for Round 2 of the MEPS HC was from the date of
the first interview (March-July 1996) to the date of the second interview,
which took place during the period from August through November 1996.
Information
on Access to Care
A supplementary module on
access to care was administered in Round 2 of the MEPS HC. This supplement
serves a number of purposes in MEPS. It gathers information on three
main topic areas: whether each family member has a usual source of
health care, the characteristics of usual sources of health care
for the family, and barriers the family has faced in obtaining needed
health care.
Usual Source of Health
Care
For each family member, the
MEPS interviewer ascertains whether there is a particular doctor's
office, clinic, health center, or other place that the individual
usually goes when sick or in need of health advice. For those family
members who do not have a usual source of health care, the interviewer
ascertains the reason or reasons why. If any family members changed
their usual source of health care during the 12 months prior to the
Round 2 interview, information is obtained on the reason why this
change was made.
Characteristics of Usual
Source of Health Care
For each unique usual source
of health care provider for a given family, the interviewer asks
for the following information:
-
Is the provider
a medical doctor or some other type of medical provider? (This
question is followed by questions asking either the provider's
medical specialty or the type of nonphysician provider.) Is the
provider hospital based?
-
Is the provider
the person or place that family members would go to for new health
problems, preventive health care, and referrals to other health
professionals?
-
Does the
provider have office hours on nights and weekends? What are the
characteristics of the provider related to appointments and waiting
time? How difficult is it to contact a medical person at the
provider's office by telephone?
Does the provider generally
listen to family members and ask about prescription medications other
doctors may have given them? (This question is followed by a number
of other questions about quality-related characteristics of the provider,
including family members' confidence in and satisfaction with the
care received from the provider.)
Since these questions are
asked once for each usual source of health care provider, responses
represent the average experience of all family embers who use that
provider for their usual source of health care, as reported by the
survey respondent.
Barriers
to Health Care
The interviewer also gathers
information on barriers to health care for the family. The interviewer
asks if any family members have recently gone without needed health
care because the family needed money to buy food or clothing or to
pay for housing. In addition, the respondent is asked to rate his
or her satisfaction with the ability of family members to obtain
health care if needed. Questions are asked to directly assess whether
any family members experienced difficulty obtaining any type of health
care, experienced delays in obtaining care, or did not receive health
care they thought they needed because of:
-
Financial/insurance
problems, including "couldn't afford care," "insurance
company wouldn't approve, cover, or pay for care," "pre-existing
condition," "insurance required a referral, but couldn't
get one," and "doctor refused to accept family's insurance
plan."
-
Transportation
problems, including "medical care was too far away," "can't
drive or don't have car/no public transportation available," and
too expensive to get there."
-
Communication
problems, including "hearing impairment or loss" and "different
language."
-
Physical
problems, including "hard to get into building," "hard
to get around inside building," and "no appropriate
equipment in office."
-
Other problems,
including "couldn't get time off work," "didn't
know where to go to get care," "was refused services," "couldn't
get child care," "didn't have time or took too long," and
other reasons.
Data
Editing and Handling of Missing Data
Minimal data editing was done
on the variables in the access-to-care supplement. Editing consisted
of the construction of new variables from a series of data elements
and some logical editing that was carried out to ensure consistency
among the variables. "Other specify" text fields were reviewed
and either classified into existing categories or put into new categories
created to accommodate this information. issing
data is a relatively small problem for the access-to-care information.
Of the 22,149 individuals who had positive Round 2 person-level weights,
72 were excluded entirely from this report because they were either
dead or institutionalized at the time of the Round 2 interview, making
them ineligible for the access-to-care supplement questions. (The
weighted population estimate for these 72 omitted individuals is
861,629.) This leaves an unweighted population of 22,077 on which
the estimates in Table 1 are based. Of these,
98 were missing data on whether they had a usual source of care,
resulting in an unweighted population of 21,979 for the column "percent
of population with no usual source of health care." An additional
32 people had a usual source of health care but had missing data
on the type of place, resulting in an unweighted population of 21,947
for the last three columns of this table. The strategy of omitting
cases that are missing data is based on the assumption that the unknown
cases are distributed in the same way as the known cases. This strategy
for dealing with missing data is used throughout this report except
where otherwise noted. An additional 15 people for whom health status
was unknown are included in the total line of Table
1 but are not included in the breakdown by health status. Similarly,
48 people who were age 65 and over but not covered by Medicare are
included in the total line but not in the breakdown by insurance
status.
Figure 1 shows
the reasons why family members who changed their usual source of
care in the last 12 months did so. It includes those who lacked a
usual source of care at the time of the interview, but who had one
in the 12 months prior to the interview date. Only 37 families (0.4
percent of all responding families) were missing data on whether
there had been a change in usual source of health care, and an additional
4 families (0.04 percent) had experienced such a change but were
missing data on the reason for the change. They are omitted from
the figure.
Tables 2 and 3 are
based on the Table 1 population (n = 21,947)
but exclude 4,213 people who had no usual source of health care (the
17.6 percent shown in Table 1) and 104 people
whose usual source of health care was an emergency room (the 0.5
percent shown in Table 1). The unweighted population
for Tables 2 and 3 totals
17,630. In addition, Tables 2 and 3 are
affected by small amounts of item nonresponse, as follows:
-
Table
2: Provider has office hours at nights or on weekends (7.2
percent), usually have an appointment (0.3 percent), and difficulty
contacting by telephone (7.7 percent).
-
Table
3: Satisfaction with quality (1.1 percent), satisfaction
with professional staff (1.2 percent), provider generally listens
to them (2.1 percent), confident in provider's ability to help
(1.6 percent), and provider usually asks about prescription
medications (4.8 percent).
For Figure
2, the unweighted population is 15,509--the population for Tables
2 and 3 less 2,121 people whose usual
source of care was hospital based but not an emergency room. The
small number of cases (9) with office-based usual sources of health
care who could not be classified are omitted from Figure
2. Persons included in the "group or clinic" category
are those whose usual source of health care was office based with
no particular individual provider specified.
Table 4 is
a family-level analysis. Of the 9,084 families with positive weights,
1,089 reported any barriers to care. The distribution of reasons
for experiencing difficulty, delay, or not receiving needed health
care is based on 1,088 of these cases; the remaining case did not
specify a type of barrier and is omitted from this distribution.
The reasons for experiencing difficulty, delay, or not receiving
needed care shown in Table 4 are the main reasons
reported by respondents for their families. For families in which
one or more full-time students ages 17-23 were living away at school,
the students' experiences are characterized by those of their families
(i.e., the primary household respondent's response to the question
on barriers to care is assumed to represent the student's experience).
The family characteristics
shown in Table 4 are obtained in two ways.
For race/ethnicity of head of family and place of residence, the
characteristic of the reference person (the person in whose name
the family's home is owned or rented) is used to describe the family.
For 54 cases in which the reference person was missing such data,
available information from the next oldest individual in the family
is used. For perceived health status and health insurance status
of the family, all members who were eligible for data collection
are included in the description of the family. When an individual
was missing data on health status or health insurance, the family
is characterized based on data from the remaining individuals with
nonmissing values. This strategy is based on the assumption that
the health insurance and health status of family members missing
such data are distributed in the same way as for those family members
whose status is known. For the family-level estimates, 792 individuals
were missing health insurance data; 790 of these were not present
in Round 1 of MEPS, the round from which the health insurance information
in this report is derived. (See below.) Similarly, 1,580 people were
missing health status data; 790 of these were not present for the
Round 1 MEPS interview. Three families' health status could not be
determined, as data were missing for all family members. Health insurance
information was available from one or more family members for all
families in Round 2 of MEPS.
Population
Characteristics
All population characteristics
used in this report come from the MEPS HC Round 1 data collection
effort, the most recently available data as of the writing of this
report.
Age
The respondent was asked to
report the age of each family member as of the date of the Round
1 interview.
Race/Ethnicity
Classification by race and
ethnicity is based on information reported for each family member.
Respondents were asked if their race was best described as American
Indian, Alaska Native, Asian or Pacific Islander, black, white, or
other. They were also asked if their main national origin or ancestry
was Puerto Rican; Cuban; Mexican, Mexicano, Mexican American, or
Chicano; other Latin American; or other Spanish. All persons who
claimed main national origin or ancestry in one of these Hispanic
groups, regardless of racial background, are classified as Hispanic.
Since the Hispanic grouping can include black Hispanic, white Hispanic,
and other Hispanic, the race categories of black and white/other
do not include Hispanic persons.
Perceived Health Status
The respondent was asked to
rate the health of each person in the family at the time of the Round
1 interview according to the following categories: excellent, very
good, good, fair, and poor.
Health Insurance Status
The household respondent was
asked if, between January 1, 1996, and the time of the Round 1 interview,
anyone in the family was covered by any of the sources of public
and private health insurance coverage discussed in the following
paragraphs. For this report, Medicare and CHAMPUS/CHAMPVA coverage
represent coverage as of the date of the Round 1 interview. (CHAMPUS
and CHAMPVA are the Civilian Health and Medical Programs for the
Uniformed Services and Veterans' Affairs.) All other sources of insurance
represent coverage at any time during the Round 1 reference period.
Persons counted as uninsured were uninsured throughout the Round
1 reference period. For additional details on health insurance status
measures in MEPS, see Vistnes and Monheit (1997).
Public Coverage
For this report, individuals
are considered to have public coverage only if they met both of the
following criteria:
-
They were
not covered by private insurance.
-
They were
covered by one of the following public programs: Medicare, Medicaid,
or other public hospital/physician coverage.
Private Health
Insurance
Private health insurance is
defined for this report as insurance that provides coverage for hospital
and physician care. Insurance that provides coverage for a single
service only, such as dental or vision coverage, is not counted.
Coverage by CHAMPUS/CHAMPVA is included as private health insurance.
Uninsured
The uninsured are defined
as persons not covered by Medicare, CHAMPUS/CHAMPVA, Medicaid, other
public hospital/physician programs, or private hospital/physician
insurance throughout the entire Round 1 reference period. Individuals
covered only by noncomprehensive State-specific programs (e.g., Maryland
Kidney Disease Program, Colorado Child Health Plan) or private single-service
plans (e.g., coverage for dental or vision care only, coverage for
accidents or specific diseases) are not considered to be insured.
Place of Residence
Individuals are identified
as residing either inside or outside a metropolitan statistical area
(MSA) as designated by the U.S. Office of Management and Budget (OMB),
which applied 1990 standards using population counts from the 1990
U.S. Census. An MSA is a large population nucleus combined with adjacent
communities that have a high degree of economic and social integration
with the nucleus. Each MSA has one or more central counties containing
the area's main population concentration. In New England, metropolitan
areas consist of cities and towns rather than whole counties. Regions
of residence are in accordance with the U.S. Bureau of the Census
definition and are determined as of the date of the Round 1 interview.
Additional
Cautions
Very few respondents named
emergency rooms as usual sources of care for members of their families.
As a result, the relative standard errors for many of the estimates
in the "Emergency room" column in Table
1 are quite high. Standard errors that are greater than or equal
to 30 percent of he estimate are indicated with an asterisk. Exact
relative standard errors can be calculated by dividing the appropriate
standard error, shown in Tables A-F, by the
estimate. Caution should be used in interpreting estimates in the "Emergency
room" column. They are presented for the benefit of those interested
in the use of emergency rooms as a usual source of health care, but
are best combined with the "Hospital outpatient department or
clinic" column.
As of the writing of this
report, population characteristics for MEPS are available only from
the first round of data collection. In contrast, the access-to-care
supplement was administered in Round 2. Population characteristics
may have changed between Rounds 1 and 2 for members of the MEPS panel,
so caution should be used in interpreting these data. This concern
is particularly applicable to health insurance status.
Sample
Design and Accuracy of Estimates
The sample selected for the
1996 MEPS, a subsample of the 1995 NHIS, was designed to produce
national estimates that are representative of the civilian noninstitutionalized
population of the United States. Round 1 data were obtained for approximately
9,400 households in MEPS, resulting in a survey response rate of
78 percent. This figure reflects participation in both NHIS and MEPS.
For Round 2, the response rate was 95 percent, resulting in a response
rate of 74 percent overall from the NHIS interview through Round
2 of MEPS.
The person-level estimates
presented in this report were derived from a nationally representative
sample of the civilian noninstitutionalized population defined as
of the first half of 1996. The estimates should be interpreted as
attributes of the target population defined as of the first half
of 1996. While the survey interviews that obtained data on access
to care were conducted in the second half of 1996, the questions
on access were not explicitly constrained by that time period.
The statistics presented in
this report are affected by both sampling error and sources of nonsampling
error, which include nonresponse bias, respondent reporting errors,
and interviewer effects. For a detailed description of the MEPS survey
design, the adopted sample design, and methods used to minimize sources
of nonsampling error, see J. Cohen (1997), S. Cohen (1997), and Cohen,
Monheit, Beauregard, et al. (1996). The MEPS person-level estimation
weights include nonresponse adjustments and poststratification adjustments
to population estimates derived from the March 1996 Current Population
Survey (CPS) based on cross-classifications by region, age, race/ethnicity,
and sex.
Tests of statistical significance
were used to determine whether the differences between populations
exist at specified levels of confidence or whether they occurred
by chance. Differences were tested using Z-scores having asymptotic
normal properties at the 0.05 level of significance. Unless otherwise
noted, only statistically significant differences between estimates
are discussed in the text. Rounding
Estimates presented in
the tables were rounded to the nearest 0.1 percent. Standard
errors were rounded to the nearest 0.01. Some of the estimates
for population totals of subgroups presented in the tables will
not add exactly to the overall estimated population total as
a consequence of rounding.
^top
^top
Standard Error Tables
Table A. Standard
errors for percent distribution of families with members
who changed
their
usual source of care in the past 12 months by reason for
change, United States, 1996
Corresponds to Figure 1
| Reason |
Standard
error |
| Insurance-related
reasons |
1.68
|
| Dissatisfied
with quality of care |
1.48
|
| Too
far away, moved to new area, or previous provider
not available |
1.68
|
| Other
reasons |
1.34
|
Note: Restricted
to civilian noninstitutionalized population.
Source: Center
for Financing, Access, and Cost Trends, Agency for Health
Care Policy and Research: Medical Expenditure Panel Survey
Household Component, 1996 (Round 2).
^top
Table
B. Standard errors for percent distribution of persons by
type of office-based usual source of care, United States,
1996
Corresponds to Figure
2
| Type
of provider |
Standard
error |
| Family
practitioner/general practitioner |
0.97
|
| Internist/pediatrician |
0.70
|
| Other
medical specialist |
0.27
|
| Nonphysician
provider |
0.08
|
| Group
or clinic (no provider type identified) |
1.11
|
Note: Restricted
to civilian noninstitutionalized population.
Source: Center
for Financing, Access, and Cost Trends, Agency for Health
Care Policy and Research: Medical Expenditure Panel Survey
Household Component, 1996 (Round 2).
^top
Table C. Standard
errors for percent distribution of population by usual source
of health care and selected population characteristics,
United States, 1996
Corresponds to Table
1
| Population
characteristics |
No
usual source of health care |
Usual
source of health care is: |
| Office-baseda |
Hospital
outpatient department or clinicb |
Emergency
room |
| Totalc |
0.43
|
0.60
|
0.46
|
0.07
|
| Age
in years |
| Under
6 |
0.64
|
1.14
|
0.96
|
0.25
|
| 6-17 |
0.67
|
0.91
|
0.68
|
0.11
|
| 18-24 |
1.27
|
1.39
|
0.71
|
0.34
|
| 25-54 |
0.59
|
0.70
|
0.49
|
0.08
|
| 55-64 |
0.86
|
1.38
|
1.15
|
0.22
|
| 65
and over |
0.71
|
1.11
|
0.90
|
0.15
|
| Race/ethnicity |
| Hispanic |
1.21
|
1.30
|
0.88
|
0.16
|
| Black |
0.95
|
1.34
|
1.11
|
0.41
|
| White
and other |
0.45
|
0.65
|
0.51
|
0.06
|
| Sex |
| Male |
0.54
|
0.71
|
0.48
|
0.08
|
| Female |
0.45
|
0.61
|
0.50
|
0.09
|
| Perceived
health status |
| Excellent |
0.65
|
0.87
|
0.58
|
0.09
|
| Very
good |
0.59
|
0.76
|
0.59
|
0.10
|
| Good |
0.74
|
0.95
|
0.64
|
0.18
|
| Fair |
1.01
|
1.33
|
0.97
|
0.25
|
| Poor |
1.22
|
1.86
|
1.46
|
0.53
|
| Health
insurance statusd |
| Under
age 65: |
| Any
private |
0.48
|
0.65
|
0.52
|
0.05
|
| Public
only |
0.98
|
1.61
|
1.23
|
0.38
|
| Uninsured |
1.10
|
1.23
|
0.75
|
0.27
|
| Age
65 and over: |
| Medicare
only |
1.47
|
2.01
|
1.58
|
0.32
|
| Medicare
and private |
0.81
|
1.27
|
1.06
|
0.17
|
| Medicare
and other public |
1.77
|
2.94
|
2.17
|
0.51
|
| Metropolitan
statistical area (MSA) |
| MSA |
0.50
|
0.68
|
0.49
|
0.08
|
| Non-MSA |
0.89
|
1.29
|
1.13
|
0.17
|
- aIncludes
all types of physicians and nonphysician providers seen
in an office setting as well as office-based group practices
or clinics.
- bIncludes
outpatient departments and clinics owned and operated by
hospitals.
- cIncludes
individuals with unknown health status and those few individuals
age 65 and over who do not have Medicare coverage. Excludes
a small number of persons who were eligible for data collection
in the first half of 1996 but died or were institutionalized
in the second half of the year. See Technical Appendix for
details.
- dThis
refers to health insurance status during the first half
of 1996. Uninsured refers to persons uninsured during the
entire period. Public and private insurance categories refer
to individuals with public or private insurance at any time
during the period; individuals with both public and private
insurance are considered privately insured. CHAMPUS and
CHAMPVA (Armed-Forces-related coverage) are considered private
health insurance in this report.
Note: Restricted
to civilian noninstitutionalized population.
Source: Center
for Financing, Access, and Cost Trends, Agency for Health
Care Policy and Research: Medical Expenditure Panel Survey
Household Component, 1996 (Rounds 1 and 2).
^top
Table
D. Standard errors for percent of population by selected
characteristics of usual source of health care, United States,
1996
Corresponds to Table
2
| Characteristics
of usual source of care |
Standard
error for percent |
| Has
office hours at night or on weekends |
0.91
|
| Usually
have an appointment |
0.73
|
| Somewhat
difficult or very difficult to contact by telephone |
068
|
Note: Excludes
individuals whose usual source of care is an emergency room.
Restricted to civilian noninstitutionalized population.
Source: Center
for Financing, Access, and Cost Trends, Agency for Health
Care Policy and Research: Medical Expenditure Panel Survey
Household Component, 1996 (Round 2).
^top
Table
E. Standard errors for percent of population by satisfaction
with usual source of health care and continuity of care,
United States, 1996
Corresponds to Table
3
| Satisfaction
or continuity of care |
Standard
error for percent |
| Somewhat
satisfied or very satisfied with overall quality of
care |
0.20
|
| Somewhat
satisfied or very satisfied with professional staff |
0.26
|
| Provider
generally listens to them and gives them needed health
information |
0.25
|
| Confident
in provider's ability to help with a medical problem |
0.25
|
| Provider
usually asks about prescription medications and treatments
from other doctors |
0.67
|
Note: Excludes
individuals whose usual source of care is an emergency room.
Restricted to civilian noninstitutionalized population.
Source: Center
for Financing, Access, and Cost Trends, Agency for Health
Care Policy and Research: Medical Expenditure Panel Survey
Household Component, 1996 (Round 2).
^top
Table
F. Standard errors for percent of families with members
experiencing difficulty or delay or not receiving needed
health care by main problem in receiving care and family
characteristics, United States, 1996
Corresponds to Table
4
| Family
characteristics |
Any
problem |
Main
problem |
| Inability
to afford care |
Insurance-related
reasonsa |
Other
problemsb |
| Total |
0.40
|
1.84
|
1.33
|
1.31
|
| Race/ethnicity
of head of family |
| Hispanic |
1.26
|
3.96
|
3.00
|
2.87
|
| Black |
0.92
|
5.29
|
2.84
|
4.33
|
| White
and other |
0.45
|
2.06
|
1.57
|
1.52
|
| Perceived
health statusc |
| Any
family member in fair or poor health |
1.00
|
2.84
|
1.96
|
2.19
|
| All
family members in excellent,very good,or good health |
0.40
|
2.14
|
1.63
|
1.61
|
| Health
insurance status of familyd |
| All
members private insurance |
0.35
|
2.38
|
2.20
|
2.31
|
| All
members public insurance |
1.20
|
5.85
|
5.11
|
4.56
|
| All
members uninsured |
1.67
|
2.30
|
1.49
|
1.69
|
| Some
private, some uninsured |
1.75
|
4.39
|
3.17
|
2.64
|
| Some
public, some uninsured |
2.18
|
4.35
|
1.47
|
4.18
|
| Some
private, some public |
1.83
|
--
|
--
|
--
|
| Some
private, some public,some uninsured |
4.87
|
--
|
--
|
--
|
| Metropolitan
statistical area (MSA) |
| MSA |
0.44
|
2.11
|
1.55
|
1.44
|
| Non-MSA |
0.84
|
3.56
|
2.62
|
3.07
|
- aIncludes
insurance company wouldn't approve, cover, or pay for care;
pre-existing condition; insurance required a referral but
couldn't get one; doctor refused to accept family's insurance
plan.
- bIncludes
transportation problems (medical care was too far away,
can't drive or don't have car/no public transportation available,
too expensive to get there); physical problems (hard to
get into building, hard to get around inside building, no
appropriate equipment in office); communication problems
(hearing impairment or loss, different language); and other
problems (couldn't get time off work, didn't know where
to go to get care, was refused services, couldn't get child
care, didn't have time or took too long).
- cA
small number of families with missing health status for
all family members are excluded from this breakdown but
included in the total line of the table. See Technical Appendix
for details.
- dRefers
to health insurance status during the first half of 1996.
Uninsured refers to persons uninsured during the entire
period. The public and private insurance categories refer
to individuals with public or private insurance at any time
during the period; individuals with both publicand private
insurance are considered privately insured. CHAMPUS and
CHAMPVA (Armed-Forces-related coverage) are considered private
health insurance in this report.
- Sample sizes are
too small to support reliable estimation.
Note: Restricted
to civilian noninstitutionalized population.
Source: Center
for Financing, Access, and Cost Trends, Agency for Health
Care Policy and Research: Medical Expenditure Panel Survey
Household Component, 1996 (Rounds 1 and 2).
^top
Suggested Citation:
Weinick,
R. M., Zuvekas, S. H., and Drilea, S. Research
Findings #3: Access to Health Care - Sources
and Barriers,
1996. February 2006. Agency for Healthcare Research and
Quality, Rockville, MD.
http://www.meps.ahrq.gov
/data_files/rf3.shtml
|
|
