
|
|
|
Font Size:
|
||||
|
|
|
|
||||
STATISTICAL BRIEF #15:
Employer-Sponsored Health Insurance for Small Employers in the Private Sector, by Industry Classification: 2000
Briefly Stated
- In 2000, 67.8 percent of employees of small private sector employers worked where health insurance was offered.
- In 2000, 62.1 percent of employees who worked at small employers which offered health insurance enrolled. There was substantial variation in the enrollment rates by industry classification.
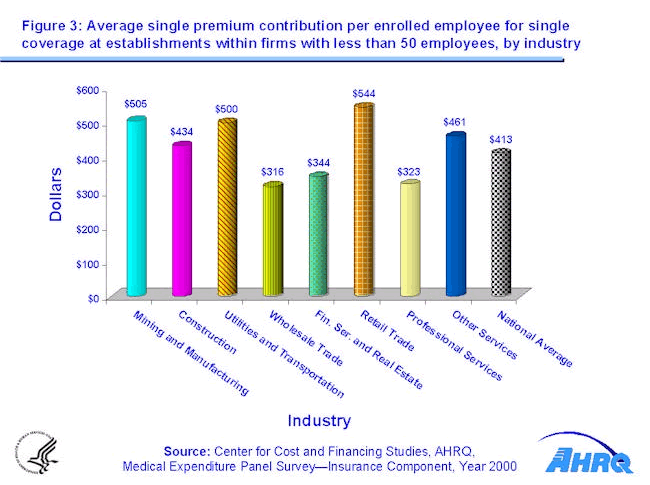
- The average premium contribution per enrolled employee for single coverage across small private sector employers was $413.
- The average premium contribution per enrolled employee for family coverage across small private sector employers was $1,894.
Introduction
Employer-sponsored health insurance for current workers is one of the primary sources of health insurance coverage in the United States. According to data from the 2000 Medical Expenditure Panel Survey Insurance Component (MEPS-IC), approximately 100 million of the 112 million employees from the private sector worked in firms where the employer offered health insurance. Of those who worked where health insurance was offered, approximately 64 million were enrolled. (Data not shown in tables.)
Although a large percentage of private sector employees worked where health insurance was offered in 2000, small private sector employers (firms with less than 50 employees) are much less likely to offer health insurance than other firms or governments. Among these small employers, the offer rates vary considerably by industry. Furthermore, the employee costs for employer-sponsored health insurance also vary significantly by industry among the small private sector employers.
Findings
Among the 32.3 million employees who worked for small private sector employers in 2000, 67.8 percent (Figure 1) worked where the employer offered health insurance. This rate varied considerably by industry classification. The percent of employees who worked for small employers who offered health insurance was 86.3 percent for the combined Mining and Manufacturing sectors and 81.0 percent for the Wholesale Trade industry. Both these rates were significantly higher than the national average. Alternatively, the rate for the Other Services industry was significantly lower than the national average, with only 54.3 percent of employees in these small firms working where health insurance was offered.
Among employees of small employers who worked where health insurance was offered, 62.1 percent (Figure 2) enrolled. The enrollment rates ranged from 43.8 percent for employees in the Other Services industry, which was significantly lower than the national average, to 72.6 percent for the Mining and Manufacturing industry, 74.4 percent for the Financial Services and Real Estate industries, and 74.5 percent for the Wholesale Trade sector, all significantly higher than the national average.
Average employee contributions towards premiums for small private sector employers in 2000 were $413 (Figure 3) for single coverage and $1,894 (Figure 4) for a family of four. Furthermore, there was significant variation in the average employee premium contributions by industry classification. Employees working in the Wholesale Trade sector required the lowest single coverage and the lowest family premium contribution, $316 (Figure 3) and $1,580 (Figure 4). Average premium contributions for employees in Retail Trade were among the highest, at $544 for single coverage (Figure 3) and $2,193 for family coverage (Figure 4), both amounts higher than the national average. Employees in the Professional Services industry had an average premium contribution for single coverage of $323, which was significantly lower than the national average (Figure 3), but required an average premium contribution of $2,245 for family coverage (Figure 4) which was significantly higher than the national average. Employees in the Financial Services and Real Estate industries had an average premium contribution for single coverage of $344 which was significantly lower than average (Figure 3), but the family of four average premium contribution for this sector was not significantly different than the national average.
Definitions
In this statistical brief, an employer is defined as a private sector firm. A firm is defined as a business entity which controls one or more business establishments or locations. Consequently, an employer, can have multiple work locations. Only small employers with less than 50 employees across all their locations were included in this analysis.
The classification by industry is based upon the North American Industrial Classification System.
Only those estimates which had a statistically significant difference from the National average at the 5% significance level were noted in the text.
About the MEPS-IC
The MEPS-IC is a survey of business establishments and governments which collects information on employer sponsored health insurance, such as, whether insurance is offered, enrollments, types of plans and premiums. The survey is conducted annually by the United States Bureau of the Census under the sponsorship of the Agency for Healthcare Research and Quality (AHRQ). The yearly response rate has averaged 78% for in-scope sample units. Approximately 4% of the original sample has been out-of-scope in a typical year. A total sample of 42,000 establishments was selected for the 2000 survey, prior to accounting for losses due non-response and out-of-scope cases. For more information on this survey see Methodology Reports 6, 8, and 10 and the MEPS-IC Technical Appendix, available on the MEPS Web site (http://www.meps.ahrq.gov).
 |
||||||||||||||||||||||||||||||||||||||||
|
||||||||||||||||||||||||||||||||||||||||
|
|
||||||||||||||||||||||||||||||||||||||||
 |
||||||||||||||||||||||||||||||||||||||||
|
||||||||||||||||||||||||||||||||||||||||
|
|
||||||||||||||||||||||||||||||||||||||||
 |
||||||||||||||||||||||||||||||||||||||||
|
||||||||||||||||||||||||||||||||||||||||
|
|
||||||||||||||||||||||||||||||||||||||||
 |
||||||||||||||||||||||||||||||||||||||||
|
||||||||||||||||||||||||||||||||||||||||
|
|
||||||||||||||||||||||||||||||||||||||||