
|
|
|
Font Size:
|
||||
|
|
|
|
||||
STATISTICAL BRIEF #289:
Back Problems: Use and Expenditures for the U.S. Adult Population, 2007
Highlights
- In 2007, approximately 27 million adults, or 11.9 percent of adults age 18 and older, reported having back problems.
- Approximately 19 million adults reported receiving treatment for the back problems in 2007.
- Medical spending to treat back problems totaled $30.3 billion in 2007.
- A total of $4.5 billion was spent on prescription medications to treat back problems in adults.
- Annual mean expenditures for back problems among those with an expense related to back problems totaled $1,589 per adult in 2007.
Introduction
Back pain (also known as "dorsalgia") is pain felt in the back that usually originates from the muscles, nerves, bones, joints, or other structures in the spine. Back problems may include spondylosis, intervertebral disc disorders, and other back troubles.
This Statistical Brief presents estimates on the use of and expenditures for ambulatory care and prescribed medications to treat back problems among adults age 18 and older in the U.S. civilian noninstitutionalized population. The estimates are based on the Household Component of the Medical Expenditure Panel Survey (MEPS-HC). Average annual estimates are shown by type of service and source of payment. All differences between estimates noted in the text are statistically significant at the 0.05 level or better.
Findings
Number of reported cases and treatment for back problems, by sex
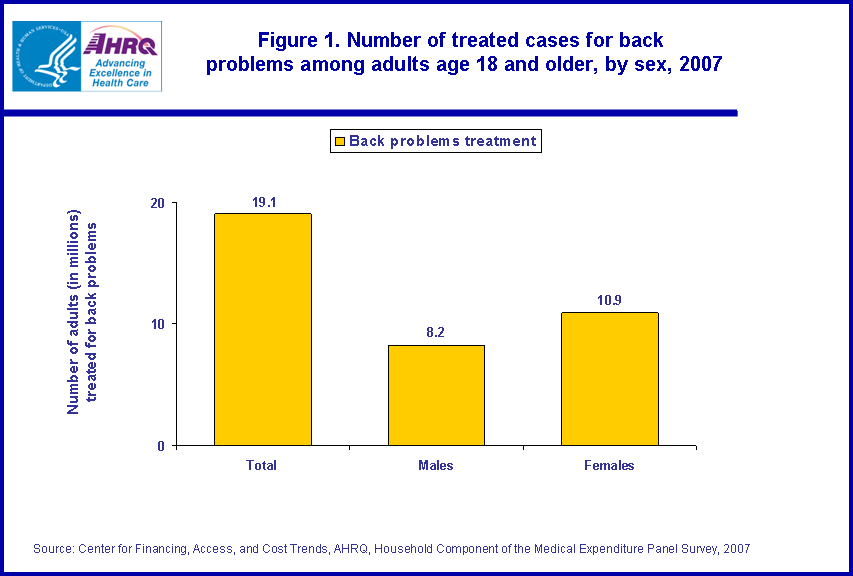
In 2007, 27 million U.S. adults age 18 and older reported having back problems. Over 19.1 million people reported receiving treatment for back problems (figure 1). More females (10.9 million) reported receiving treatment for back problems than males (8.2 million).
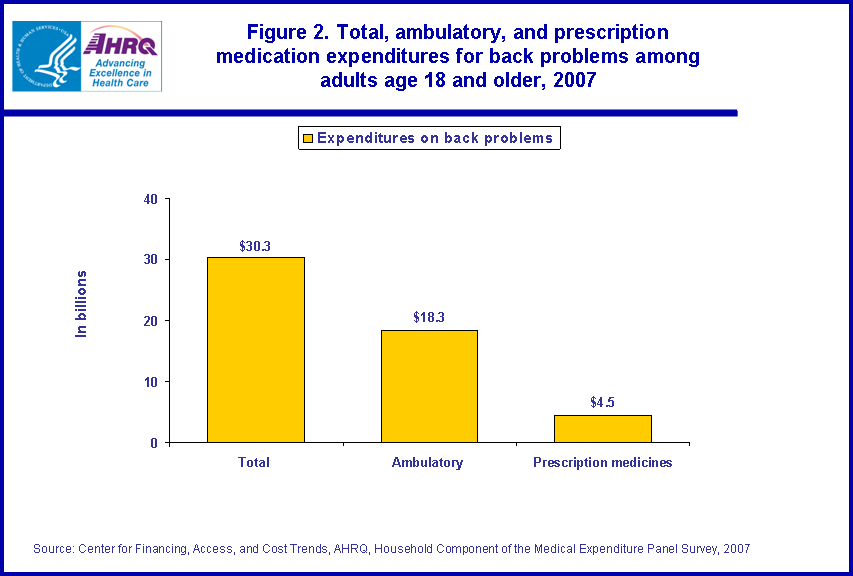
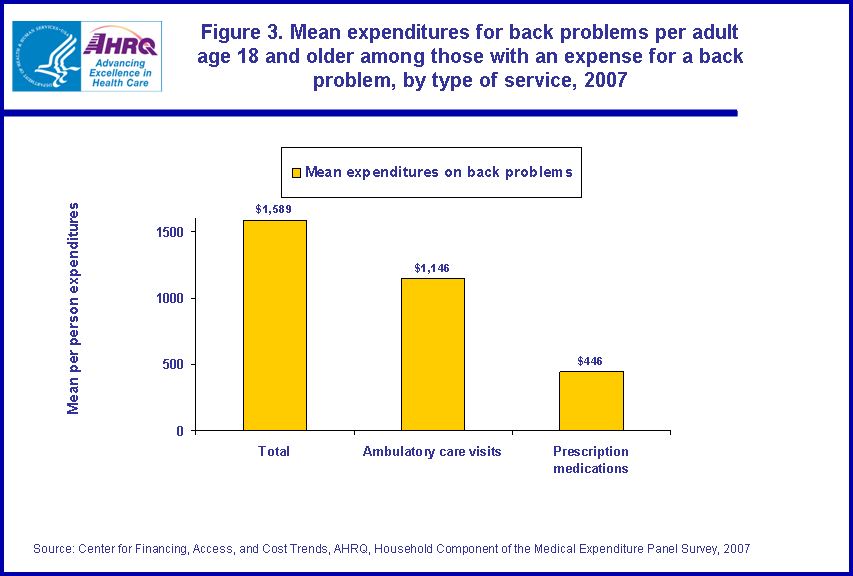
Expenditures for the treatment of back problems accounted for about 3 percent of total expenditures associated with the treatment of all conditions among adults age 18 and older (figure not shown). A total of $30.3 billion was spent on treatment for back problems (figure 2). More than half of expenditures for back problems were spent on ambulatory visits ($18.3 billion) and $4.5 billion was spent on prescription medications. Among persons with any expense for a back problem, the mean expenditure per person for the treatment of back problems was $1,589 in 2007. The mean expense per adult for an ambulatory visit was $1,146 and $446 for prescription medications (figure 3).
Distribution of average annual health care expenditures for back problems, by source of payment and type of service
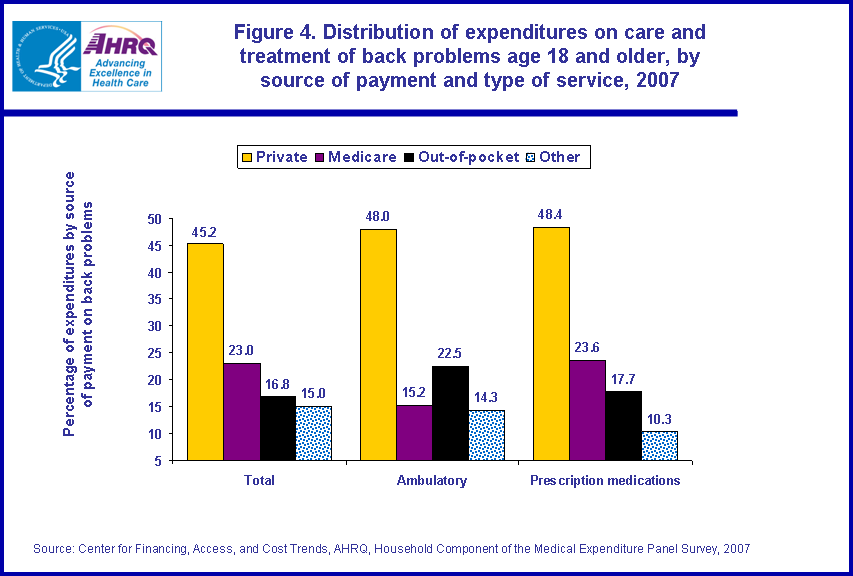
More than forty percent (45.2 percent) of the total expenditures for the treatment of back problems in 2007 was paid by private insurance, with Medicare paying 23.0 percent and out-of-pocket payments accounting for 16.8 percent (figure 4). Private insurance paid for 48.0 percent of ambulatory visit expenditures while 22.5 percent of the expenditures were paid out-of-pocket for ambulatory visits. For prescription medications, almost half (48.4 percent) of prescribed medicine expense was paid by private insurance followed by Medicare paying almost one-fourth of the expenditures (23.6 percent).
Data Source
The estimates shown in this Statistical Brief are based on data files from the MEPS HC-113: 2007 Full Year Consolidated Data File; HC-112: 2007 Medical Conditions; HC-110G: 2007 Office-Based Medical Provider Visits; HC-110F: 2007 Outpatient Department Visits; HC-110D: 2007 Hospital Inpatient Stays; HC-110H: 2007 Home Health Visits; HC-110E: 2007 Emergency Room Visits; and HC-110A: 2007 Prescribed Medicines.
Definitions
Back problems
This Brief provides estimates for adults, age 18 and older, with back problems reported as a condition bothering the person, as well as back problems reported in connection with reported health care utilization. The conditions reported by respondents were recorded by interviewers as verbatim text, which was then coded by professional coders to fully specified ICD-9-CM codes. Conditions with Clinical Classification Software (CCS) code of 205 were classified as back problems.
Expenditures
Expenditures in MEPS are defined as payments from all sources for hospital inpatient care, ambulatory care provided in offices and hospital outpatient departments, care provided in emergency departments, and purchase of prescribed medications. Sources include direct payments from individuals, private insurance, Medicare, Medicaid, Workers' Compensation, and miscellaneous other sources. These expenditures do not include 'over-the-counter' medications used for treatment of any conditions.
Sources of payment
- Private insurance: This category includes payments made by insurance plans covering hospital and other medical care (excluding payments from Medicare, Medicaid, and other public sources), Medigap plans, and TRICARE (Armed Forces-related coverage). Payments from plans that provide coverage for a single service only, such as dental or vision coverage are not included.
- Medicaid/CHIP: This category includes payments made by the Medicaid and CHIP programs which are means-tested government programs financed jointly by Federal and state funds that provide health care to those who are eligible. Medicaid is designed to provide health coverage to families and individuals who are unable to afford necessary medical care while CHIP provides coverage to additional low income children not eligible for Medicaid. Eligibility criteria for both programs vary significantly by state.
- Out of pocket: This category includes expenses paid by the user or other family member.
- Other sources: This category includes payments from Medicare, other miscellaneous Federal sources (Indian Health Service, military treatment facilities, and other care provided by the Federal government); various state and local sources (community and neighborhood clinics, state and local health departments, and state programs other than Medicaid/CHIP); various unclassified sources (e.g., automobile, homeowner's, or other liability insurance, and other miscellaneous or unknown sources); Medicaid/CHIP payments reported for persons who were not reported as enrolled in the Medicaid or CHIP programs at any time during the year; and private insurance payments reported for persons without any reported private health insurance coverage during the year.
About MEPS-HC
MEPS-HC is a nationally representative longitudinal survey that collects detailed information on health care utilization and expenditures, health insurance, and health status, as well as a wide variety of social, demographic, and economic characteristics for the U.S. civilian noninstitutionalized population. It is cosponsored by the Agency for Healthcare Research and Quality and the National Center for Health Statistics.
For more information about MEPS, call the MEPS information coordinator at AHRQ (301) 427-1656 or visit the MEPS Web site at http://www.meps.ahrq.gov/.
References
For a detailed description of the MEPS-HC survey design, sample design, and methods used to minimize sources of nonsampling errors, see the following publications:
Cohen, J. Design and Methods of the Medical Expenditure Panel Survey Household Component. MEPS Methodology Report No. 1. AHCPR Pub. No. 97-0026. Rockville, MD. Agency for Health Care Policy and Research, 1997. http://www.meps.ahrq.gov/mepsweb/data_files/publications/mr1/mr1.shtml
Cohen, S. Sample Design of the 1996 Medical Expenditure Panel Survey Household Component. MEPS Methodology Report No. 2. AHCPR Pub. No. 97-0027. Rockville, MD. Agency for Health Care Policy and Research, 1997. http://www.meps.ahrq.gov/mepsweb/data_files/publications/mr2/mr2.shtml
Cohen, S. Design Strategies and Innovations in the Medical Expenditure Panel Survey. Medical Care, July 2003: 41(7) Supplement: III-5-III-12.
Ezzati-Rice, T.M., Rohde, F., Greenblatt, J. Sample Design of the Medical Expenditure Panel Survey Household Component, 1998-2007. Methodology Report No. 22. March 2008. Agency for Healthcare Research and Quality, Rockville, MD. http://www.meps.ahrq.gov/mepsweb/data_files/publications/mr22/mr22.shtml
For more information about back problems, see the following publications:
Back Problems and Injuries - Check Your Symptoms: http://www.webmd.com/back-pain/tc/back-problems-and-injuries-check-your-symptoms
Suggested Citation
Soni, A. Back Problems: Use and Expenditures for the U.S. Adult Population, 2007. Statistical Brief #289. July 2010. Agency for Healthcare Research and Quality, Rockville, MD. http://www.meps.ahrq.gov/mepsweb/data_files/publications/st289/stat289.shtml
AHRQ welcomes questions and comments from readers of this publication who are interested in obtaining more information about access, cost, use, financing, and quality of health care in the United States. We also invite you to tell us how you are using this Statistical Brief and other MEPS data and tools and to share suggestions on how MEPS products might be enhanced to further meet your needs. Please e-mail us at mepspd@ahrq.gov or send a letter to the address below:
Steven B. Cohen, PhD, Director
Center for Financing, Access, and Cost Trends
Agency for Healthcare Research and Quality
540 Gaither Road
Rockville, MD 20850
 |
||||||||||||||||||||||||||||
|
||||||||||||||||||||||||||||
|
|
||||||||||||||||||||||||||||
 |
||||||||||||||||||||||||||||
|
||||||||||||||||||||||||||||
|
|
||||||||||||||||||||||||||||
 |
||||||||||||||||||||||||||||
|
||||||||||||||||||||||||||||
|
|
||||||||||||||||||||||||||||
 |
||||||||||||||||||||||||||||
|
||||||||||||||||||||||||||||
|
|
||||||||||||||||||||||||||||