
|
|
|
Font Size:
|
||||
|
|
|
|
||||
STATISTICAL BRIEF #306:
Average Annual Health Care Use and Expenditures for Kidney Disease among Adults 18 and Older, U.S. Civilian Noninstitutionalized Population, 2003-2007
Highlights
- On average in 2003-2007, 3.7 million adults annually reported getting treatment for kidney disease.
- Medical spending to treat kidney disease totaled on average $25.3 billion per year for 2003-2007 (in 2007 dollars).
- Average annual expenditures for kidney disease among those with an expense related to kidney disease averaged $6,823 per adult for 2003-2007.
- More than half of the expenditures for kidney disease were on the treatment and care performed during ambulatory care visits.
- During 2003-2007, 40 percent of the total expenditures to treat kidney disease were paid by Medicare.
Introduction
Kidney disease includes decreased kidney function and/or abnormalities in kidneys indicated by blood or urine laboratory tests. This damage can cause waste to build up in the body and leads to other health problems, including heart disease, anemia, and bone disease. Kidney disease can lead to kidney failure and even death if it is not treated properly.This Statistical Brief presents estimates based on the Household Component of the Medical Expenditure Panel Survey (MEPS-HC) on the use of and expenditures for ambulatory and hospital care, and prescribed medications to treat kidney disease among the U.S. civilian noninstitutionalized population. Average annual estimates (in 2007 dollars) for the period 2003-2007 are shown by type of service and source of payment. Data for five years were combined to improve the precision of the estimates, and expenditure data for all years except 2007 was adjusted to 2007 dollars using the Personal Health Care Expenditure (PHCE) Price Index. All differences between estimates noted in the text are statistically significant at the 0.05 level or better.
Findings
Number of treated cases and treatment for kidney disease, by raceIn 2003-2007, an average of 3.7 million U.S. adults ages 18 and older or 1.7 percent of the population reported receiving treatment for kidney disease (figure 1). Among those who reported receiving treatment for kidney disease, the number of white non-Hispanic adults was higher than those who were black, non-Hispanic or Hispanic (2.7 million versus 0.5 million and 0.4 million).
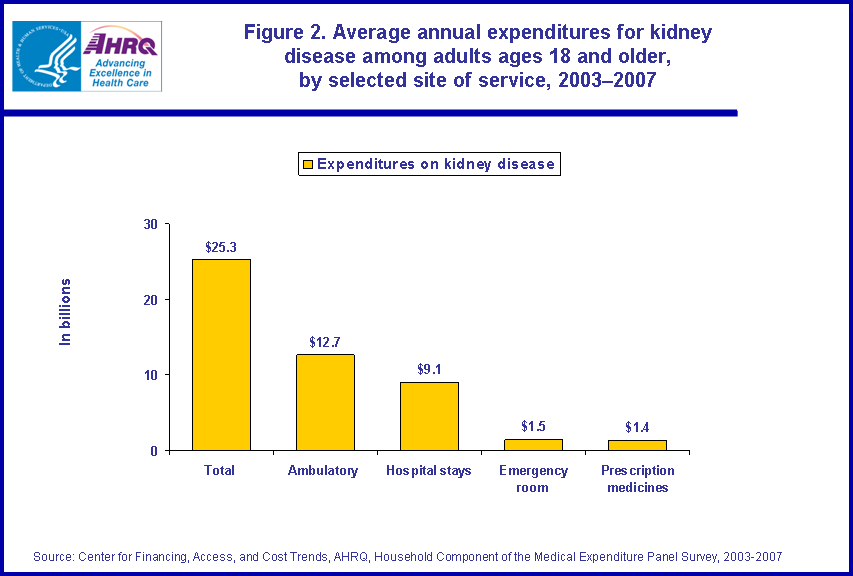
An annual average total of $25.3 billion was spent on treatment for kidney disease from 2003-2007 (figure 2). Almost half of the expenditures for kidney disease were spent on ambulatory visits ($12.7 billion). Similar amounts were spent on prescription medicines and emergency room visits related to kidney disease ($1.4 billion and $1.5 billion, respectively). Hospital stays expenditures for the treatment of kidney disease amounted to $9.1 billion.
Among persons with any expense for kidney disease, the average annual expenditure for the treatment of kidney disease was $6,823 in 2003-2007. The mean expense per adult for ambulatory visits was $4,581, $643 for prescription medications, and $1,607 for emergency room visits. The average per person amount spent on hospital stays was $16,315 (figure 3). Persons with expenses for treatment of kidney disease made an average of 15.7 ambulatory visits related to the treatment of the disease (figure not shown).
Annual average mean health care expenditures for kidney disease, by insurance coverage and age
During 2003-2007, those ages 18-64 who were covered by public only insurance had expenditures which were over three times more than those who were uninsured ($9,351 versus $3,037 per person with kidney disease) (figure 4). For those age 65 and older, the highest expenses were for those who were covered by Medicare and some other public insurance at $12,555 per person. This was higher than average annual expenditures for those who were covered by Medicare only or Medicare plus private insurance ($6,713 and $7,530 per person).
Distribution of average annual health care expenditures for kidney disease, by age, source of payment, and type of service
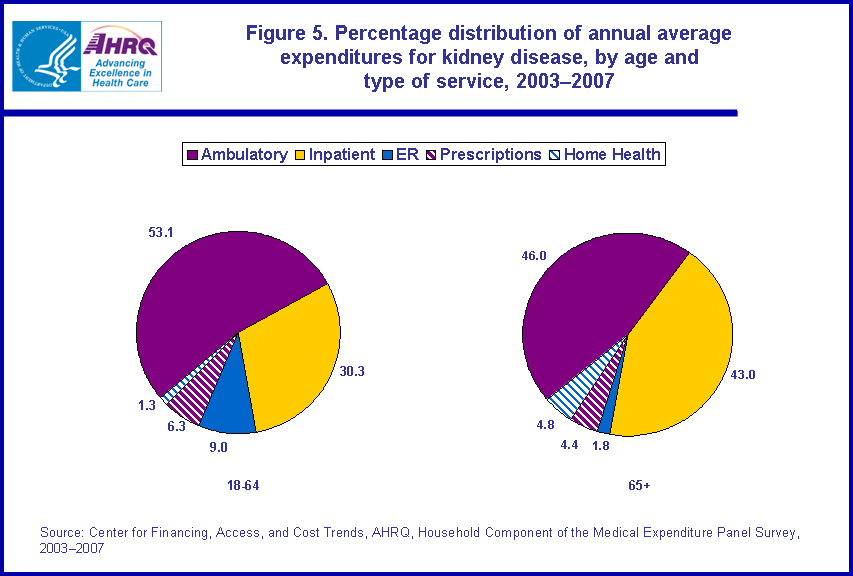
During 2003-2007, for those ages 18-64, more than half of the total kidney disease expenditures were from ambulatory visits (53.1 percent) compared with about one third (30.3 percent) from inpatient visits (figure 5). Among those age 65 and older seeking care for kidney disease, ambulatory visits accounted for 46.0 percent of the total kidney disease expenditures, and hospital stays 43.0 percent.
Almost half (48.6 percent) of the total expenditures for the treatment of kidney disease were paid by private insurance, compared to about one fifth (20.8 percent) paid by Medicare for those ages 18-64 (figure 6). For those who were age 65 and older, Medicare paid for about two thirds (66.0 percent) of total expenditures related to the treatment of this disease as compared with less than one fifth (17.5 percent) of the expenditures paid by private insurance.
Data Source
The estimates shown in this Statistical Brief are based on data from the MEPS 2003-2007 Full Year Consolidated Files (HC-079, HC-089, HC-097, HC-105 and HC-113), Medical Conditions Files (HC-078, HC-087, HC-096, HC-104, and HC-112), Office-Based Medical Provider Visit Files (HC-077G, HC-085G, HC-094G, HC-102G, and HC-110G), Outpatient Visits Files (HC-077F, HC-085F, HC-094F, HC-102F, and HC-110F), Emergency Room Visit Files (HC-077E, HC-085E, HC-094E, HC-102E and HC-110E), Hospital Inpatient Stays Files (HC-077D, HC-085D, HC-94D, HC-102D and HC-110D), Home Health Files (HC-077H, HC-085H, HC-094H, HC-102H, and HC-110H), and Prescribed Medicine Files (HC-077A, HC-085A, HC-094A, HC-102A, and HC-110A).Definitions
Kidney diseaseThis Brief analyzes individuals with kidney disease reported as a condition bothering the person and reported in connection with reported health care utilization (e.g., a person who reported purchasing a drug was asked what condition the drug was intended to treat) or reported disability days. The conditions reported by respondents were recorded by interviewer as verbatim text, which was then coded by professional coders to fully specified ICD-9-CM codes. Conditions with CCS codes of 156-158 and 160-161 were classified as kidney disease. For additional information on crosswalk between ICD-9 codes and CCS codes, please visit: http://www.hcup-us.ahrq.gov/toolssoftware/ccs/ccs.jsp.
Expenditures
Expenditures in MEPS are defined as payments from all sources for hospital inpatient care, ambulatory care provided in offices and hospital outpatient departments, care provided in emergency departments, paid care provided in the patient's home (home health), and the purchase of prescribed medications. Sources include direct payments from individuals, private insurance, Medicare, Medicaid, Workers' Compensation, and miscellaneous other sources. Expenditure data for 2003-2006 were adjusted to 2007 dollars using the Personal Health Care Price Index (PHCE) and all estimates in this Brief are reported in 2007 dollars. Please go to http://www.cms.gov/NationalHealthExpendData/downloads/dsm-08.pdf for more information on PHCE.
These expenditures do not include any "over-the-counter" medications.
Sources of payment
- Private insurance: This category includes payments made by insurance plans covering hospital and other medical care (excluding payments from Medicare, Medicaid, and other public sources), Medigap plans, and TRICARE (Armed Forces-related coverage).
- Medicare: Medicare is a federally financed health insurance plan for the elderly, persons receiving Social Security disability payments, and persons with end-stage renal disease. Medicare Part A, which provides hospital insurance, is automatically given to those who are eligible for Social Security. Medicare Part B provides supplementary medical insurance that pays for medical expenses and can be purchased for a monthly premium. Medicare Part D, which started in 2006, covers prescription drug expenses.
- Medicaid/CHIP: This category includes payments made by the Medicaid and CHIP programs which are means-tested government programs financed jointly by Federal and state funds that provide health care to those who are eligible. Medicaid is designed to provide health coverage to families and individuals who are unable to afford necessary medical care while CHIP provides coverage to additional low income children not eligible for Medicaid. Eligibility criteria for both programs vary significantly by state.
- Out of pocket: This category includes expenses paid by the user or other family member.
- Other sources: This category includes payments from other Federal sources such as Indian Health Service, military treatment facilities, and other care provided by the Federal government; various state and local sources (community and neighborhood clinics, state and local health departments, and state programs other than Medicaid/CHIP); various unclassified sources (e.g., automobile, homeowner's, or other liability insurance, and other miscellaneous or unknown sources); Medicaid/CHIP payments reported for persons who were not reported as enrolled in the Medicaid or CHIP programs at any time during the year; and private insurance payments reported for persons without any reported private health insurance coverage during the year.
Individuals under age 65 were classified into the following three insurance categories based on household responses to the health insurance status questions:
- Any private health insurance: Individuals who, at any time during the year, had insurance that provided coverage for hospital and physician care (other than Medicare, Medicaid, or other public hospital/physician coverage) were classified as having private insurance. Coverage by TRICARE (Armed Forces-related coverage) was also included as private health insurance. Insurance that provided coverage for a single service only, such as dental or vision coverage, was not included.
- Public coverage only: Individuals were considered to have public coverage only if they met both of the following criteria: 1) they were not covered by private insurance at any time during the year, and 2) they were covered by one of the following public programs at some point during the year: Medicare, Medicaid, or other public hospital/physician coverage.
- Uninsured: The uninsured were defined as people not covered by private hospital/physician insurance, Medicare, TRICARE, Medicaid, or other public hospital/physician programs at any time during the entire year or their period of eligibility for the survey.
- Medicare only: Individuals who, at any time during the year, were covered by Medicare only.
- Medicare plus private: Individuals who at any time during the year, were covered by a combination of Medicare, TRICARE, or private insurance.
- Medicare plus other public coverage: Individuals who, at any time during the year, were covered by Medicare and some other type of public insurance, but had no private coverage.
About MEPS-HC
MEPS-HC is a nationally representative longitudinal survey that collects detailed information on health care utilization and expenditures, health insurance, and health status, as well as a wide variety of social, demographic, and economic characteristics for the U.S. civilian noninstitutionalized population. It is cosponsored by the Agency for Healthcare Research and Quality and the National Center for Health Statistics.For more information about MEPS, call the MEPS information coordinator at AHRQ at (301) 427-1656 or visit the MEPS Web site at http://www.meps.ahrq.gov/.
References
For a detailed description of the MEPS-HC survey design, sample design, and methods used to minimize sources of nonsampling errors, see the following publications:Cohen, J. Design and Methods of the Medical Expenditure Panel Survey Household Component. MEPS Methodology Report No. 1. AHCPR Pub. No. 97-0026. Rockville, MD. Agency for Health Care Policy and Research, 1997. http://www.meps.ahrq.gov/mepsweb/data_files/publications/mr1/mr1.shtml
Cohen, S. Sample Design of the 1996 Medical Expenditure Panel Survey Household Component. MEPS Methodology Report No. 2. AHCPR Pub. No. 97-0027. Rockville, MD. Agency for Health Care Policy and Research, 1997. http://www.meps.ahrq.gov/mepsweb/data_files/publications/mr2/mr2.shtml
Cohen, S. Design Strategies and Innovations in the Medical Expenditure Panel Survey. Medical Care, July 2003: 41(7) Supplement: III-5-III-12.
Ezzati-Rice, T.M., Rohde, F., Greenblatt, J. Sample Design of the Medical Expenditure Panel Survey Household Component, 1998-2007. Methodology Report No. 22. March 2008. Agency for Healthcare Research and Quality, Rockville, MD. http://www.meps.ahrq.gov/mepsweb/data_files/publications/mr22/mr22.shtml
For more information about kidney disease, see the following publications:
Chronic Kidney Disease (CKD) Information:
http://www.nkdep.nih.gov/professionals/chronic_kidney_disease.htm
Kidney Basics: http://www.kidneyfund.org/kidney-health/kidney-basics/
What is Kidney Disease?: http://www.kidney.org/kidneydisease/
Chronic Kidney Disease: http://www.webmd.com/a-to-z-guides/chronic-kidney-disease-treatment-overview
Kidney Failure: http://www.medicinenet.com/kidney_failure/article.htm
Kidney Failure and Diabetes: http://www.cdc.gov/Features/dsDiabetesKidneys/
Suggested Citation
Soni, A. and Wright, J. Average Annual Health Care Use and Expenditures for Kidney Disease among Adults 18 and Older, U.S. Civilian Noninstitutionalized Population, 2003-2007. Statistical Brief #306. December 2010. Agency for Healthcare Research and Quality. Rockville, MD. http://www.meps.ahrq.gov/mepsweb/data_files/publications/st306/stat306.shtmlAHRQ welcomes questions and comments from readers of this publication who are interested in obtaining more information about access, cost, use, financing, and quality of health care in the United States. We also invite you to tell us how you are using this Statistical Brief and other MEPS data and tools and to share suggestions on how MEPS products might be enhanced to further meet your needs. Please e-mail us at mepspd@ahrq.gov or send a letter to the address below:
Steven B. Cohen, PhD, Director
Center for Financing, Access, and Cost Trends
Agency for Healthcare Research and Quality
540 Gaither Road
Rockville, MD 20850
 |
||||||||||||||||||||||||||||||||||||
|
||||||||||||||||||||||||||||||||||||
|
|
||||||||||||||||||||||||||||||||||||
 |
||||||||||||||||||||||||||||||||||||
|
||||||||||||||||||||||||||||||||||||
|
|
||||||||||||||||||||||||||||||||||||
 |
||||||||||||||||||||||||||||||||||||
|
||||||||||||||||||||||||||||||||||||
|
|
||||||||||||||||||||||||||||||||||||
 |
||||||||||||||||||||||||||||||||||||
|
||||||||||||||||||||||||||||||||||||
|
|
||||||||||||||||||||||||||||||||||||
 |
||||||||||||||||||||||||||||||||||||
|
||||||||||||||||||||||||||||||||||||
|
|
||||||||||||||||||||||||||||||||||||
 |
||||||||||||||||||||||||||||||||||||
|
||||||||||||||||||||||||||||||||||||
|
|
||||||||||||||||||||||||||||||||||||