
|
|
|
Font Size:
|
||||
|
|
|
|
||||
STATISTICAL BRIEF #31:
Work Loss Days in the United States: 1996-2000 Estimates for the Employed Civilian Noninstitutionalized Population, Age 16 to 64
Brief Statement of Findings
- For all age groups under consideration (16-24, 25-54, 55-64), the percentage reporting work loss days due to illness, injury, or mental or emotional problems declined from 1996 to 2000.
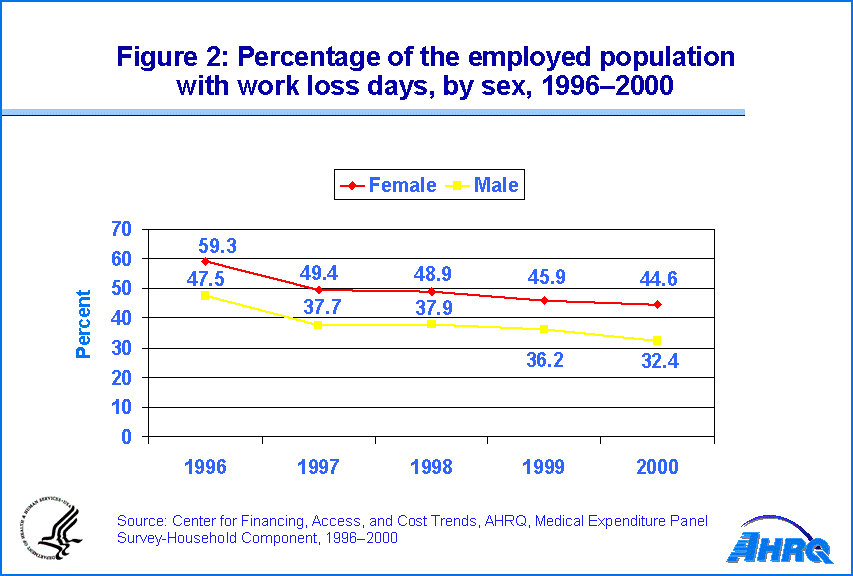
- A greater percentage of employed females reported work loss days over the five-year period due to illness, injury, or mental or emotional problems than employed males did in all years.
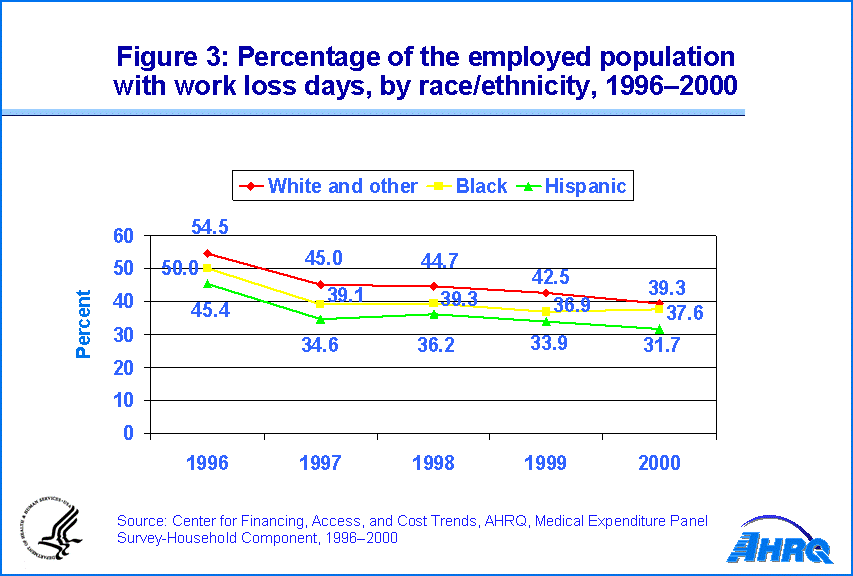
- Employed whites and others were more likely to report work loss days as compared to Hispanics from 1996 to 2000 and blacks from 1996 to 1999. For all three groups, the percentage reporting work loss days declined over the same period.
- Employed individuals who were privately insured or uninsured experienced a decline in the percentage reporting work loss days due to illness, injury, or mental or emotional problems.
Introduction
This Statistical Brief provides estimates of work loss days for the employed population, age 16 to 64, using data from the Medical Expenditure Panel Survey Household Component (MEPS-HC) for 1996 to 2000. Emphasis is placed on whether the relationships between work loss days and various socioeconomic and demographic characteristics of the population remained stable over that period. The variables of interest include age, sex, race/ethnicity, and health insurance status. Unless otherwise noted, only those differences that are statistically significant at the 0.05 level are discussed.
Discussion
Age
For all age groups under consideration (16-24, 25-54, 55-64), the percentage reporting work loss days due to illness, injury, or mental or emotional problems declined from 1996 to 2000. The percentage reporting work loss days in 1996 and 2000 was 55.4 percent and 39.9 percent, respectively, for ages 25 to 54. For ages 16 to 24 and 55 to 64, there was a decline from 47.6 percent to 33.8 percent and from 45.9 percent to 35.1 percent, respectively, over the same time period (Figure 1). Relative declines in the percentage reporting work loss days across the different age categories ranged from approximately 24 to 29 percent.
Sex
A greater percentage of employed females reported work loss days due to illness, injury, or mental or emotional problems than employed males did in all five years. For example, in 2000, 44.6 percent of females reported work loss days as compared to 32.4 percent of males (Figure 2). There was a decline in the percentage of females (59.3 percent to 44.6 percent, representing a 25 percent relative decline) and males (47.5 percent to 32.4 percent, a 32 percent relative decline) reporting work loss days over the five-year period (Figure 2).
Race/ethnicity
Employed whites and others were more likely to report work loss days as compared to Hispanics and blacks in all years (although the difference between whites and others and blacks was not significant in 2000). In 1999, 42.5 percent of whites and others reported work loss days while a lower percentage of Hispanics and blacks did, 33.9 percent and 36.9 percent, respectively (Figure 3). For all three groups, the percentage reporting work loss days declined between 1996 and 2000. For whites and others, estimates declined from 54.5 percent in 1996 to 39.3 percent in 2000, representing a 28 percent relative decline (Figure 3).
Health insurance coverage
Employed individuals who were privately insured or uninsured experienced a decline in the percentage reporting work loss days due to illness, injury, or mental or emotional problems. From 1996 to 2000, those privately insured reported a decline from 55.2 percent to 39.4 percent while the uninsured reported a decline from 43.5 percent to 30.5 percent, respectively (Figure 5). The reported relative decline was approximately 30 percent for both groups.
Definitions/Methodology
The core MEPS-HC interview contains questions about time lost from work because of a physical illness, injury, or mental or emotional problem. Data were collected on each individual in the household. Questions were repeated in each round of interviews (rounds 1 through 5). The reference period for these questions was the time period between the beginning of the year or the previous interview date and the current interview date for rounds 1 through 4. For round 5, the reference period is the time period between the previous interview date and the end of the year.
The variable work lost days represents the percentage of employed individuals who lost a half-day or more from work because of illness, injury, or mental or emotional problems during the year.
About the MEPS-HC
MEPS-HC is cosponsored by the Agency for Healthcare Research and Quality (AHRQ) and the National Center for Health Statistics (NCHS). It is a nationally representative survey of the U.S. civilian noninstitutionalized population that collects data on medical expenses for both individuals and households. MEPS-HC collects detailed data on demographic characteristics, health conditions, health status, use of medical care services, charges and payments, access to care, satisfaction with care, health insurance coverage, income, and employment. Other MEPS components collect data on the use, charges, and payments reported by medical care providers; and data on the supply side of the health insurance market.
MEPS data are released to the public in a number of formats, including public use data files and the printed MEPS Research Findings and MEPS Chartbook series. The numbers shown in this report are drawn from analyses conducted by the MEPS staff from the following public use files: 1996 and 1999 Full Year Consolidated Data Files, HC-012, and HC-038; 1997, 1998, and 2000 Supplemental Public Use Files, HC-042, HC-043, and HC-045.
For more information about MEPS, call the MEPS information coordinator at AHRQ (301-594-1406) or visit the MEPS Web site (www.meps.ahrq.gov).
References
Cohen, J. Design and Methods of the Medical Expenditure Panel Survey Household Component. MEPS Methodology Report No. 1. AHCPR Pub. No. 97-0026. Rockville, Md.: Agency for Health Care Policy and Research, 1997.
Cohen, J. et al. The Medical Expenditure Panel Survey: a national health information resource. Inquiry, 33:373-89, 1996.
Cohen, S. Sample Design of the 1996 Medical Expenditure Panel Survey Household Component. MEPS Methodology Report No. 2. AHCPR Pub. No. 97-0027. Rockville, Md.: Agency for Health Care Policy and Research, 1997.
 |
||||||||||||||||||||||||||||||||||||
|
||||||||||||||||||||||||||||||||||||
|
|
||||||||||||||||||||||||||||||||||||
 |
||||||||||||||||||||||||||||||||||||
|
||||||||||||||||||||||||||||||||||||
|
|
||||||||||||||||||||||||||||||||||||
 |
||||||||||||||||||||||||||||||||||||
|
||||||||||||||||||||||||||||||||||||
|
|
||||||||||||||||||||||||||||||||||||
 |
||||||||||||||||||||||||||||||||||||
|
||||||||||||||||||||||||||||||||||||
|
|
||||||||||||||||||||||||||||||||||||