
|
|
|
Font Size:
|
||||
|
|
|
|
||||
STATISTICAL BRIEF #316:
Trends in Person Characteristics and Expenditures for Persons under Age 65 Reporting Migraine Headaches, 1997 and 2007
Highlights
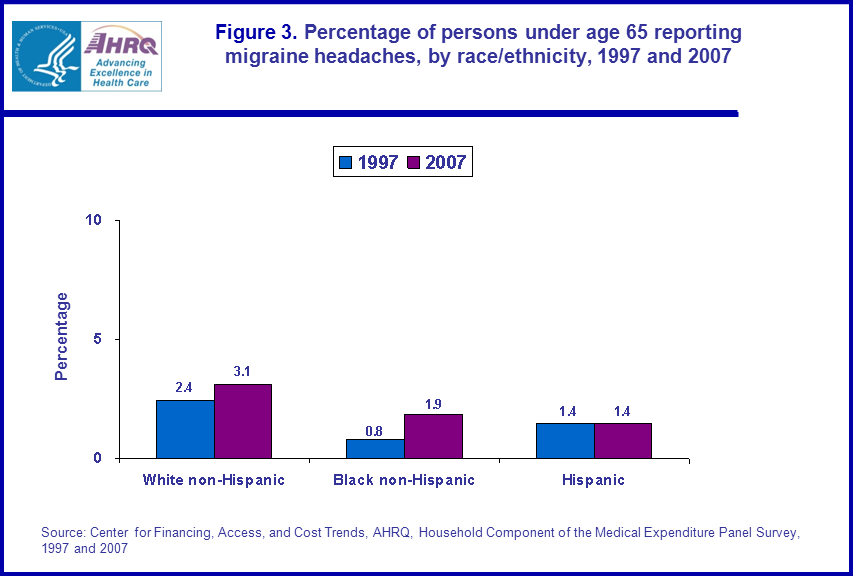
- When comparing 1997 to 2007 and the proportion of persons under age 65 reporting migraine headaches by race/ethnicity, those reporting migraine headaches increased for white non-Hispanics (2.4 percent versus 3.1 percent) and black non-Hispanics (0.8 percent versus 1.9 percent).
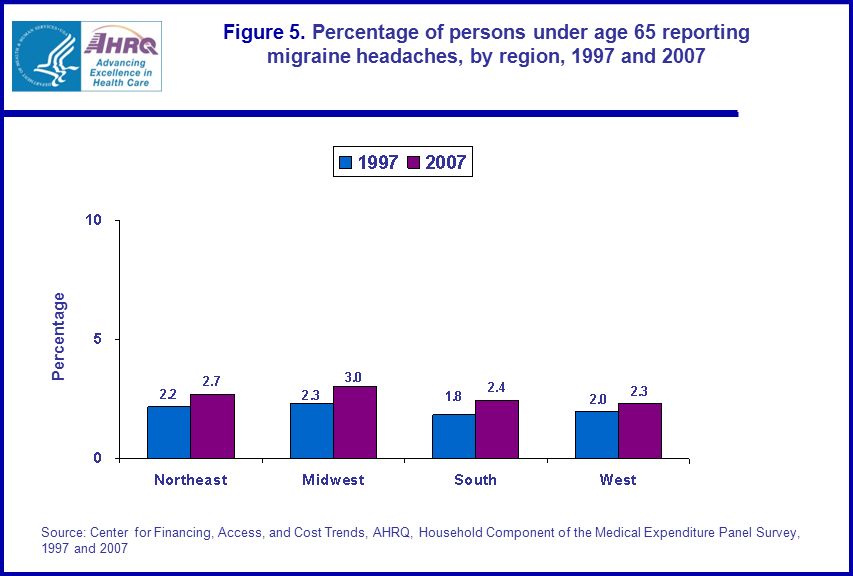
- When comparing 1997 to 2007 and the proportion of persons age 64 and younger reporting migraine headaches by region, proportions increased for persons living in the South (1.8 percent versus 2.4 percent) and Midwest (2.3 percent versus 3.0 percent).
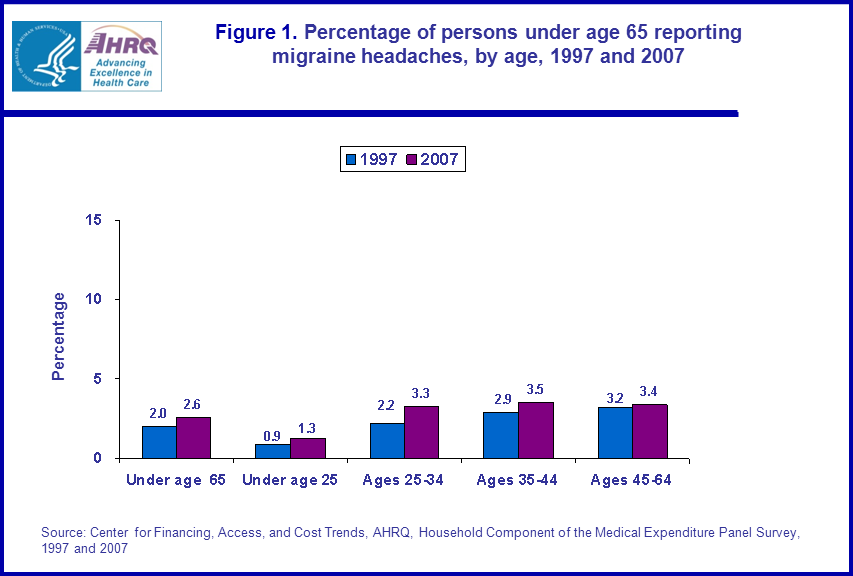
- When comparing persons under age 65 reporting migraine headaches by age in 1997 and 2007, the proportion reporting migraines increased for persons under age 25 (rising from 0.9 percent to 1.3 percent) and persons ages 25 to 34 (rising from 2.2 percent to 3.3 percent).
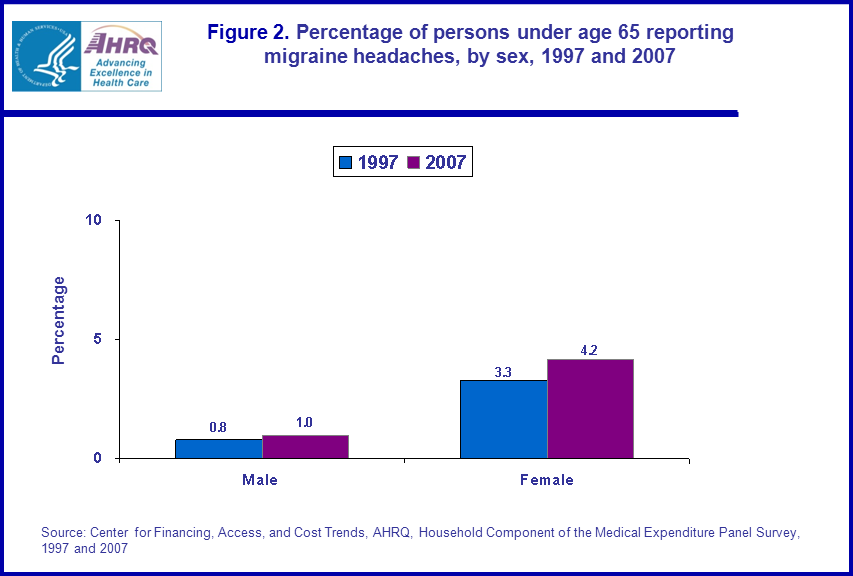
- For persons age 64 and younger, the proportion of persons reporting migraine headaches increased for women (3.3 percent versus 4.2 percent) but not for men (0.8 percent versus 1.0 percent) when comparing the years 1997 to 2007 by sex.
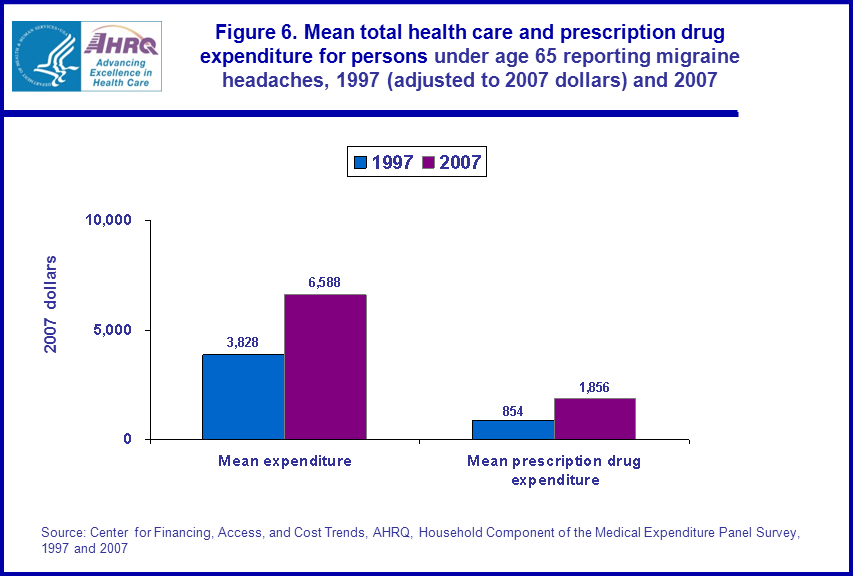
- Mean total prescription drug expenditure more than doubled for persons under age 65 reporting migraine headaches when comparing 1997 to 2007 ($854 and $1,856, respectively).
Introduction
Migraine headaches are headaches that can be debilitating; pain from them can last for hours and sometimes days, and other symptoms may include but are not limited to nausea, vomiting, and sensitivity to light and sound. At present, there is no cure for migraine headaches. However, migraine headaches can be managed and cause less disruption to one's life if causes and warning signs are recognized, monitored, and necessary action is taken which may or may not include medication.This Statistical Brief examines differences between 1997 and 2007 in the proportion of persons under age 65 reporting migraine headaches by select socioeconomic characteristics. The Brief also contains estimates of medical and prescription drug expenditures for persons under age 65 reporting migraine headaches. The estimates are for the U.S. civilian noninstitutionalized population and are derived from the 1997 and 2007 Household Component of the Medical Expenditure Panel Survey (MEPS-HC).
All differences discussed in the text are statistically significant at the 0.05 level.
Findings
In 1997, there were 271.3 million persons in the U.S. noninstitutionalized civilian population and 237.1 million were age 64 and younger. Of those aged 64 and younger, the proportion reporting migraine headaches was 2.0 percent. In 2007, the total number of persons in the U.S. noninstitutionalized civilian population was 301.3 million with 262.6 million people age 64 and younger, and the proportion of persons age 64 and younger reporting migraine headaches was 2.6 percent (figure 1).For the years 1997 and 2007, when comparing the proportion of the population reporting migraine headaches by the following age categories: those under age 25, those ages 25 to 34, those ages 35 to 44, and those ages 45 to 64, only persons under age 25 (rising from 0.9 percent to 1.3 percent) and persons ages 25 to 34 (rising from 2.2 percent to 3.3 percent), had increased proportions (figure 1).
For the years 1997 and 2007, when comparing the proportion of the population under age 65 reporting migraine headaches by sex, women had an increase in the proportion reporting migraines while men did not have an increased proportion (3.3 percent versus 4.2 percent and 0.8 percent and 1.0 percent, respectively (figure 2).
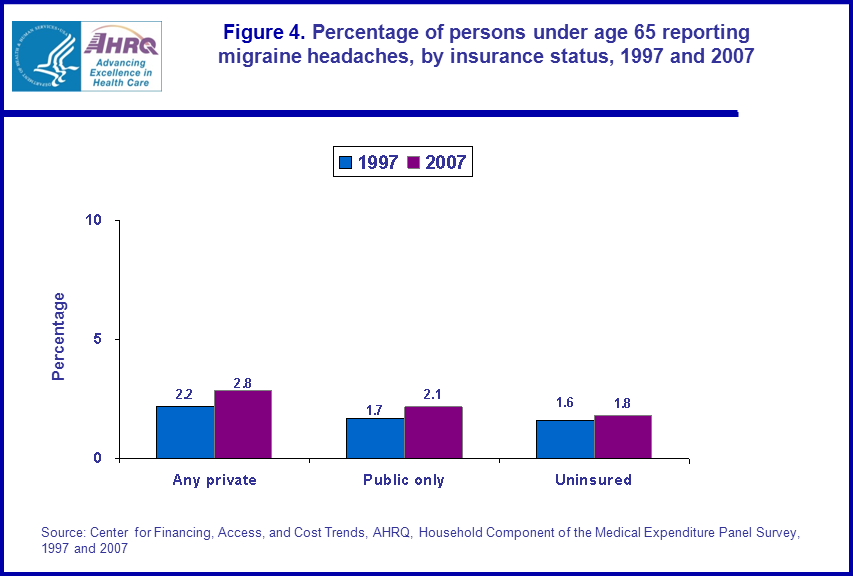
When comparing the years 1997 and 2007 and the proportion of the age 64 and younger population reporting migraine headaches by insurance status, those with any private insurance had an increased proportion (2.2 percent and 2.8 percent) while those with public insurance only (1.7 percent and 2.1 percent) and the uninsured did not have an increased proportion (1.6 percent and 1.8 percent) (figure 4).
When comparing the years 1997 and 2007 and the proportion of the age 64 and younger population reporting migraine headaches by region, those living in the Midwest had increased proportions (increasing from 2.3 percent to 3.0 percent) and South (increasing from 1.8 percent to 2.4 percent), whereas those living in the Northeast (2.2 percent versus 2.7 percent) and those living in the West did not (2.0 percent verus 2.3 percent) (figure 5).
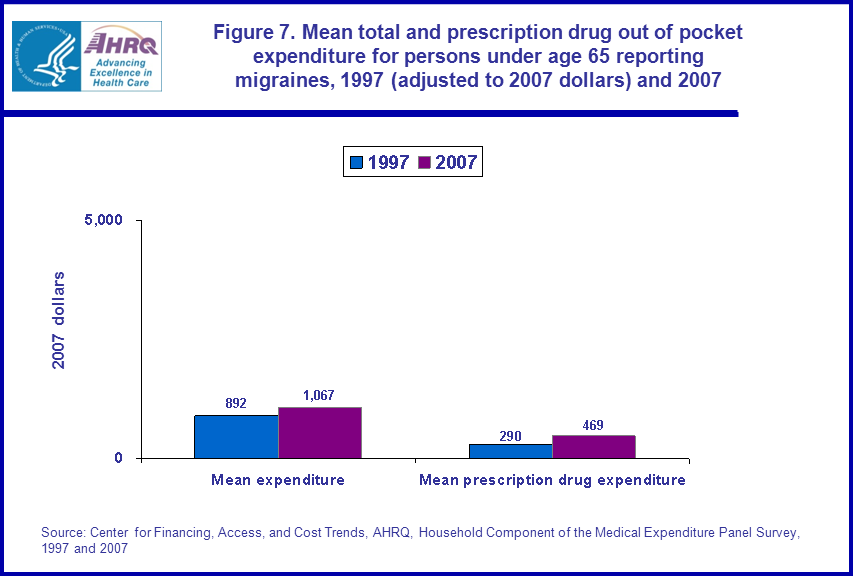
Mean total health care expenditure for persons under age 65 reporting migraine headaches increased from $3,828 in 1997 (in 2007 dollars) to $6,588 in 2007, and mean total prescription drug expenditure increased from $854 to $1,856 (figure 6). Moreover, the mean total out of pocket prescription drug expenditure for the under age 65 population reporting migraine headaches increased from $290 to $469 (figure 7). There was no significant difference in the mean total health care out of pocket expenditure for persons under age 65 reporting migraine headaches when comparing 1997 and 2007.
Data Source
The estimates shown in this Statistical Brief are based on data from MEPS HC-020: 1997 Full Year Consolidated Data File, MEPS HC-018: 1997 Medical Conditions File, and MEPS HC-113: 2007 Full Year Consolidated Data File, and MEPS HC-112: 2007 Medical Conditions File.Definitions
Medical conditionsCondition data were collected from household respondents during each round as verbatim text and coded by professional coders using the International Classification of Diseases, Ninth Revision (ICD-9). ICD-9-CM condition codes were then aggregated into clinically meaningful categories that group similar conditions using the Clinical Classification System (CCS) software. Categories were collapsed when appropriate. Note that the reported ICD-9-CM condition code values were mapped to the appropriate clinical classification category prior to being collapsed to 3-digit ICD-9-CM condition codes. The result is that every record which has an ICD-9-CM diagnosis code also has a clinical classification code. For this Statistical Brief, the following CCS codes were used: Headache; including migraine (CCS=84) excluding ICD-9=784.0.
The reporting of a medical condition in MEPS is when a respondent reports a medical condition during the household component interview. Condition information can be reported in the Condition Enumeration section, and in all questionnaire sections collecting information about health provider visits, prescription medications, and disability days.
Age
Age is the last available age for the sampled person. For most persons, this was their age at the end of the year.
Racial and ethnic classifications
Classification by race/ethnicity was based on information reported for each family member. Respondents were asked if each family member's race was best described as American Indian, Alaska Native, Asian or Pacific Islander, black, white, or other. They also were asked if each family member's main national origin or ancestry was Puerto Rican; Cuban; Mexican, Mexicano, Mexican American, or Chicano; other Latin American; or other Spanish. All persons whose main national origin or ancestry was reported in one of these Hispanic groups, regardless of racial background, were classified as Hispanic. Since the Hispanic grouping can include black Hispanic, white Hispanic, Asian and Pacific Islanders Hispanic, and other Hispanic, the race categories of black, white, Asian and Pacific Islanders, and other do not include Hispanic. MEPS respondents who reported other single or multiple races and were non-Hispanic were included in the other category. For this analysis, the following classification by race and ethnicity was used: Hispanic (of any race), non-Hispanic blacks, and non-Hispanic whites.
Health insurance status
Individuals under age 65 were classified into the following three insurance categories:
Any private health insurance: Individuals with insurance that provides coverage for hospital and physician care at any time during the year, other than Medicare, Medicaid, or other public hospital/physician coverage are classified as having private insurance. Medigap coverage is included in this category. Persons with TRICARE are also included. Insurance that provides coverage for a single service only, such as dental or vision, is not included.
Public coverage only: Individuals are considered to have public coverage only if they met both of the following criteria:
- They were not covered by private insurance at any time during the year.
- They were covered by one of the following public programs at any point during the year: Medicare, Medicaid, or other public hospital/physician coverage.
Census region
Each MEPS sampled person was classified as living in one of the following four regions as defined by the U.S. Census Bureau:
- Northeast: Maine, New Hampshire, Vermont, Massachusetts, Rhode Island, Connecticut, New York, New Jersey, and Pennsylvania.
- Midwest: Ohio, Indiana, Illinois, Michigan, Wisconsin, Minnesota, Iowa, Missouri, South Dakota, North Dakota, Nebraska, and Kansas.
- South: Delaware, Maryland, District of Columbia, Virginia, West Virginia, North Carolina, South Carolina, Georgia, Florida, Kentucky, Tennessee, Alabama, Mississippi, Arkansas, Louisiana, Oklahoma, and Texas.
- West: Montana, Idaho, Wyoming, Colorado, New Mexico, Arizona, Utah, Nevada, Washington, Oregon, California, Alaska, and Hawaii.
Expenditures refer to what is paid for health care services. More specifically, expenditures in MEPS are defined as the sum of direct payments for care provided during the year, including out-of-pocket payments and payments by private insurance, Medicaid, Medicare, and other sources. Payments for over-the-counter drugs are not included in MEPS total expenditures. Indirect payments not related to specific medical events, such as Medicaid Disproportionate Share and Medicare Direct Graduate Medical Education subsidies, are also excluded.
Mean expenditures are for all persons reporting migraine headaches and not only persons reporting migraine headaches that had a health care or prescription medicine expenditure.
Expenditures are expressed in real dollars; estimates for 1997 were adjusted to 2007 dollars based on the GDP Implicit Price Deflator (http://www.meps.ahrq.gov/mepsweb/about_meps/Price_Index.shtml).
About MEPS-HC
MEPS-HC is a nationally representative longitudinal survey that collects detailed information on health care utilization and expenditures, health insurance, and health status, as well as a wide variety of social, demographic, and economic characteristics for the U.S. civilian noninstitutionalized population. It is cosponsored by the Agency for Healthcare Research and Quality and the National Center for Health Statistics.For more information about MEPS, call the MEPS information coordinator at AHRQ (301) 427-1656 or visit the MEPS Web site at http://www.meps.ahrq.gov/.
References
For a detailed description of the MEPS-HC survey design, sample design, and methods used to minimize sources of nonsampling error, see the following publications:Cohen, J. Design and Methods of the Medical Expenditure Panel Survey Household Component. MEPS Methodology Report No. 1. AHCPR Pub. No. 97-0026. Rockville, MD. Agency for Health Care Policy and Research, 1997. http://www.meps.ahrq.gov/mepsweb/data_files/publications/mr1/mr1.shtml
Cohen, S. Sample Design of the 1996 Medical Expenditure Panel Survey Household Component. MEPS Methodology Report No. 2. AHCPR Pub. No. 97-0027. Rockville, MD. Agency for Health Care Policy and Research, 1997. http://www.meps.ahrq.gov/mepsweb/data_files/publications/mr2/mr2.shtml
Cohen, S. Design Strategies and Innovations in the Medical Expenditure Panel Survey. Medical Care, July 2003: 41(7) Supplement: III-5-III-12.
Ezzati-Rice, T.M., Rohde, F., Greenblatt, J. Sample Design of the Medical Expenditure Panel Survey Household Component, 1998-2007. Methodology Report No. 22. March 2008. Agency for Healthcare Research and Quality, Rockville, MD. http://www.meps.ahrq.gov/mepsweb/data_files/publications/mr22/mr22.shtml
Suggested Citation
Stagnitti, M.N. Trends in Person Characteristics and Expenditures for Persons under Age 65 Reporting Migraine Headaches, 1997 and 2007. Statistical Brief #316. March 2011. Agency for Healthcare Research and Quality, Rockville, MD. http://www.meps.ahrq.gov/mepsweb/data_files/publications/st316/stat316.shtmlAHRQ welcomes questions and comments from readers of this publication who are interested in obtaining more information about access, cost, use, financing, and quality of health care in the United States. We also invite you to tell us how you are using this Statistical Brief and other MEPS data and tools and to share suggestions on how MEPS products might be enhanced to further meet your needs. Please e-mail us at mepspd@ahrq.gov or send a letter to the address below:
Steven B. Cohen, PhD, Director
Center for Financing, Access, and Cost Trends
Agency for Healthcare Research and Quality
540 Gaither Road
Rockville, MD 20850
 |
||||||||||||||||||||||||
|
||||||||||||||||||||||||
|
|
||||||||||||||||||||||||
 |
||||||||||||||||||||||||
|
||||||||||||||||||||||||
|
|
||||||||||||||||||||||||
 |
||||||||||||||||||||||||
|
||||||||||||||||||||||||
|
|
||||||||||||||||||||||||
 |
||||||||||||||||||||||||
|
||||||||||||||||||||||||
|
|
||||||||||||||||||||||||
 |
||||||||||||||||||||||||
|
||||||||||||||||||||||||
|
|
||||||||||||||||||||||||
 |
||||||||||||||||||||||||
|
||||||||||||||||||||||||
|
|
||||||||||||||||||||||||
 |
||||||||||||||||||||||||
|
||||||||||||||||||||||||
|
|
||||||||||||||||||||||||