
|
|
|
Font Size:
|
||||
|
|
|
|
||||
STATISTICAL BRIEF #334:
Characteristics of Those Without Any Ambulatory Care Visits in 2008: Estimates for the U.S. Civilian Noninstitutionalized Adult Population
Highlights
- More than one-quarter of adults did not have a visit to a doctor's office or outpatient clinic in 2008.
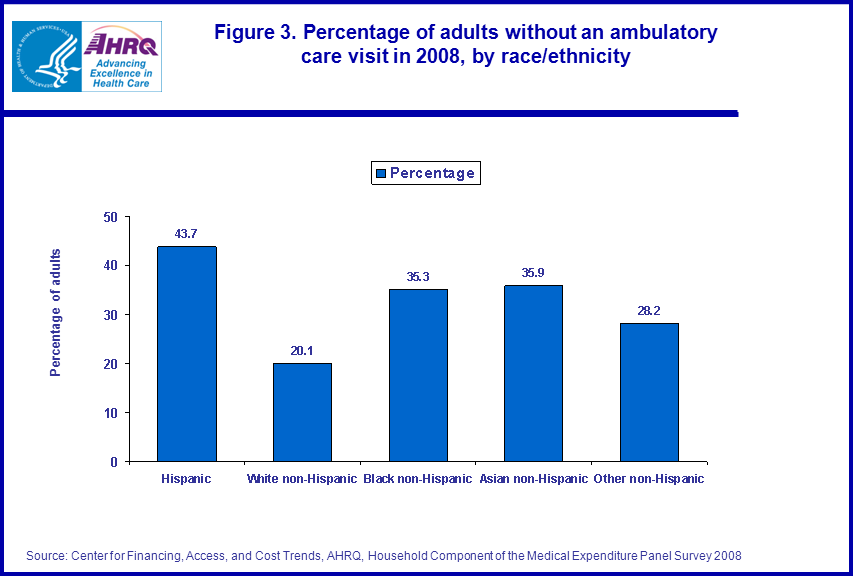
- About 44 (43.7) percent of Hispanic adults had no ambulatory care visit in 2008.
- Almost half of males ages 18-44 had no ambulatory care visit in 2008.
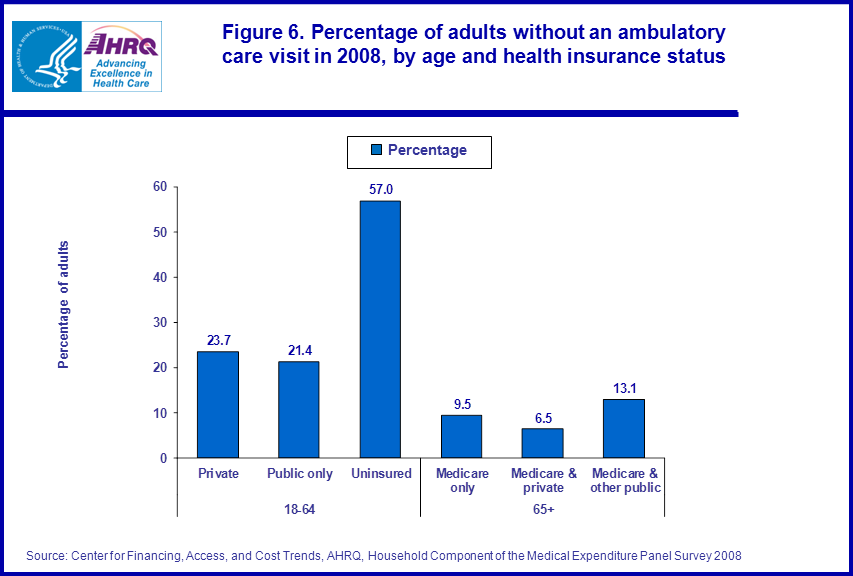
- More than half of uninsured adults, ages 18-64 did not report a visit to a doctor's office or outpatient clinic in 2008.
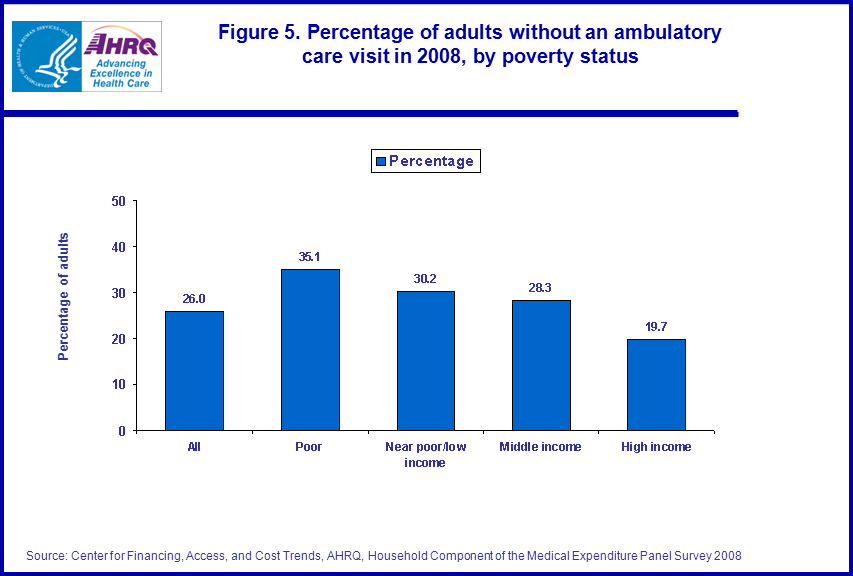
- More than one-third of poor adults had no ambulatory care visits in 2008.
Introduction
This Statistical Brief describes characteristics of persons in the U.S. civilian noninstitutionalized population who had no ambulatory care visits in 2008. Ambulatory care includes visits to a doctor’s office or outpatient clinic.The estimates provided in this Brief are derived from the Household Component of the 2008 Medical Expenditure Panel Survey (MEPS-HC). All differences between estimates discussed in the text are statistically significant at the 0.05 level.
Findings
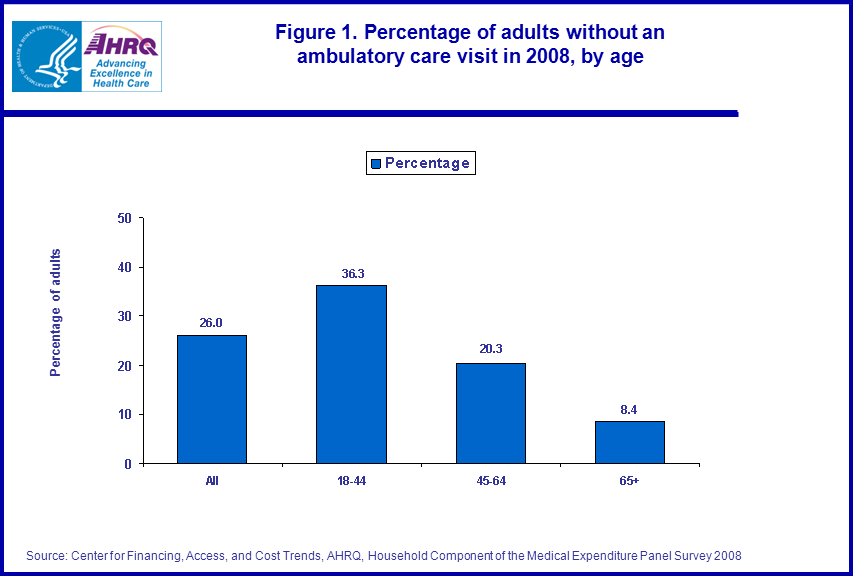
Overall, 59.7 million adults, or 26.0 percent of the U.S. adult civilian noninstitutionalized population had no ambulatory care visit in 2008.Age and having no ambulatory care visits correlated inversely. Those in the younger age group (ages 18–44) were more likely than those in older age groups (45–64 and 65 and older) to have had no ambulatory care visits during the year (36.3 percent versus 20.3 percent and 8.4 percent) (figure 1).
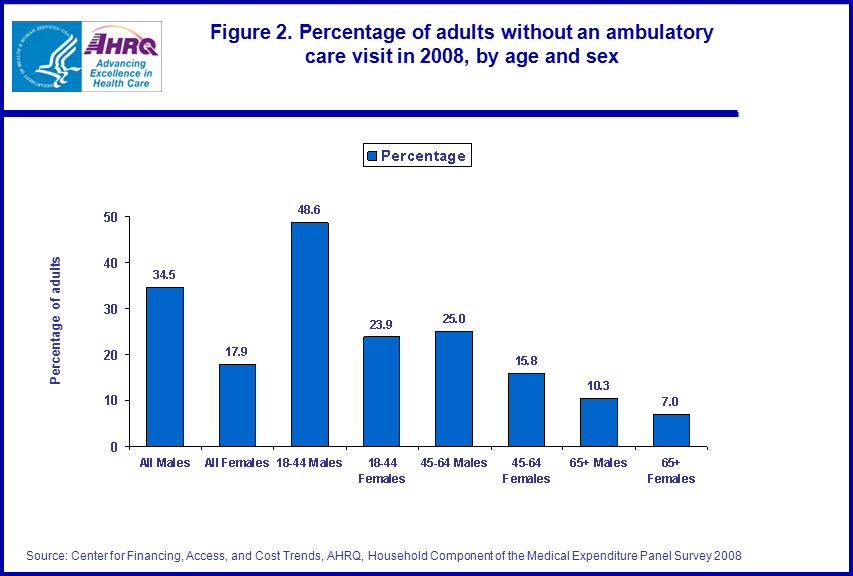
Men were more likely than women to not have had a visit to a doctor’s office or outpatient clinic. One-third of men, (34.5 percent) did not report having an ambulatory care visit in 2008 compared with less than one-fifth of women (17.9 percent) (figure 2). Across all age groups men were less likely to see a doctor. Almost half (48.6 percent) of men ages 18–44 had no doctor’s office visit or outpatient clinic visit in 2008. This was more than twice the rate of women in the same age group (23.9 percent). Among adults ages 45–64, about one-fourth (25.0 percent) of men and 15.8 percent of women reported no ambulatory care visits. Among the elderly (65 and older), 10.3 percent of men and 7.0 percent of women reported having no ambulatory care visits during calendar year 2008.
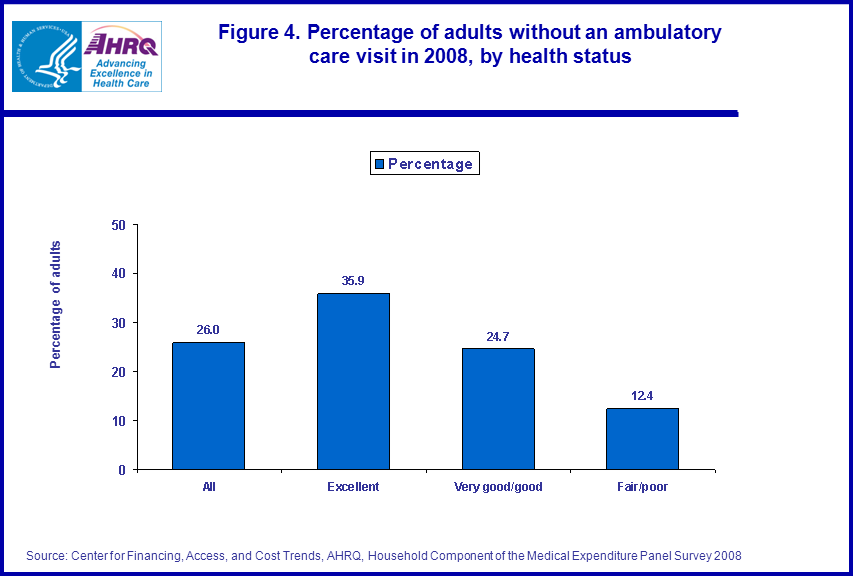
Health status was another factor related to not receiving ambulatory care in 2008. Adults in excellent health were more likely not to receive ambulatory care (35.9 percent) than those in very good or good health (24.7 percent) and those in fair or poor health (12.4 percent) (figure 4).
Relative to other characteristics, income had a less pronounced effect on getting ambulatory medical care. Across levels of poverty, the poor had the highest rate of not visiting a doctor’s office or outpatient clinic (35.1 percent); those with high income had the lowest rate at 19.7 percent (figure 5).
Of all the characteristics examined, the health insurance status of the non-elderly distinguished most dramatically those with and without ambulatory care. Among adults ages 18–64, more than half (57.0 percent) of those without health insurance for all of 2008 never went to a doctor’s office or outpatient clinic (figure 6). This was more than double the percentage of adults in the same age group with private (23.7 percent) or public-only health insurance (21.4 percent). For elderly adults age 65 and older with Medicare coverage alone or with Medicare and private insurance coverage, less than one-tenth (9.5 percent and 6.5 percent, respectively) did not have an ambulatory visit in 2008.
Data Source
The estimates shown in this Statistical Brief are based on data from the MEPS 2008 Full Year Consolidated Data File (HC-121), Medical Conditions Files (HC-120), Office-Based Medical Provider Visits File (HC-118G), Outpatient Visits File (HC-118F), Hospital Inpatient Stays File (HC-118D), Home Health File (HC-118H), Emergency Room Visits File (HC-118E), and Prescribed Medicines File (HC-118A).Definitions
Ambulatory visitAmbulatory visit refers to the ambulatory care provided in offices (medical provider seen in an office-based setting) and hospital outpatient departments.
Racial and ethnic classifications
Classification by race and ethnicity was based on information reported for each family member. Respondents were asked if each family member’s race was best described as American Indian, Alaska Native, Asian or Pacific Islander, black, white, or other. They also were asked if each family member’s main national origin or ancestry was Puerto Rican; Cuban; Mexican, Mexicano, Mexican American, or Chicano; other Latin American; or other Spanish. All persons whose main national origin or ancestry was reported in one of these Hispanic groups, regardless of racial background, were classified as Hispanic. Since the Hispanic grouping can include black Hispanic, white Hispanic, Asian and Pacific Islanders Hispanic, and other Hispanic, the race categories of black, white, Asian and Pacific Islanders, and other do not include Hispanic. MEPS respondents who reported other single or multiple races and were non-Hispanic were included in the other category.
Health insurance status
Individuals under age 65 were classified into the following three insurance categories based on household responses to the health insurance status questions:
- Any private health insurance: Individuals who, at any time during the year, had insurance that provided coverage for hospital and physician care (other than Medicare, Medicaid, or other public hospital/physician coverage) were classified as having private insurance. Coverage by TRICARE (Armed Forces–related coverage) was also included as private health insurance. Insurance that provided coverage for a single service only, such as dental or vision coverage, was not included.
- Public coverage only: Individuals were considered to have public coverage only if they met both of the following criteria: 1) they were not covered by private insurance at any time during the year, and 2) they were covered by one of the following public programs at some point during the year: Medicare, Medicaid, or other public hospital/physician coverage.
- Uninsured: The uninsured were defined as people not covered by private hospital/physician insurance, Medicare, TRICARE, Medicaid, or other public hospital/physician programs at any time during the entire year or their period of eligibility for the survey.
- Medicare only: Individuals who, at any time during the year, were covered by Medicare only.
- Medicare plus private: Individuals who, at any time during the year, were covered by a combination of Medicare and TRICARE or private insurance.
- Medicare plus other public coverage: Individuals who, at any time during the year, were covered by Medicare and some other type of public insurance, but had no private coverage.
Four income groups are defined based on the percentage of the poverty line for total family income, adjusted for family size and composition. Five categories were used: poor/negative (less than 100 percent of the poverty line), near poor (100–199 percent of the poverty line), middle (200–299 percent of the poverty line) and high (greater than 400 percent of the poverty line) in the year of the data collection.
About MEPS-HC
MEPS-HC is a nationally representative longitudinal survey that collects detailed information on health care utilization and expenditures, health insurance, and health status, as well as a wide variety of social, demographic, and economic characteristics for the U.S. civilian noninstitutionalized population. It is cosponsored by the Agency for Healthcare Research and Quality and the National Center for Health Statistics.For more information about MEPS, call the MEPS information coordinator at AHRQ (301) 427-1656 or visit the MEPS Web site at http://www.meps.ahrq.gov/
References
For a detailed description of the MEPS-HC survey design, sample design, and methods used to minimize sources of nonsampling errors, see the following publications:Cohen, J. Design and Methods of the Medical Expenditure Panel Survey Household Component. MEPS Methodology Report No. 1. AHCPR Pub. No. 97-0026. Rockville, MD. Agency for Health Care Policy and Research, 1997. http://www.meps.ahrq.gov/mepsweb/data_files/publications/mr1/mr1.shtml
Cohen, S. Sample Design of the 1996 Medical Expenditure Panel Survey Household Component. MEPS Methodology Report No. 2. AHCPR Pub. No. 97-0027. Rockville, MD. Agency for Health Care Policy and Research, 1997. http://www.meps.ahrq.gov/mepsweb/data_files/publications/mr2/mr2.shtml
Cohen, S. Design Strategies and Innovations in the Medical Expenditure Panel Survey. Medical Care, July 2003: 41(7) Supplement: III-5–III-12.
Ezzati-Rice, T.M., Rohde, F., Greenblatt, J. Sample Design of the Medical Expenditure Panel Survey Household Component, 1998–2007. Methodology Report No. 22. March 2008. Agency for Healthcare Research and Quality, Rockville, MD. http://www.meps.ahrq.gov/mepsweb/data_files/publications/mr22/mr22.shtml
Suggested Citation
Soni, A. and Roemer, M. Characteristics of Those Without Any Ambulatory Care Visits in 2008: Estimates for the U.S. Civilian Noninstitutionalized Adult Population. Statistical Brief #334. July 2011. Agency for Healthcare Research and Quality, Rockville, MD. http://www.meps.ahrq.gov/mepsweb/data_files/publications/st334/stat334.shtmlAHRQ welcomes questions and comments from readers of this publication who are interested in obtaining more information about access, cost, use, financing, and quality of health care in the United States. We also invite you to tell us how you are using this Statistical Brief and other MEPS data and tools and to share suggestions on how MEPS products might be enhanced to further meet your needs. Please e-mail us at MEPSProjectDirector@ahrq.hhs.gov or send a letter to the address below:
Steven B. Cohen, PhD, Director
Center for Financing, Access, and Cost Trends
Agency for Healthcare Research and Quality
540 Gaither Road
Rockville, MD 20850
 |
||||||||||||||||||||||||||||||||||||
|
||||||||||||||||||||||||||||||||||||
|
|
||||||||||||||||||||||||||||||||||||
 |
||||||||||||||||||||||||||||||||||||
|
||||||||||||||||||||||||||||||||||||
|
|
||||||||||||||||||||||||||||||||||||
 |
||||||||||||||||||||||||||||||||||||
|
||||||||||||||||||||||||||||||||||||
|
|
||||||||||||||||||||||||||||||||||||
 |
||||||||||||||||||||||||||||||||||||
|
||||||||||||||||||||||||||||||||||||
|
|
||||||||||||||||||||||||||||||||||||
 |
||||||||||||||||||||||||||||||||||||
|
||||||||||||||||||||||||||||||||||||
|
|
||||||||||||||||||||||||||||||||||||
 |
||||||||||||||||||||||||||||||||||||
|
||||||||||||||||||||||||||||||||||||
|
|
||||||||||||||||||||||||||||||||||||