
|
|
|
Font Size:
|
||||
|
|
|
|
||||
STATISTICAL BRIEF #340:
Asthma Medication Use among Children with Reported Treatment for Asthma, United States, 2007-2008
Highlights
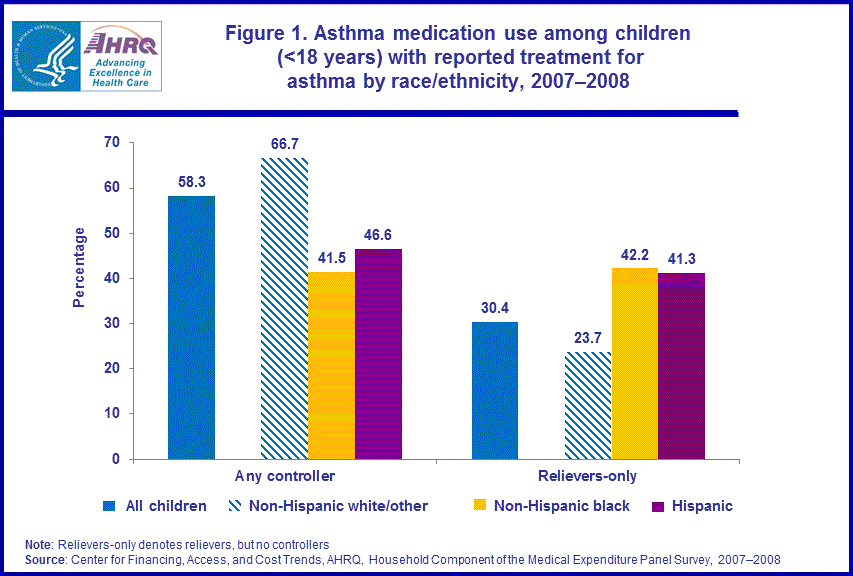
- Among children with treatment for asthma in 2007-2008, non-Hispanic white/other children were more likely (66.7 percent) to use controllers than non-Hispanic black children (41.5 percent) and Hispanic children (46.6 percent).
- Non-Hispanic white/other children were less likely (23.7 percent) than non-Hispanic black children (42.2 percent) and Hispanic children (41.3 percent) to use relievers only.
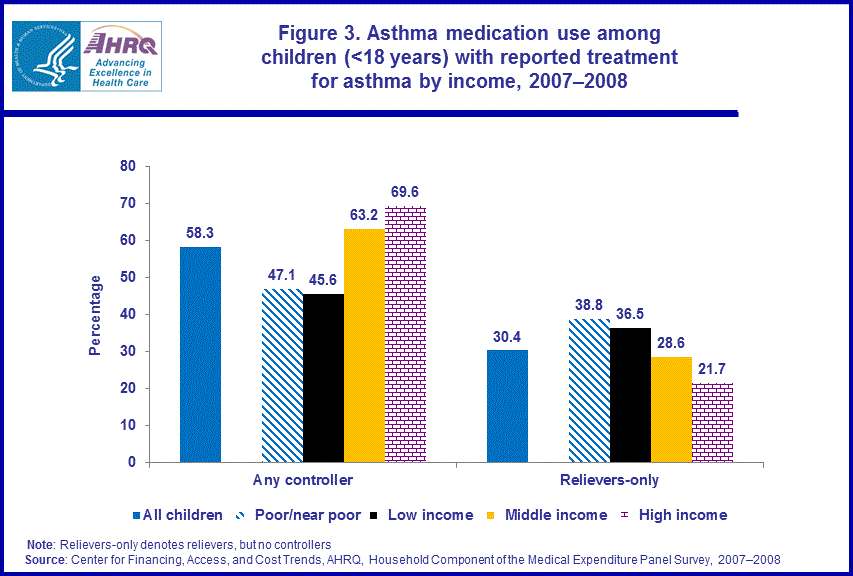
- Children in poor/near poor families were less likely (47.1 percent) than children in middle income families (63.2 percent) to use controllers and more likely (38.8 percent) than children in middle income families (28.6 percent) to use relievers only in 2007-2008.
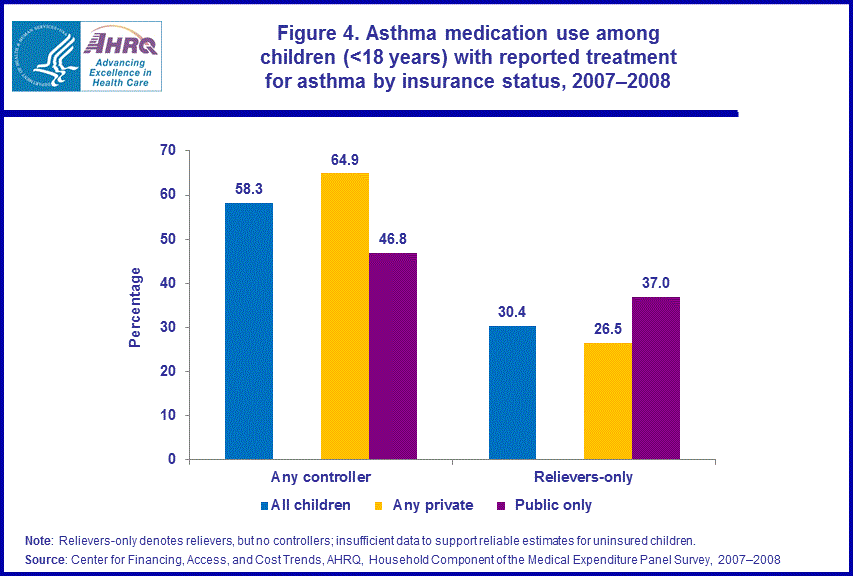
- Children with any private insurance were more likely (64.9 percent) than children with public coverage only (46.8 percent) to use controllers in 2007-2008. Children with public insurance only (37.0 percent) were more likely than children with any private insurance (26.5 percent) to use relievers only.
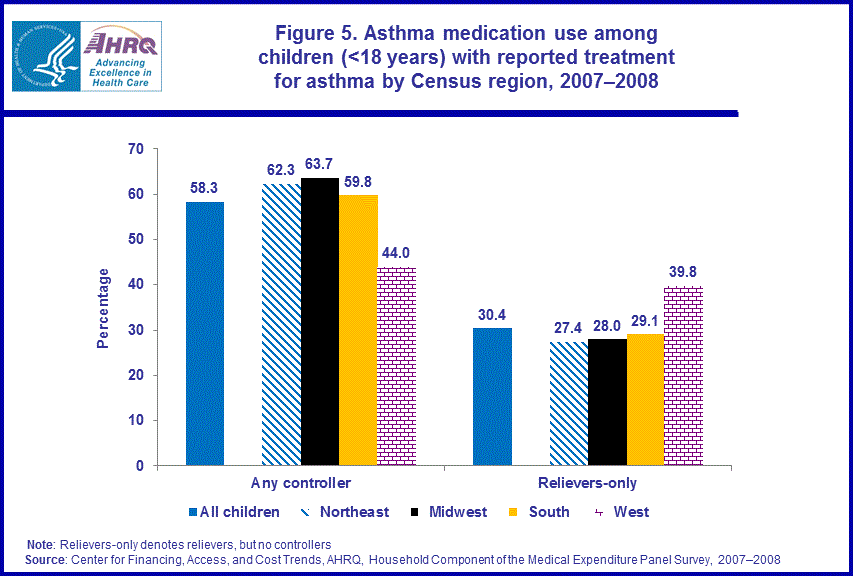
- In 2007-2008 children living in the western U.S. were less likely to use controller medications, and more likely to use relievers only, than children living in the Midwest, South, and Northeast.
Introduction
Asthma, a chronic respiratory disease, affects children of all ages but it is more prevalent among certain subpopulations than others. Asthma medications are categorized into two general classes, long-term control medication and quick-relief medication. Controllers are used to prevent asthma symptoms by minimizing inflammation and reducing the risk of serious exacerbations. Inhaled corticosteroid (ICS), a type of controller medication, is the preferred first-line therapy and is the cornerstone of asthma therapy for persistent asthma.1,2,3 Relievers are used to treat moderate or severe asthma attacks by promptly relaxing airway muscles. Additionally, children can be treated with oral corticosteroids (OCS) to reduce inflammations that do not respond to the above-mentioned classes. Given changes in treatment guidelines and the availability of, and advances in pharmacotherapy, it is important to examine how recent asthma medication use differs by demographic characteristics among children being treated for asthma.This Statistical Brief examines controller and reliever use across groups of children defined by race/ethnicity, sex, income, health insurance status, and Census region using data from the 2007 and 2008 Household Component of the Medical Expenditure Panel Survey (MEPS-HC). The estimates are based on samples of children younger than 18 years of age with reported treatment for asthma (ICD-9-CM code 493) during 2007 and 2008. Reported treatment for asthma denotes the use of any health services such as home health, inpatient hospital stays, outpatient, office-based, emergency room visits, and prescribed medicines during the year. To increase sample sizes and the precision of our estimates, we pool data from 2007–2008 and present average annual estimates for 2007–2008. About 6.1 percent of U.S. children were reported to have received treatment for asthma in 2007–2008.4 All differences between estimates discussed in the text are statistically significant at the 0.05 level or better.
Findings
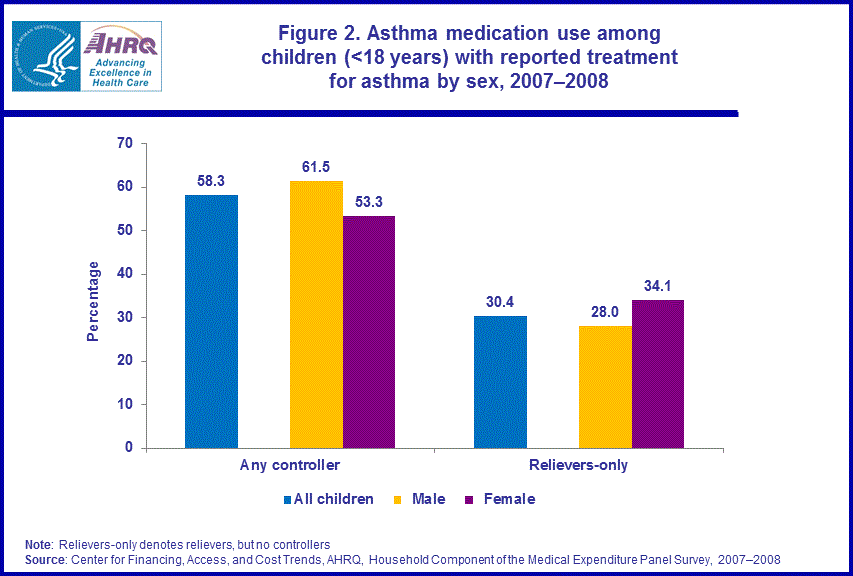
Overall, the average annual proportion of children with reported treatment for asthma who used the major classes of asthma medications in 2007–2008 are as follows: 58.3 percent used controllers, 69.3 percent used relievers and 8.7 percent used OCS to manage their asthma.4 In this Brief, we examine differences in the use of asthma medications across groups of children defined by race/ethnicity, sex, income, health insurance status, and Census region. We present results for the average annual percentages of children in each group who used at least one controller medication during the year to treat their asthma and the average annual percentages that used relievers only (e.g., used relievers but not controllers). We do not present results for the OCS class of asthma medications since there were no statistically significant differences in use of this class of asthma medication across groups of children in 2007–2008.4 During the period 2007–2008, non-Hispanic white/other children were more likely (66.7 percent) than either Hispanic children (46.6 percent) or non-Hispanic black children (41.5 percent) to use controllers. Non-Hispanic white/other children were less likely (23.7 percent) than non-Hispanic black children (42.2 percent) and Hispanic children (41.3 percent) to use relievers only to treat their asthma (figure 1).Among children with reported treatment for asthma, boys were more likely (61.5 percent) than girls (53.3 percent) to use controllers to treat their asthma in 2007–2008 (figure 2).
Among children with reported treatment for asthma, those in poor/near poor families (47.1 percent) and those in low income families (45.6 percent) were less likely than those in middle income families (63.2 percent) and those in high income families (69.6 percent) to use controllers in 2007–2008. Children in poor/near poor families were more likely (38.8 percent) than children in middle income families (28.6 percent) to use relievers only to treat their asthma (figure 3).
Among children with reported treatment for asthma, those with any private insurance were more likely (64.9 percent) than those with public coverage only (46.8 percent) to use controllers in 2007–2008. Children with public insurance only (37.0 percent) were more likely than children with any private insurance (26.5 percent) to use relievers only to treat their asthma. We did not have sufficient data to support reliable estimates for the uninsured (figure 4).
In 2007–2008, children with reported treatment for asthma who lived in the western U.S. were less likely (44.0 percent) than those who lived in the Northeast (62.3 percent), the Midwest (63.7 percent), or the South (59.8 percent) to use controllers. Children with reported treatment for asthma who lived in the western U.S. (39.8 percent) were more likely than children who lived in the Northeast (27.4 percent), the Midwest (28.0 percent), or the South (29.1 percent) to use relievers only to treat their asthma (figure 5).
Data Source
The estimates presented in this Statistical Brief were derived from the MEPS Full Year Consolidated Data Files, the MEPS Conditions Files and the MEPS Prescribed Medicines Files for the years 2007 and 2008.Definitions
Children with reported treatment for asthmaThe 2007 and 2008 MEPS Condition Files are used with the three-digit ICD-9-CM diagnosis condition variable (ICD9CODX) to construct indicator variables for asthma. Children were identified with reported treatment for asthma within the sample by tying the diagnosis code (ICD-9-CM “493”) to any reported health services utilization (i.e., home health, inpatient hospital stays, outpatient, office-based, emergency room visits, and prescribed medicines) during the year.
Asthma medications
Each drug that was listed as purchased or otherwise obtained in the MEPS Prescribed Medicines (PMED) Files was linked to the Multum Lexicon database, a product of Cerner Multum, Inc. We used the Multum drug name variable which gives the active ingredient(s) in each drug to identify the two types of asthma medications: controllers and relievers. Controller medications included ICS (inhaled corticosteroids), ILABA (inhaled long acting beta-agonists), OLABA (oral long acting beta-agonists), LTRA (leukotriene receptor antagonists), MXS (methylxanthines), NSA (non-steroidal anti-allergy agents), and ICS-ILABA combinations. Relievers included were primarily comprised of SABAs (inhaled short acting beta agonists), but also included ACB (anticholinergic bronchodilators), SANB (shorting acting non-beta selective agents), and SABA-ACB combinations.
Utilization
Indicator variables were created to identify children who used each of the major classes of asthma medications—controllers and relievers—during the year. For this Brief, “relievers-only” denotes children who used at least one reliever during the year, but did not use any controllers to treat their asthma. Utilization estimates are presented as the proportion of children using each of the two general types of asthma medications, and each specific class of asthma controller medication during the year.
Race/ethnicity
Classification by race and ethnicity was based on information provided by the household respondent for each household member. The respondent was able to describe each person’s race by specifying any combination of races that applied (i.e., multiracial). Respondents were asked if each person’s main national origin or ancestry was Puerto Rican, Cuban, Mexican, Mexicano, Mexican American, or Chicano; other Latin American; or other Spanish. Persons claiming a main national origin or ancestry in one of these Hispanic groups, regardless of racial background, were classified as Hispanic. Since the Hispanic grouping can include children of any race, the race categories of black, white, and other exclude Hispanics. The other category includes children with single races other than white and black as well as children with multiple races.
Income
In MEPS, personal income from all household members is summed to create family income. Potential sources of income include annual earnings from wages, salaries, bonuses, tips, and commissions; business and farm gains and losses; unemployment and Workers’ Compensation payments; interest and dividends; alimony, child support, and other private cash transfers; private pensions; individual retirement account (IRA) withdrawals; Social Security and Department of Veterans Affairs payments; Supplemental Security Income and cash welfare payments from public assistance and TANF (Temporary Assistance for Needy Families; formerly known as Aid to Families with Dependent Children, or AFDC); gains or losses from estates, trusts, partnerships, S corporations, rent, and royalties; and a small amount of “other” income.
Children were classified according to their family’s income in terms of poverty status. In this report, poverty status is the ratio of the family’s income to the Federal poverty thresholds, which control for the size of the family and the age of the head of the family. The following classification of poverty status was used:
Poverty status
- Poor/near poor: Children in families with income of 125 percent of the Federal poverty line or less, including those who reported negative income.
- Low income: Children in families with income from over 125 percent through 200 percent of the Federal poverty line.
- Middle income: Children in families with income from over 200 percent through 400 percent of the Federal poverty line.
- High income: Children in families with income over 400 percent of the Federal poverty line.
Children were classified in the following three insurance categories, based on household responses to health insurance status questions:
- Any private health insurance: Children who, at any time during the year, had insurance that provided coverage for hospital and physician care (other than Medicare, Medicaid, or other public hospital/physician coverage) were classified as having private insurance. Coverage by TRICARE (Armed Forces–related coverage) was also included as private health insurance. Insurance that provides coverage for a single service only, such as dental or vision coverage, was not included.
- Public coverage only: Children were considered to have public coverage only if they met both of the following criteria: 1) they were not covered by private insurance at any time during the year, and 2) they were covered by one of the following public programs at any point during the year: Medicare, Medicaid, or other public hospital/physician coverage.
- Uninsured: The uninsured were defined as children not covered by private hospital/physician insurance, Medicare, TRICARE, Medicaid, or other public hospital/physician programs at any time during the entire year or period of eligibility for the survey.
Each MEPS sampled person was classified as living in one of the following four regions as defined by the U.S. Census Bureau:
- Northeast: Maine, New Hampshire, Vermont, Massachusetts, Rhode Island, Connecticut, New York, New Jersey, and Pennsylvania.
- Midwest: Ohio, Indiana, Illinois, Michigan, Wisconsin, Minnesota, Iowa, Missouri, South Dakota, North Dakota, Nebraska, and Kansas.
- South: Delaware, Maryland, District of Columbia, Virginia, West Virginia, North Carolina, South Carolina, Georgia, Florida, Kentucky, Tennessee, Alabama, Mississippi, Arkansas, Louisiana, Oklahoma, and Texas.
- West: Montana, Idaho, Wyoming, Colorado, New Mexico, Arizona, Utah, Nevada, Washington, Oregon, California, Alaska, and Hawaii.
About MEPS-HC
MEPS-HC is a nationally representative longitudinal survey that collects detailed information on health care utilization and expenditures, health insurance, and health status, as well as a wide variety of social, demographic, and economic characteristics for the U.S. civilian noninstitutionalized population. It is cosponsored by the Agency for Healthcare Research and Quality and the National Center for Health Statistics.For more information about MEPS, call the MEPS information coordinator at AHRQ (301-427-1656) or visit the MEPS Web site at http://www.meps.ahrq.gov/.
References
For a detailed description of the MEPS survey design, sample design, and methods used to minimize sources of nonsampling error, see the following publications:Cohen, J. Design and Methods of the Medical Expenditure Panel Survey Household Component. MEPS Methodology Report No. 1. AHCPR Pub. No. 97-0026. Rockville, MD: Agency for Health Care Policy and Research, 1997. http://www.meps.ahrq.gov/mepsweb/data_files/publications/mr1/mr1.shtml
Cohen, S. Sample Design of the 1996 Medical Expenditure Panel Survey Household Component. MEPS Methodology Report No. 2. AHCPR Pub. No. 97-0027. Rockville, MD: Agency for Health Care Policy and Research, 1997. http://www.meps.ahrq.gov/mepsweb/data_files/publications/mr2/mr2.shtml
Cohen, S. Design Strategies and Innovations in the Medical Expenditure Panel Survey. Medical Care, July 2003: 41(7) Supplement: III-5–III-12.
Suggested Citation
Sarpong, E. M. and Miller, G. E. Asthma Medication Use among Children with Reported Treatment for Asthma, United States, 2007–2008. Statistical Brief #340. September 2011. Agency for Healthcare Research and Quality, Rockville, MD. http://www.meps.ahrq.gov/mepsweb/data_files/publications/st340/stat340.shtml.AHRQ welcomes questions and comments from readers of this publication who are interested in obtaining more information about access, cost, use, financing, and quality of health care in the United States. We also invite you to tell us how you are using this Statistical Brief and other MEPS data and tools and to share suggestions on how MEPS products might be enhanced to further meet your needs. Please e-mail us at mepspd@ahrq.gov or send a letter to the address below:
Steven B. Cohen, PhD, Director
Center for Financing, Access, and Cost Trends
Agency for Healthcare Research and Quality
540 Gaither Road
Rockville, MD 20850
1 National Asthma Education and Prevention Program. Expert Panel Report 3: Guidelines for the Diagnosis and Management of Asthma: Full Report 2007. Bethesda, MD: National Institutes of Health, U.S. Dept. of Health and Human Services, National Heart, Lung, and Blood Institute; 2007. http://www.nhlbi.nih.gov/guidelines/asthma/asthgdln.pdf. Accessed June 10, 2011.
2 O’Connell, E. J. Optimizing Inhaled Corticosteroid Therapy in Children with Chronic Asthma. Pediatric Pulmonology 2005, 39:74–83.
3 Wechsler, M. E. Managing Asthma in Primary Care: Putting New Guideline Recommendations into Context. Mayo Clinical Proceedings. August 2009; 84(8): 707–717
4 Miller, G. E. and Sarpong, E. M. Trends in the Pharmaceutical Treatment of Children’s Asthma, 1997 to 2008. Research Findings No. 31. September 2011. Agency for Healthcare Research and Quality, Rockville, MD. http://meps.ahrq.gov/mepsweb/data_files/publications/rf31/rf31.pdf
 |
||||||||||||||||||||||||||||||
|
||||||||||||||||||||||||||||||
|
|
||||||||||||||||||||||||||||||
 |
||||||||||||||||||||||||||||||
|
||||||||||||||||||||||||||||||
|
|
||||||||||||||||||||||||||||||
 |
||||||||||||||||||||||||||||||
|
||||||||||||||||||||||||||||||
|
|
||||||||||||||||||||||||||||||
 |
||||||||||||||||||||||||||||||
|
||||||||||||||||||||||||||||||
|
|
||||||||||||||||||||||||||||||
 |
||||||||||||||||||||||||||||||
|
||||||||||||||||||||||||||||||
|
|
||||||||||||||||||||||||||||||