
|
|
|
Font Size:
|
||||
|
|
|
|
||||
STATISTICAL BRIEF #373:
Deductibles in Employer-Sponsored Health Insurance for Civilian Employees, by Sector and Census Division, 2010
Highlights
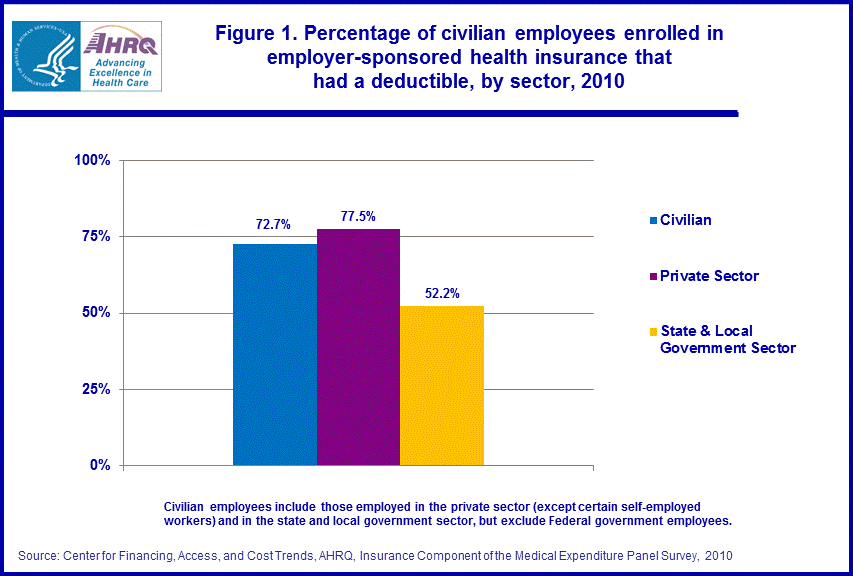
- A much smaller portion of enrolled state and local government employees than enrolled private sector employees were in employer-sponsored plans that had a deductible in 2010.
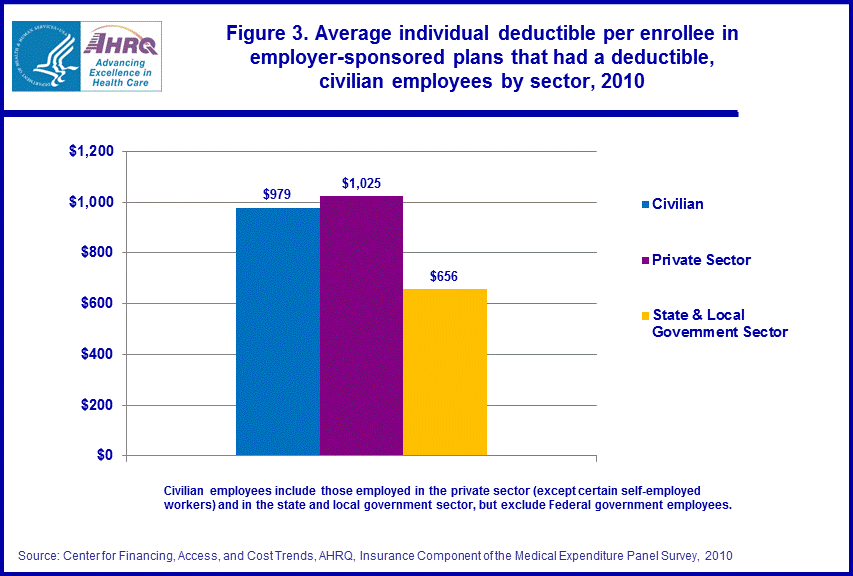
- For those in a plan with a deductible, the average individual deductible paid was much lower in state and local governments ($656) than in the private sector ($1,025) in 2010. Within all census divisions, the average individual deductible was lower in state and local governments than in the private sector.
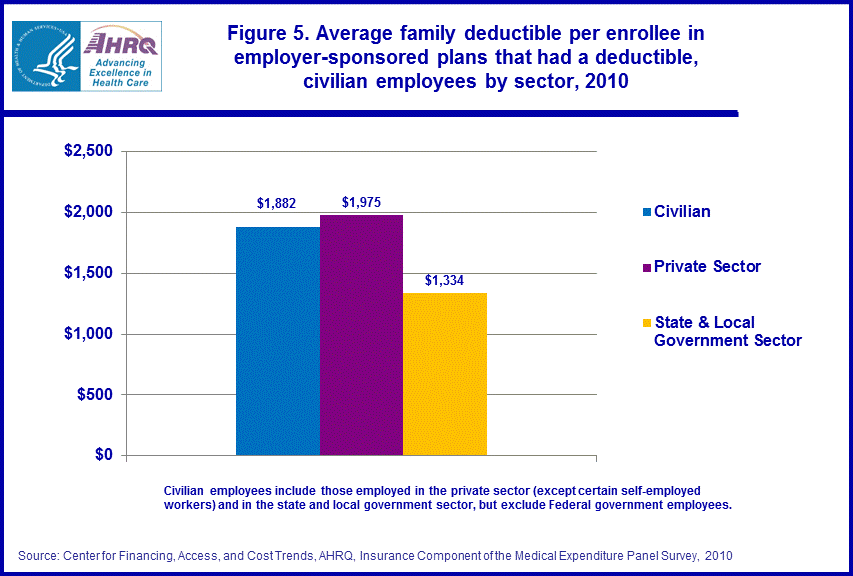
- For civilian enrollees with a deductible, the family deductible averaged $1,882 in 2010. With the exception of West South Central, the family deductible was smaller in state and local governments than in the private sector in all census divisions.
Introduction
Of the total 69.2 million civilian employees enrolled in employer-sponsored health insurance in 2010, 81.2 percent (56.2 million) were in the private sector while 18.8 percent (13.0 million) were in the state and local government sector.Characteristics of employer-sponsored coverage can differ for private sector enrollees versus state and local government enrollees. This Statistical Brief examines one plan characteristic across the two sectors—the frequency and amounts of deductibles. A deductible is a fixed dollar amount during the benefit period—usually a year—that an enrollee pays before the insurer starts to make payments for covered medical services. Plans may have both individual and family deductibles.
The analysis looks at the two sectors within and across the nine United States geographic divisions identified by the Bureau of the Census—New England, Middle Atlantic, East North Central, West North Central, South Atlantic, East South Central, West South Central, Mountain, and Pacific. See the “Definitions” section for a list of the states in each division.
Estimates used in this analysis come from the Medical Expenditure Panel Survey-Insurance Component (MEPS-IC), an annual survey sponsored by the Agency for Healthcare Research and Quality. Only comparisons with a statistically significant difference at the 0.05 percent significance level are noted in the text.
Findings
FrequencyA much smaller portion of enrolled state and local government employees than enrolled private sector employees were in employer-sponsored plans that had a deductible in 2010. Only 52.2 percent of state and local government enrollees had a deductible while 77.5 percent of private sector enrollees had a deductible. The overall percentage for civilian enrollees was 72.7 percent (figure 1).
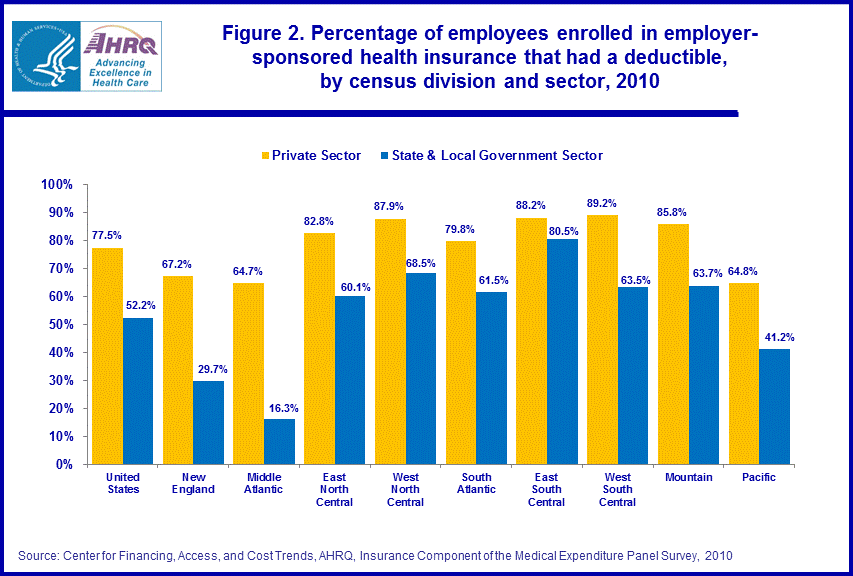
Within each census division, the percentage of state and local government enrollees with a deductible was lower than that for private sector enrollees. For state and local governments, the percentage ranged from 16.3 percent in Middle Atlantic to 80.5 percent in East South Central. For the private sector, the percentage ranged from 64.7 percent in Middle Atlantic to 89.2 percent in West South Central (figure 2).
For state and local governments, the same census divisions had a below-average portion of enrollees with deductibles as in the private sector—Middle Atlantic (16.3 percent), New England (29.7 percent), and Pacific (41.2 percent). All the remaining divisions had an above-average portion of state and local government enrollees with deductibles.
Deductible amounts
The average individual deductible paid by enrollees with a deductible was much lower in state and local governments ($656) than in the private sector ($1,025) in 2010 (figure 3). Overall, the amount was $979 for civilian workers.
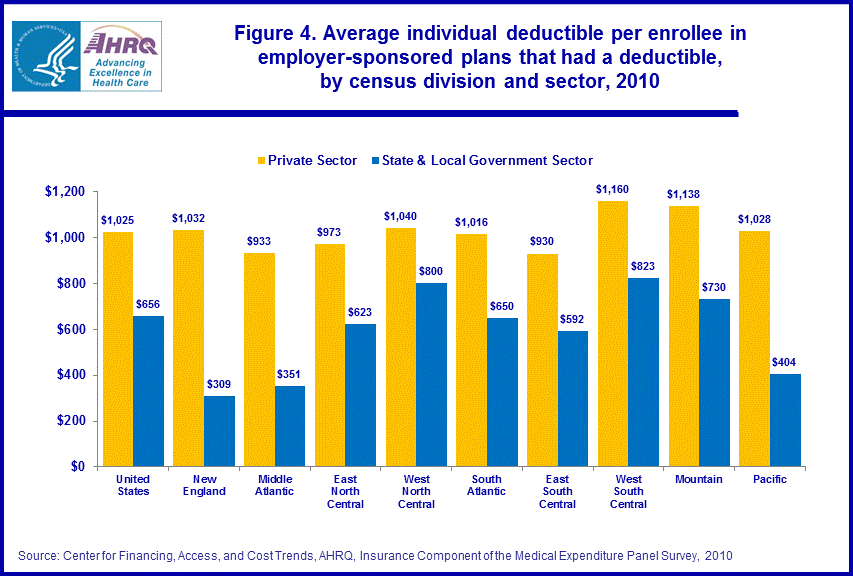
Within each census division, the average individual deductible was lower in state and local governments than in the private sector (figure 4).
Middle Atlantic was the only division where private sector enrollees had a below-average individual deductible — $933 — compared to the national private sector average. Mountain ($1,138) was the only division where private-sector enrollees had an above-average deductible. Deductibles for the remaining divisions did not differ from the private sector average.
Within state and local governments, the Middle Atlantic ($351) division also had a below-average individual deductible as did the New England ($309) and Pacific ($404) divisions. West South Central ($823) and West North Central ($800) had above-average deductibles in 2010.
As with individual deductibles, the average family deductible was much lower for state and local government enrollees ($1,334) than for private sector enrollees ($1,975) for those with a deductible (figure 5). For civilian enrollees, the family deductible averaged $1,882 in 2010.
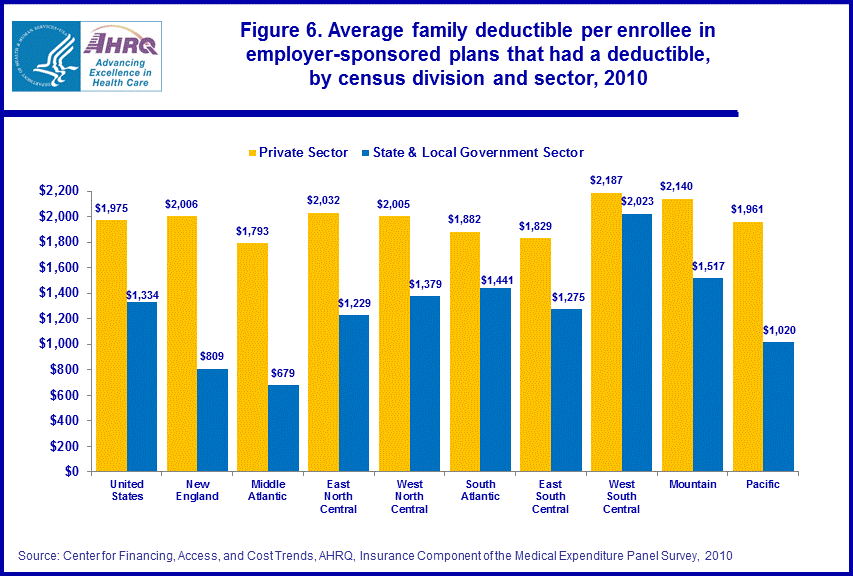
With the exception of West South Central, the family deductible was smaller in state and local governments than in the private sector in all census divisions (figure 6). For West South Central, the average deductible did not differ between the two sectors.
In the private sector, no average family deductible for a census division differed from the $1,975 national average in 2010.
The family deductible for state and local government enrollees was lower than average in three census divisions: Middle Atlantic ($679), New England ($809), and Pacific ($1,020). As noted earlier, 2010 individual deductibles were below-average in these divisions also. The family deductible for state and local government enrollees was higher than average in West South Central ($2,023).
Data Source
The statistics in this Brief are estimates from the 2010 MEPS-IC. All information comes from tables that are available on the MEPS Web site at http://www.meps.ahrq.gov/mepsweb/survey_comp/Insurance.jsp.Definitions
Census divisions- New England: Connecticut, Maine, Massachusetts, New Hampshire, Rhode Island, Vermont
- Middle Atlantic: New Jersey, New York, Pennsylvania
- East North Central: Illinois, Indiana, Michigan, Ohio, Wisconsin
- West North Central: Iowa, Kansas, Minnesota, Missouri, Nebraska, North Dakota, South Dakota
- South Atlantic: Delaware, District of Columbia, Florida, Georgia, Maryland, North Carolina, South Carolina, Virginia, West Virginia
- East South Central: Alabama, Kentucky, Mississippi, Tennessee
- West South Central: Arkansas, Louisiana, Oklahoma, Texas
- Mountain: Arizona, Colorado, Idaho, Montana, Nevada, New Mexico, Utah, Wyoming
- Pacific: Alaska, California, Hawaii, Oregon, Washington
Includes employees of private sector firms (see exception related to self-employment below) and state and local governments. Excludes Federal government employees.
The self-employed who have no employees and who have an unincorporated business are excluded. The self-employed who have no employees and who have an incorporated business are included. Also included are employees of all businesses with a self-employed owner that have at least one employee in addition to the owner.
Deductible
A fixed dollar amount during the benefit period—usually a year—that an insured person pays before the insurer starts to make payments for covered medical services. Plans may have both per individual and family deductibles.
Employee
A person on the actual payroll, including the owner or manager if that person works at the firm. Excludes temporary and contract workers.
Enrollee
An employee that is enrolled in a health insurance plan offered by the employer. Enrollees do not include any dependents covered by the plan.
Health insurance plan/coverage
An insurance contract that provides hospital and/or physician coverage to an employee for an agreed-upon fee (premium) for a defined benefit period.
About MEPS-IC
The MEPS-IC is a survey of business establishments and governments that collects information on employer-sponsored health insurance, such as whether insurance is offered, enrollments, types of plans, and premiums. The survey is conducted annually by the U.S. Bureau of the Census under the sponsorship of the Agency for Healthcare Research and Quality (AHRQ). A total sample of approximately 42,000 private-sector establishments was selected for the 2010 survey, with 8.3 percent of the sample determined to be out of scope during the data collection process. The response rate for the private sector was 82.7 percent of the remaining in-scope sample units. For the state and local governments, about 3,100 units were selected for the sample and the response rate was 93.4 percent.For more information on this survey, see MEPS Methodology Reports 6, 8, 10, 14, 17, and 18 on the MEPS Web site at http://www.meps.ahrq.gov/mepsweb/data_stats/Pub_ProdLookup_Results.jsp?ProductType=Methodology%20Report&Comp=Insurance and Insurance Component Survey Basics at http://www.meps.ahrq.gov/mepsweb/survey_comp/Insurance.jsp.
Suggested Citation
Crimmel, B. L. Deductibles in Employer-Sponsored Health Insurance for Civilian Employees, by Sector and Census Division, 2010. Statistical Brief #373. July 2012. Agency for Healthcare Research and Quality, Rockville, MD. http://www.meps.ahrq.gov/mepsweb/data_files/publications/st373/stat373.shtmlAHRQ welcomes questions and comments from readers of this publication who are interested in obtaining more information about access, cost, use, financing, and quality of health care in the United States. We also invite you to tell us how you are using this Statistical Brief and other MEPS data and tools and to share suggestions on how MEPS products might be enhanced to further meet your needs. Please e-mail us at MEPSProjectDirector@ahrq.hhs.gov or send a letter to the address below:
Steven B. Cohen, PhD, Director
Center for Financing, Access, and Cost Trends
Agency for Healthcare Research and Quality
540 Gaither Road
Rockville, MD 20850
 |
|||||||||||||||||||||||||||||||||||||||
|
|||||||||||||||||||||||||||||||||||||||
|
|
|||||||||||||||||||||||||||||||||||||||
 |
|||||||||||||||||||||||||||||||||||||||
|
|||||||||||||||||||||||||||||||||||||||
|
|
|||||||||||||||||||||||||||||||||||||||
 |
|||||||||||||||||||||||||||||||||||||||
|
|||||||||||||||||||||||||||||||||||||||
|
|
|||||||||||||||||||||||||||||||||||||||
 |
|||||||||||||||||||||||||||||||||||||||
|
|||||||||||||||||||||||||||||||||||||||
|
|
|||||||||||||||||||||||||||||||||||||||
 |
|||||||||||||||||||||||||||||||||||||||
|
|||||||||||||||||||||||||||||||||||||||
|
|
|||||||||||||||||||||||||||||||||||||||
 |
|||||||||||||||||||||||||||||||||||||||
|
|||||||||||||||||||||||||||||||||||||||
|
|
|||||||||||||||||||||||||||||||||||||||