
|
|
|
Font Size:
|
||||
|
|
|
|
||||
STATISTICAL BRIEF #415:
Dental Expenditures in the 10 Largest States, 2010
Highlights
- In 2010, dental expenditures represented 6.6 percent of all medical expenditures.
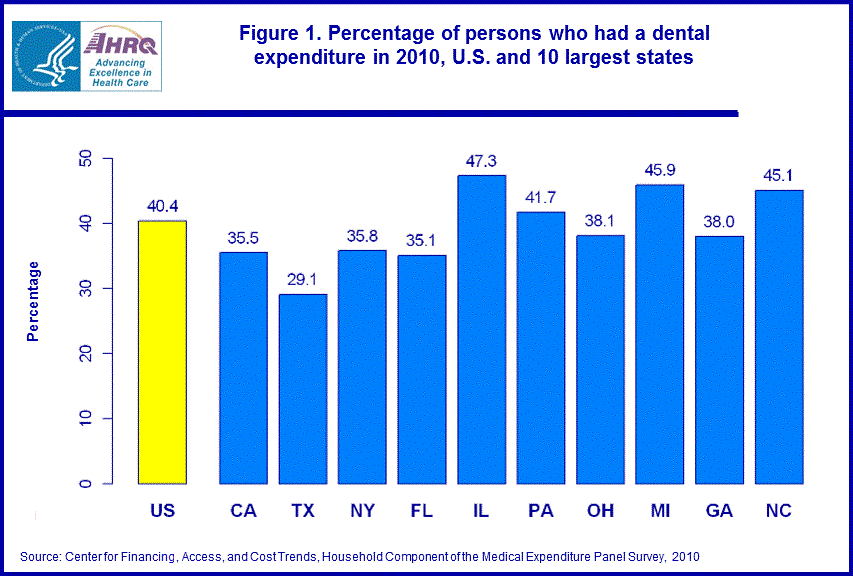
- The percentage of people with dental expenses in 2010 was lower than the national average in California and Texas, and higher than the national average in Illinois and Michigan.
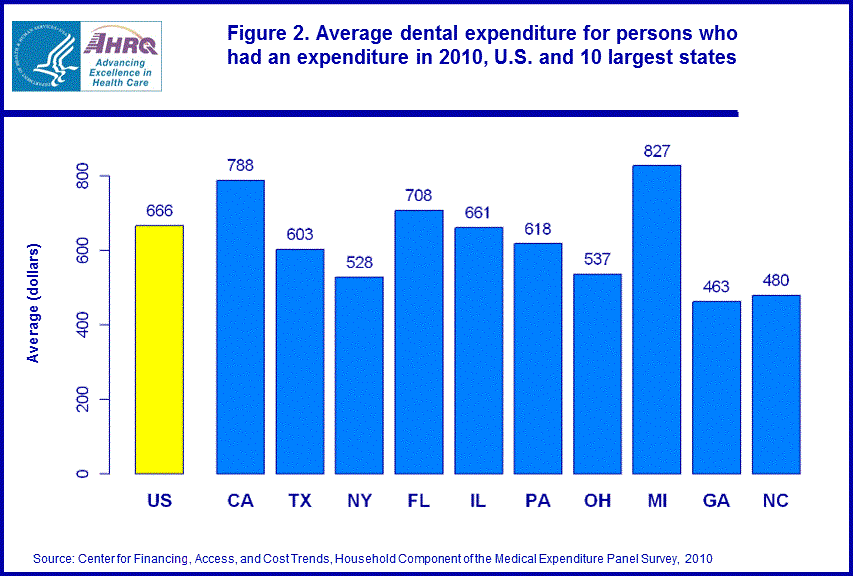
- Among persons with dental expenses, the average expense was higher than the national average in California and Michigan, and lower than the national average in New York, Ohio, and Georgia.
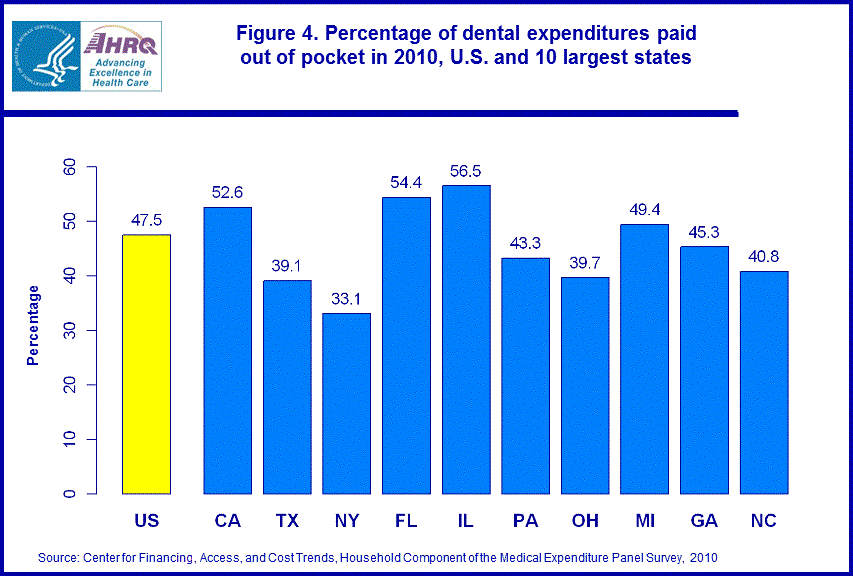
- The percentage of dental expenses paid out of pocket was lower than the national average in New York.
Introduction
In 2010, expenditures for dental care accounted for 6.6 percent of the overall health care expenditures among the U.S. civilian noninstitutionalized population. Dental expenditures were incurred by 40.4 percent of the population, and the average annual expense per person was $666.Dental expenditures are distinguished from overall health care expenditures in the distribution by sources of payment. In 2010, a higher percentage of dental expenditures was paid out of pocket (47.5 percent for dental versus 14.2 percent overall) and a lower percentage was paid by Medicaid (5.8 percent versus 10.4 percent). Dental and overall expenditures were similar in the percentage paid by private insurance (43.1 percent versus 40.1 percent) (data for overall category not shown).
Many factors can influence health care expenses in a particular state, including the demographic, socioeconomic, and health status characteristics of the population. Further, the prevalence and types of health insurance coverage in a state can impact access to care, the level of expenditures, and the extent to which different sources finance health care services.
This Statistical Brief presents estimates based on data from the Household Component of the Medical Expenditure Panel Survey (MEPS-HC) on the use, expenditures, and sources of payments for dental expenditures for persons in the U.S. civilian noninstitutionalized population in 2010 for the 10 largest states, and compares the results to the national average in 2010. Only those estimates with statistically significant differences from the national average using a multiple comparison procedure at the .05 significance level are noted in the text.
Findings
In 2010, 40.4 percent of the U.S. civilian noninstitutionalized population had an expense for dental care (figure 1). Compared to the U.S. as a whole, the percentage with a dental expense was lower in California (35.5 percent) and Texas (29.1 percent), and it was higher in Illinois (47.3 percent) and Michigan (45.9 percent).Among those persons with a dental expenditure in the U.S., the average annual expense was $666 (figure 2). This average was lower in New York ($528), Ohio ($537), and Georgia ($463), and it was higher in California ($788) and Michigan ($827).
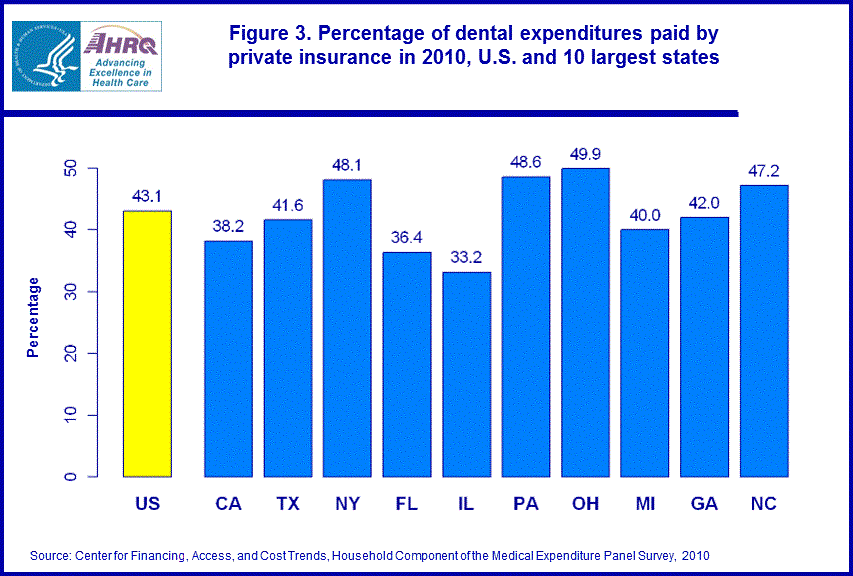
In 2010, 43.1 percent of dental expenses in the U.S. were paid by private insurance (figure 3). The percentage paid by private insurance was lower in Illinois (33.2 percent).
Nationally, almost half (47.5 percent) of dental expenses was paid out of pocket in 2010 (figure 4). In New York, only a third (33.1 percent) of these expenses was paid out of pocket.
Data Source
The estimates shown in this Statistical Brief are drawn from analyses conducted by MEPS staff using expenditure data from the following public use file: 2010 Full Year Consolidated File, HC-138.Definitions
ExpendituresExpenditures include total payments from all sources to hospitals, physicians, other health care providers (including dental care and home health), pharmacies, and providers of other medical equipment for services reported by respondents in the MEPS-HC. Sources include direct payments from individuals, private insurance (including TRICARE), Medicare, Medicaid, and various other sources (including the Department of Veterans Affairs, Workers' Compensation, and miscellaneous public sources).
Dental expenditures
This subcategory of expenditures includes those expenses for any type of dental care.
About MEPS-HC
MEPS-HC is a nationally representative longitudinal survey that collects detailed information on health care utilization and expenditures, health insurance, and health status, as well as a wide variety of social, demographic, and economic characteristics for the U.S. civilian noninstitutionalized population. It is cosponsored by the Agency for Healthcare Research and Quality and the National Center for Health Statistics.For more information about MEPS, call the MEPS information coordinator at AHRQ (301-427-1406) or visit the MEPS Web site at http://www.meps.ahrq.gov.
References
For a detailed description of the MEPS-HC survey design, sample design, and methods used to minimize sources of nonsampling error, see the following publications:Cohen, J. Design and Methods of the Medical Expenditure Panel Survey Household Component. MEPS Methodology Report No. 1. AHCPR Pub. No 97-0026. Rockville, MD. Agency for Health Care Policy and Research, 1997. http://meps.ahrq.gov/mepsweb/data_files/publications/mr1/mr1.shtml
Cohen, S. Sample Design of the 1996 Medical Expenditure Panel Survey Household Component. MEPS Methodology Report No. 2. AHCPR Pub. No. 97-0027. Rockville, MD. Agency for Health Care Policy and Research, 1997. http://meps.ahrq.gov/mepsweb/data_files/publications/mr2/mr2.shtml
Cohen, S. Design Strategies and Innovations in the Medical Expenditure Panel Survey. Medical Care, July 2003: 41(7) Supplement: III-5–III-12.
Sommers, J.P. Producing State Estimates with the Medical Expenditure Panel Survey-Household Component. Agency for Healthcare Research and Quality Working Paper No. 05011, March 2005.
Ezzati-Rice, T.M., Rohde, F., Greenblatt, J. Sample Design of the Medical Expenditure Panel Survey Household Component, 1998–2007. Methodology Report No. 22. March 2010. Agency for Healthcare Research and Quality, Rockville, MD. http://www.meps.ahrq.gov/mepsweb/data_files/publications/mr22/mr22.shtml
Suggested Citation
Rohde, F. Dental Expenditures in the 10 Largest States, 2010. Statistical Brief #415. June 2013. Agency for Healthcare Research and Quality, Rockville, MD. http://www.meps.ahrq.gov/mepsweb/data_files/publications/st415/stat415.shtmlAHRQ welcomes questions and comments from readers of this publication who are interested in obtaining more information about access, costs, use, financing, and quality of health care in the United States. We also invite you to tell us how you are using this Statistical Brief and other MEPS data and tools and to share suggestions on how MEPS products might be enhanced to further meet your needs. Please email us at MEPSProjectDirector@ahrq.hhs.gov or send a letter to the address below:
Steven B. Cohen, PhD, Director
Center for Financing, Access, and Cost Trends
Agency for Healthcare Research and Quality
540 Gaither Road
Rockville, MD 20850
 |
||||||||||||||||||||||||||||||||||||
|
||||||||||||||||||||||||||||||||||||
|
|
||||||||||||||||||||||||||||||||||||
 |
||||||||||||||||||||||||||||||||||||
|
||||||||||||||||||||||||||||||||||||
|
|
||||||||||||||||||||||||||||||||||||
 |
||||||||||||||||||||||||||||||||||||
|
||||||||||||||||||||||||||||||||||||
|
|
||||||||||||||||||||||||||||||||||||
 |
||||||||||||||||||||||||||||||||||||
|
||||||||||||||||||||||||||||||||||||
|
|
||||||||||||||||||||||||||||||||||||