
|
|
|
Font Size:
|
||||
|
|
|
|
||||
STATISTICAL BRIEF #430:
Trends in Antidepressant Utilization and Expenditures in the U.S. Civilian Noninstitutionalized Population by Age, 2000 and 2010
Highlights
- From 2000 to 2010, the number of people in the U.S. civilian noninstitutionalized population purchasing at least one outpatient prescription antidepressant increased for those ages 18-44, 45-64, and 65 and older. For those persons under age 18, there was no significant increase or decrease.
- Comparing 2000 and 2010, the total number of outpatient prescription antidepressants purchased increased for those ages 18-44, 45-64, and 65 and older.
- Comparing 2000 with 2010, for persons ages 18-44, 45-64, and 65 and older in the U.S. civilian noninstitutionalized population, the inflation adjusted total expense for antidepressants increased.
- From 2000 to 2010, for people ages 45-64 the total number of people purchasing one or more prescribed antidepressant increased by 91.3 percent, the total number of antidepressants purchased increased by 107.4 percent, and total expense for antidepressants increased by 103.3 percent.
- From 2000 to 2010, for persons age 65 and older, inflation adjusted total expense on antidepressants increased 125.6 percent and the number of antidepressants purchased increased 122.0 percent.
Introduction
Rising prescribed medicine costs and trends associated with those increases are an area of particular interest to U.S. policymakers and consumers of health care. Analyzing trends in total prescription drug costs by therapeutic subclasses and age provides decision makers and the public with a clearer understanding of current circumstances with respect to medicine use and expenses, and what to expect in the future. This Statistical Brief provides trends for antidepressants by age.This Brief presents trends in utilization and expenditures by age for outpatient prescription antidepressants in the U.S. civilian noninstitutionalized population for the years 2000 and 2010. The estimates are derived from the 2000 and 2010 Household Component of the Medical Expenditure Panel Survey (MEPS-HC). The Brief examines trends in the number of persons purchasing at least one prescription, total expenditures, and total number of prescriptions, as well as average annual cost per person and average cost per prescription.
Only prescriptions purchased or obtained in an outpatient setting are included in these estimates. Prescription medicines administered in an inpatient setting or in a clinic or physician's office are excluded. Expenditure estimates are presented in real dollars; estimates for 2000 were inflated to 2010 dollars based on the GDP Price Index (http://www.meps.ahrq.gov/mepsweb/about_meps/Price_Index.shtml). All differences discussed in the text are statistically significant at the 0.05 level.
Findings
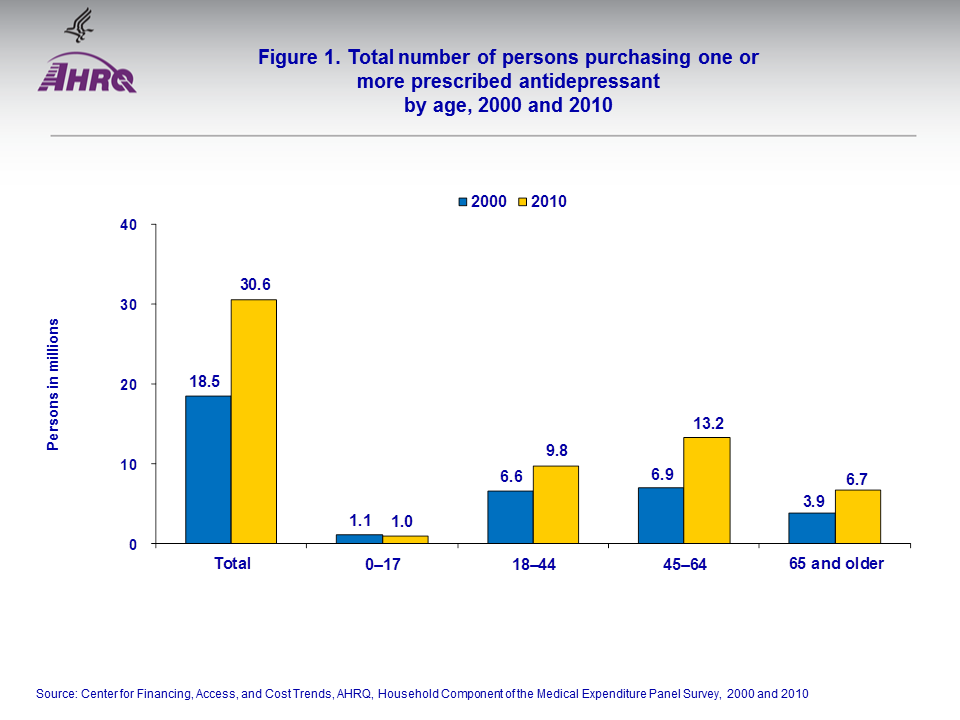
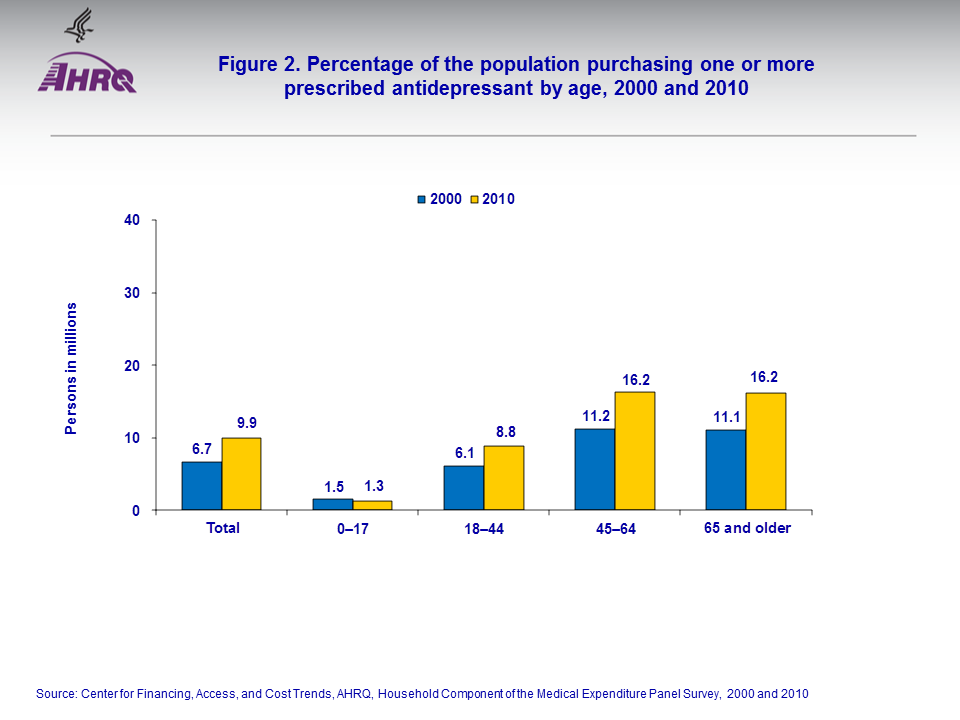
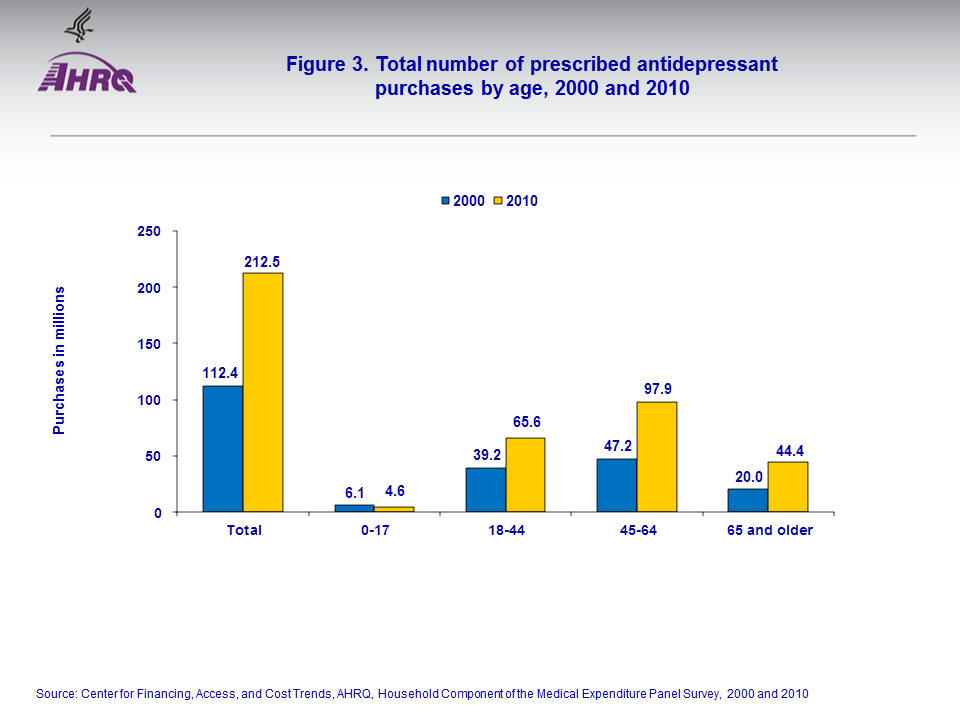
Comparing 2000 with 2010, MEPS estimates showed an increase in the total number of people (as well as the proportion of the population) ages 18–44, 45–64, and 65 and older in the U.S. civilian noninstitutionalized population purchasing one or more antidepressant. The number of persons ages 18–44 obtaining at least one antidepressant rose from 6.6 million (6.1 percent of the 109.0 million people ages 18–44 in the 2000 total population) to 9.8 million people (8.8 percent of the 111.1 million people ages 18–44 in the 2010 total population)—a 48.5 percent increase; the number of persons ages 45–64 purchasing at least one antidepressant rose from 6.9 million (11.2 percent of the 62.1 million people ages 45–64 in the 2000 total population) to 13.2 million people (16.2 percent of the 81.5 million people ages 45–64 in the 2010 total population)—a 91.3 percent increase; and the number of persons age 65 and older purchasing at least one antidepressant rose from 3.9 million (11.1 percent of the 34.8 million people age 65 and older in the 2000 total population) to 6.7 million people (16.2 percent of the 41.2 million people age 65 and older in the 2010 total population)—a 71.8 percent increase. There was no significant change in the total number of people ages 0–17 purchasing one or more antidepressant when comparing 2000 and 2010 (figures 1 and 2).From 2000 to 2010, MEPS estimates showed growth in the total number of prescription purchases of antidepressants for persons ages 18–44 (an increase of 67.3 percent, rising from 39.2 million to 65.6 million purchases), 45–64 (an increase of 107.4 percent, rising from 47.2 million to 97.9 million purchases) and those age 65 and older (an increase of 122.0 percent, rising from 20.0 million to 44.4 million purchases). Purchases of antidepressants for persons ages 0–17 did not change significantly when comparing 2000 and 2010 (figure 3).
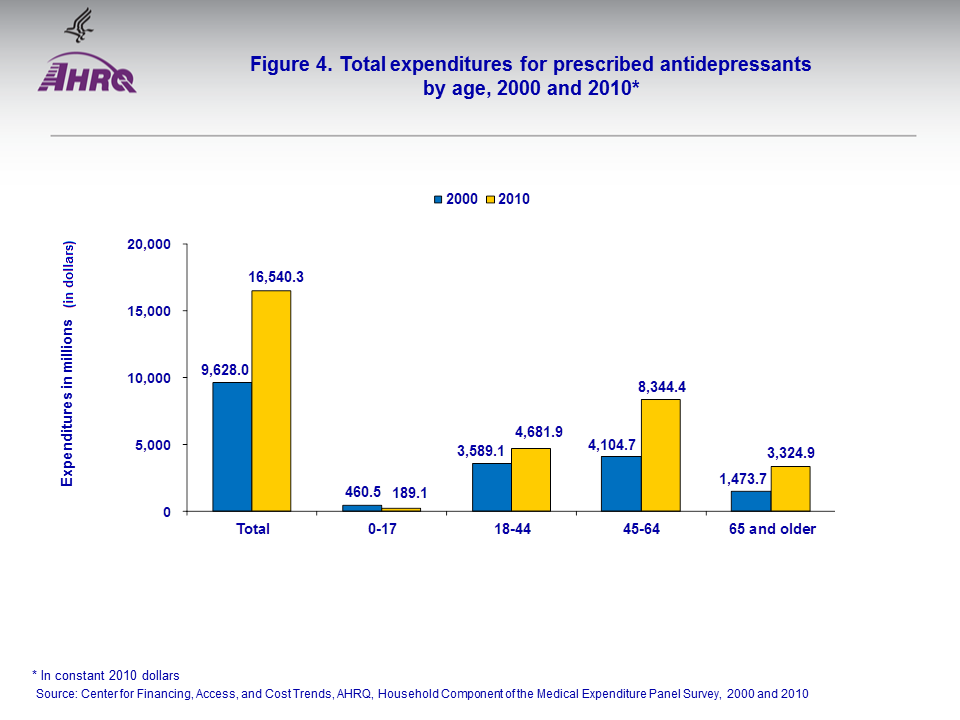
For persons ages 18–44, 45–64, and those age 65 and older there were increases of 30.4, 103.3, and 125.6 percent in total inflation adjusted expenditures for antidepressants, respectively ($3,589.1 million versus $4,681.9 million, $4,104.7 million versus $8,344.4 million and $1,473.7 versus $3,324.9 million). However, there was a decrease of 58.9 percent in total inflation adjusted expenditures for antidepressants for those ages 0–17 (falling from $460.5 million to $189.1 million) when comparing the years 2000 and 2010 (figure 4).
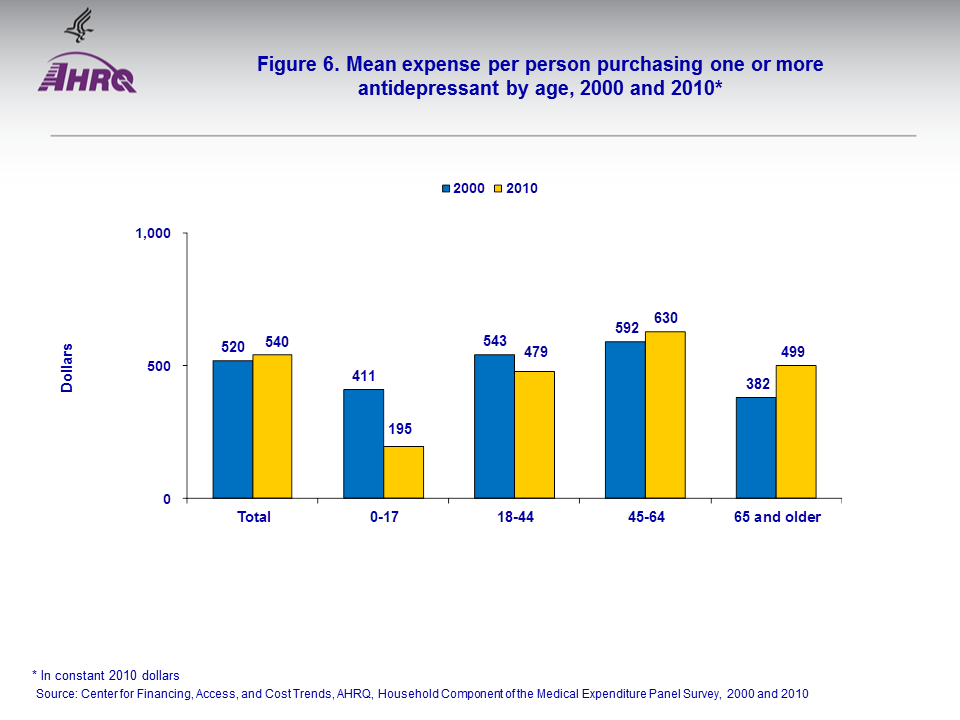
From 2000 to 2010, MEPS estimates showed no significant difference in the inflation adjusted average annual expense per person for antidepressants for those ages 18–44 and 45–64. However, for persons ages 0–17, the inflation adjusted average annual expense per person decreased ($411 versus $195) and for persons age 65 and older, the average annual expense per person increased ($382 versus $499) (figure 6).
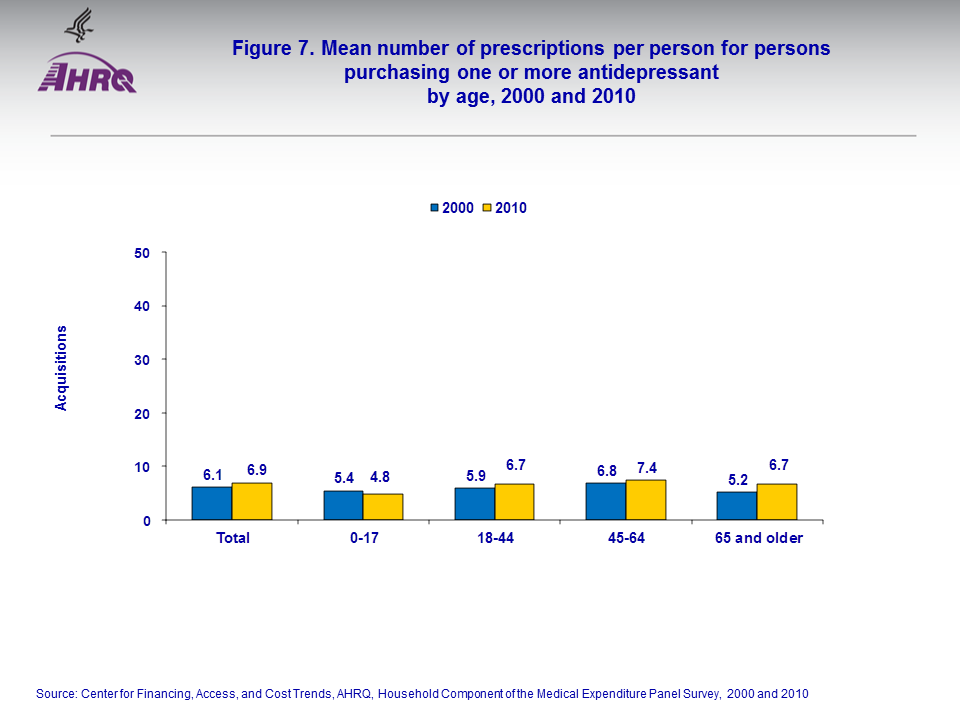
There was an increase in the mean number of antidepressants obtained annually per person for persons ages 18–44 (5.9 versus 6.7), 45–64 (6.8 versus 7.4), and 65 and older (5.2 versus 6.7) when comparing 2000 to 2010. For those persons ages 0–17, there was no significant change (figure 7).
Data Source
The estimates shown in this Statistical Brief are based on data from MEPS: HC-068: Multum Lexicon Addendum Files to MEPS Prescribed Medicines Files 1996–2001; HC-051A: 2000 Prescribed Medicines File; HC-135A: 2010 Prescribed Medicines File; HC-138: 2010 Full Year Consolidated Data File; and HC-050: 2000 Full Year Consolidated Data File.Definitions
Purchases and expendituresUtilization was defined as purchasing or obtaining antidepressants in the year of interest. Refills as well as original prescriptions are included in expenditure and utilization estimates. Expenditures include the total direct payments from all sources to pharmacies for prescriptions reported by respondents in the MEPS-HC. Expenditures are in real dollars; estimates for 2000 were adjusted to 2010 dollars based on the GDP Price Index (http://www.meps.ahrq.gov/mepsweb/about_meps/Price_Index.shtml).
Therapeutic classifications
Therapeutic class and subclass were assigned to MEPS prescribed medicines using Multum Lexicon variables from Cerner Multum, Inc. MEPS prescribed medicines files were linked to the Multum Lexicon database to obtain therapeutic class and subclass variables. The following was used to define antidepressants in 2000 and 2010—therapeutic class: psychotherapeutic agents; subclass: antidepressants. For additional information on these and other Multum Lexicon variables, please refer to the Multum Web site.
When looking at trends over time for therapeutic subclass and sub therapeutic subclasses, it is important to keep in mind many factors can play a role. These factors include: 1) drugs are reclassified due to changes in the Multum therapeutic classification scheme, 2) new drugs become available over time, and 3) generic versions of previously brand name only drugs become available.
About MEPS-HC
MEPS-HC is a nationally representative longitudinal survey that collects detailed information on health care utilization and expenditures, health insurance, and health status, as well as a wide variety of social, demographic, and economic characteristics for the U.S. civilian noninstitutionalized population. It is cosponsored by the Agency for Healthcare Research and Quality and the National Center for Health Statistics.MEPS expenditure data are derived from both the Medical Provider Component (MPC) and Household Component (HC). MPC data are generally used for hospital-based events (e.g., inpatient stays, emergency room visits, and outpatient department visits), prescribed medicine purchases, and home health agency care. Office based physician care estimates use a mix of HC and MPC data while estimates for non-physician office visits, dental and vision services, other medical equipment and services, and independent provider home health care services are based on HC provided data. Details on the estimation process can be found in Machlin, S.R. and Dougherty, D.D. Overview of Methodology for Imputing Missing Expenditure Data in the Medical Expenditure Panel Survey. Methodology Report No. 19. March 2007. Agency for Healthcare Research and Quality, Rockville, MD. http://www.meps.ahrq.gov/mepsweb/data_files/publications/mr19/mr19.shtml
For more information about MEPS, call the MEPS information coordinator at AHRQ (301) 427-1656 or visit the MEPS Web site at http://www.meps.ahrq.gov/.
References
For a detailed description of the MEPS-HC survey design, sample design, and methods used to minimize sources of nonsampling error, see the following publications:Cohen, J. Design and Methods of the Medical Expenditure Panel Survey Household Component. MEPS Methodology Report No. 1. AHCPR Pub. No. 97-0026. Rockville, MD. Agency for Health Care Policy and Research, 2001. http://www.meps.ahrq.gov/mepsweb/data_files/publications/mr1/mr1.shtml
Cohen, S. Sample Design of the 1996 Medical Expenditure Panel Survey Household Component. MEPS Methodology Report No. 2. AHCPR Pub. No. 97-0027. Rockville, MD. Agency for Health Care Policy and Research, 2001. http://www.meps.ahrq.gov/mepsweb/data_files/publications/mr2/mr2.shtml
Cohen, S. Design Strategies and Innovations in the Medical Expenditure Panel Survey. Medical Care, July 2003: 41(7) Supplement: III-5–III-12.
Ezzati-Rice, T.M., Rohde, F., Greenblatt, J. Sample Design of the Medical Expenditure Panel Survey Household Component, 1998–2008. Methodology Report No. 22. March 2008. Agency for Healthcare Research and Quality, Rockville, MD. http://www.meps.ahrq.gov/mepsweb/data_files/publications/mr22/mr22.shtml
Suggested Citation
Stagnitti, M.N. Trends in Antidepressant Utilization and Expenditures in the U.S. Civilian Noninstitutionalized Population By Age, 2000 and 2010. Statistical Brief #430. February 2014. Agency for Healthcare Research and Quality, Rockville, MD. http://meps.ahrq.gov/mepsweb/data_files/publications/st430/stat430.shtmlAHRQ welcomes questions and comments from readers of this publication who are interested in obtaining more information about access, cost, use, financing, and quality of health care in the United States. We also invite you to tell us how you are using this Statistical Brief and other MEPS data and tools and to share suggestions on how MEPS products might be enhanced to further meet your needs. Please email us at MEPSProjectDirector@ahrq.hhs.gov or send a letter to the address below:
Steven B. Cohen, PhD, Director
Center for Financing, Access, and Cost Trends
Agency for Healthcare Research and Quality
540 Gaither Road
Rockville, MD 20850
 |
||||||||||||||||||||||||
|
||||||||||||||||||||||||
|
|
||||||||||||||||||||||||
 |
||||||||||||||||||||||||
|
||||||||||||||||||||||||
|
|
||||||||||||||||||||||||
 |
||||||||||||||||||||||||
|
||||||||||||||||||||||||
|
|
||||||||||||||||||||||||
 |
||||||||||||||||||||||||
|
||||||||||||||||||||||||
|
|
||||||||||||||||||||||||
 |
||||||||||||||||||||||||
|
||||||||||||||||||||||||
|
|
||||||||||||||||||||||||
 |
||||||||||||||||||||||||
|
||||||||||||||||||||||||
|
|
||||||||||||||||||||||||
 |
||||||||||||||||||||||||
|
||||||||||||||||||||||||
|
|
||||||||||||||||||||||||