
|
|
|
Font Size:
|
||||
|
|
|
|
||||
STATISTICAL BRIEF #452:
Employees in Smaller Private-Sector Firms: Trends in Offers, Enrollment Rates, and Deductibles, by Firm Size, 2008-2013
Highlights
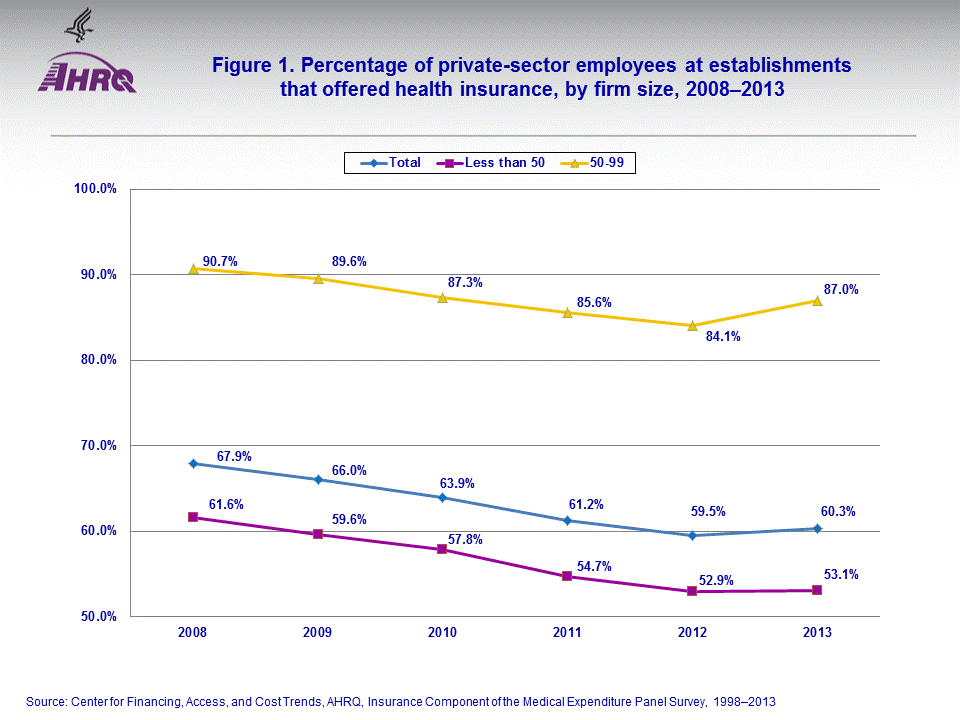
- The percentage of employees that worked for a private-sector employer, with fewer than 100 employees, offering health insurance was 67.9 percent in 2008 and fell to 60.3 percent in 2013. Small-firm employees (those with fewer than 50 employees) were much less likely to work where health insurance was offered than employees of firms with 50 to 99 employees.
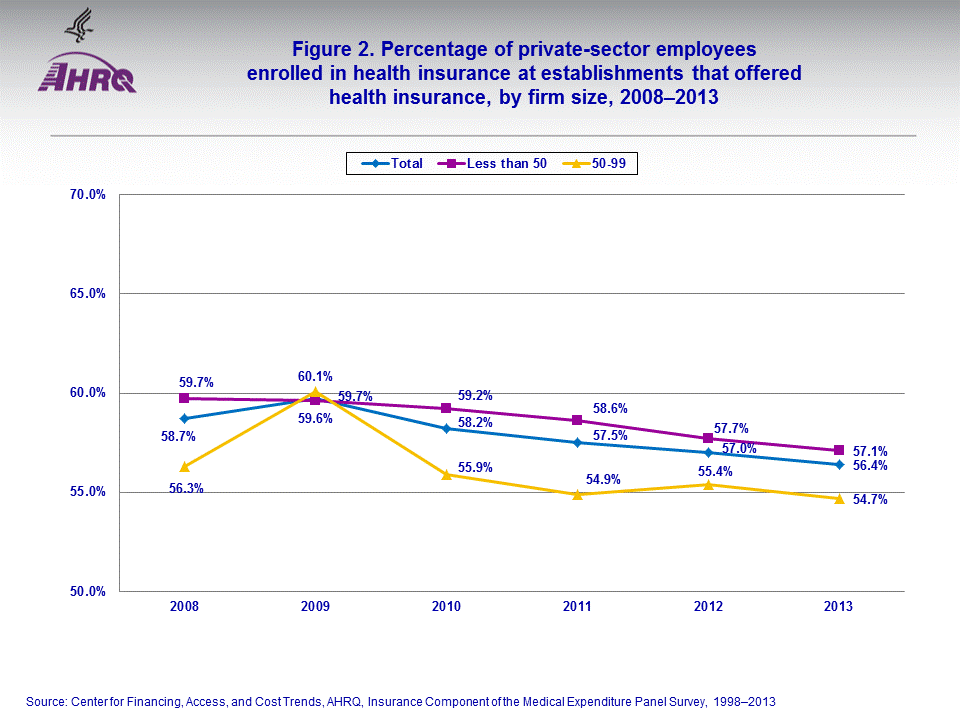
- During 2008 to 2013, with the exception of 2009, the percentage of employees enrolled in health insurance in small firms that offered insurance exceeded the enrollees of firms with 50 to 99 employees in each year.
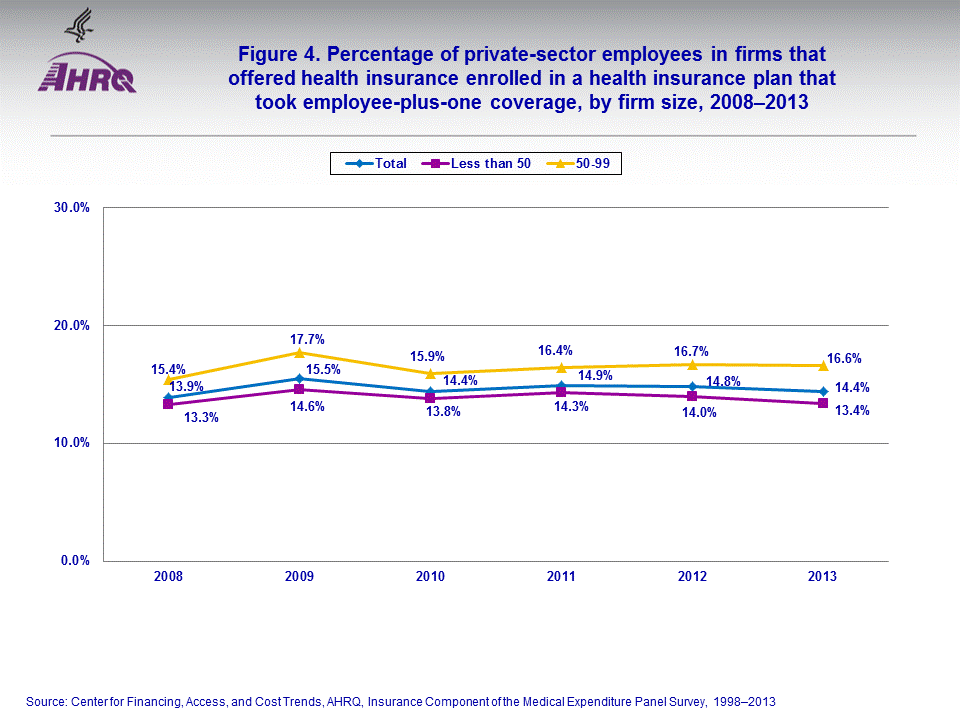
- In each year, from 2008-2013, employees in firms that offered coverage with 50-99 employees were more likely to enroll in employee-plus-one coverage than employees in small firms.
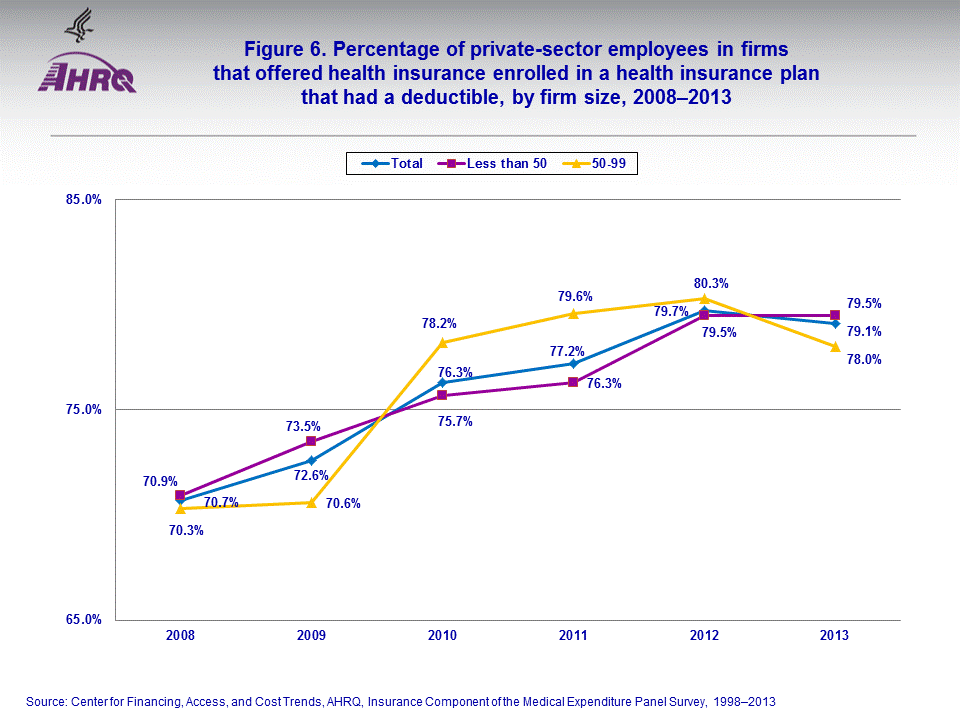
- For employees of small firms that offered coverage, the percentage that had a deductible increased from 70.9 percent in 2008 to 79.5 percent in 2013.
Introduction
Employer-sponsored health insurance for current workers is one of the primary sources of health insurance coverage in the United States. According to data from the Insurance Component of the 2013 Medical Expenditure Panel Survey (MEPS-IC), approximately 39.6 million of the 113.9 million private-sector employees worked in firms with fewer than 100 employees. Of those employees who worked for employers with fewer than 100 employees where health insurance was offered, approximately 16.7 million were enrolled (data not shown).This Statistical Brief provides estimates on private employers for firms with fewer than 100 employees prior to implementation of the Employer Shared Responsibility provision of the Patient Protection and Affordable Care Act. It examines trend estimates by firm size on the percentage of employees offered health insurance, enrollment rates, and percentage with a deductible from 2008 to 2013. Only those estimates that had a statistically significant difference from the national average at the 0.05 percent significance level are noted in the text.
Findings
Among the 113.9 million employees who worked for private-sector employers in 2013, 34.8 percent worked for firms with fewer than 100 employees that offered health insurance, and 16.7 million enrolled (estimates not shown in figures). The percentage of employees that worked for a private-sector employer in firms with fewer than 100 employees offering health insurance was 67.9 percent in 2008 and fell to 60.3 percent in 2013 (figure 1). Small-firm employees (those in firms with fewer than 50 employees) were much less likely to work where health insurance was offered than employees of firms with 50 to 99 employees. The percentage of small-firm employees working for employers who offered health insurance fell during 2008 to 2013 from 61.6 percent to 53.1 percent, while employees in firms with 50 to 99 employees offering insurance fell from 90.7 percent to 87.0 percent.During 2008 to 2013, the percentage of employees in private-sector establishments in firms with fewer than 100 employees enrolled in employer-sponsored coverage was 58.7 percent in 2008 and fell to 56.4 percent in 2013 (figure 2). With the exception of 2009, the percentage of employees enrolled in small firms exceeded the enrollees of firms with 50 to 99 employees in each year. The percentage of enrollees at small firms decreased slightly, from 59.7 percent to 57.1 percent during this period. This slight decrease in percentage enrolled also occurred in firms with 50 to 99 employees (from 56.3 percent to 54.7 percent).
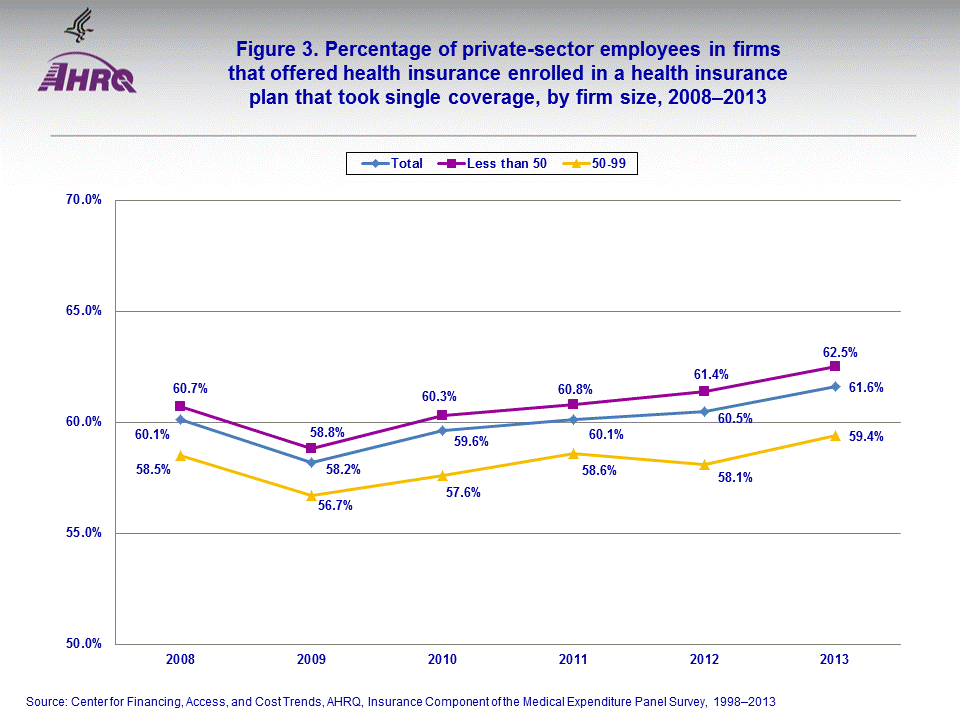
From 2008 to 2013, the percentage of private-sector employees in small firms who enrolled in a health insurance plan that took single coverage increased slightly from 60.7 percent to 62.5 percent during this period (figure 3). There was no significant difference in the percentage of employees enrolled in single coverage in firms with fewer than 100 employees during this period or for firms with 50 to 99 employees during this period.
In each year, from 2008–2013, employees in firms that offered health insurance with 50–99 employees were more likely to enroll in employee-plus-one coverage than employees in small firms (figure 4). The percentage of private-sector employees enrolled in health insurance that took employee-plus-one coverage who worked in small firms (13.3 percent in 2008) remained unchanged during this period. There was no significant difference in the percentage of enrollees who took employee-plus-one coverage in firms with fewer than 100 employees during this period or for firms with 50 to 99 employees during this period.
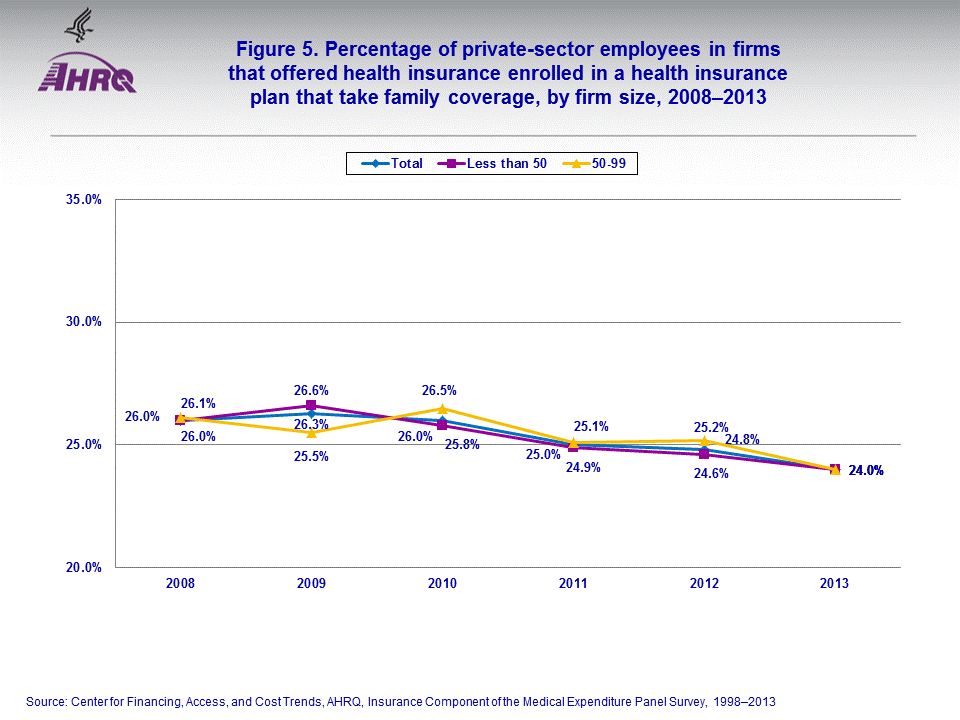
For employees in firms that offered health insurance, the percentage of employees enrolled in family coverage was about 25.0 percent during the entire period from 2008 to 2013 (figure 5). There was no significant difference by firm size in the percentage of enrollees who took family coverage.
Deductibles
The percentage of employees in private-sector establishments in firms with fewer than 100 employees that had a deductible increased from 70.7 percent in 2008 to 79.1 percent in 2013 (figure 6). For employees of small firms, the percentage that had a deductible increased from 70.9 percent to 79.5 percent. This increase also occurred for employees at firms with 50 to 99 employees (from 70.3 percent to 78.0 percent).
Data Source
This Statistical Brief summarizes data from the 2008 through 2013 MEPS-IC. The data are available on the MEPS Web site at http://www.meps.ahrq.gov/mepsweb/survey_comp/Insurance.jsp or have been produced using special computation runs on the confidential MEPS-IC data available at the U.S. Census Bureau.Definitions
DeductibleA fixed dollar amount during the benefit period—usually a year—that an insured person pays before the insurer starts to make payments for covered medical services. Plans may have both per individual and family deductibles. Some plans may have separate deductibles for specific services. For example, a plan may have a hospitalization deductible per admission. Deductibles may differ if services are received from an approved provider or if received from providers not on the approved list.
Employee-plus-one coverage
Health insurance that covers the employee and one other family member at a lower premium level than family coverage. For the MEPS IC survey, if premiums are different for employee-plus-spouse and employee-plus-child coverage, the costs for employee-plus-child coverage are collected.
Family coverage
Health insurance that covers the employee and one or more members of his/her immediate family (spouse and/or children as defined by the plan). For the MEPS-IC survey, "family coverage" is any coverage other than single and employee-plus-one. Some plans offer more than one rate for family coverage, depending on family size and composition. If more than one rate is offered, survey respondents are asked to report costs for a family of four.
Single coverage
Health insurance that covers the employee only. This is also known as employee-only coverage.
About MEPS-IC
The MEPS-IC is a survey of business establishments and governments that collects information on employer-sponsored health insurance, such as whether insurance is offered, enrollments, types of plans, and premiums. The survey is conducted annually by the U.S. Census Bureau under the sponsorship of the Agency for Healthcare Research and Quality (AHRQ). A total sample of approximately 42,000 private-sector establishments was selected for the 2013 survey; with 6.7 percent of the sample determined to be out-of-scope during the data collection process. The response rate for the private sector was 74.6 percent of the remaining in-scope sample units.For more information on this survey, see MEPS Methodology Reports 6, 8, 10, 14, 17, 18, 27, and 28; and the MEPS-IC Technical Notes and Survey Documentation, which are available on the MEPS Web site (http://www.meps.ahrq.gov).
References
U.S. Department of Health and Human Services. The Employer Shared Responsibility Payment. https://www.healthcare.gov/what-is-the-employer-shared-responsibility-payment/Suggested Citation
Davis, K. Employees in Smaller Private-Sector Firms: Trends in Offers, Enrollment Rates, and Deductibles, by Firm Size, 2008–2013, Statistical Brief #452. October 2014. Agency for Healthcare Research and Quality, Rockville, MD. http://www.meps.ahrq.gov/mepsweb/data_files/publications/st452/stat452.shtmlAHRQ welcomes questions and comments from readers of this publication who are interested in obtaining more information about access, cost, use, financing, and quality of health care in the United States. We also invite you to tell us how you are using this Statistical Brief and other MEPS data and tools and to share suggestions on how MEPS products might be enhanced to further meet your needs. Please email us at MEPSProjectDirector@ahrq.hhs.gov or send a letter to the address below:
Steve B. Cohen, PhD, Director
Center for Financing, Access, and Cost Trends
Agency for Healthcare Research and Quality
540 Gaither Road
Rockville, MD 20850
 |
|||||||||||||||||||||||||||||||||||
|
|||||||||||||||||||||||||||||||||||
|
|
|||||||||||||||||||||||||||||||||||
 |
|||||||||||||||||||||||||||||||||||
|
|||||||||||||||||||||||||||||||||||
|
|
|||||||||||||||||||||||||||||||||||
 |
|||||||||||||||||||||||||||||||||||
|
|||||||||||||||||||||||||||||||||||
|
|
|||||||||||||||||||||||||||||||||||
 |
|||||||||||||||||||||||||||||||||||
|
|||||||||||||||||||||||||||||||||||
|
|
|||||||||||||||||||||||||||||||||||
 |
|||||||||||||||||||||||||||||||||||
|
|||||||||||||||||||||||||||||||||||
|
|
|||||||||||||||||||||||||||||||||||
 |
|||||||||||||||||||||||||||||||||||
|
|||||||||||||||||||||||||||||||||||
|
|
|||||||||||||||||||||||||||||||||||