
|
|
|
Font Size:
|
||||
|
|
|
|
||||
STATISTICAL BRIEF #481:
The Concentration and Persistence in the Level of Health Expenditures over Time: Estimates for the U.S. Population, 2012-2013
Highlights
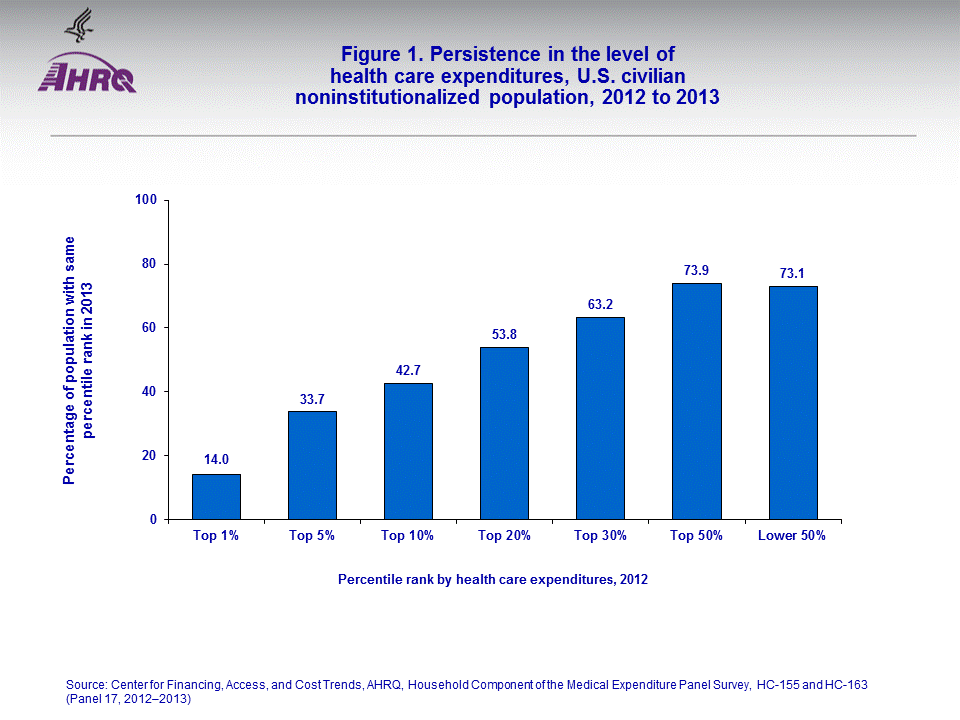
- In 2012, 1 percent of the population accounted for 22.7 percent of total health care expenditures and 14.0 percent of the population in the top 1 percent retained this ranking in 2012. The bottom half of the expenditure distribution accounted for 2.7 percent of spending in 2012; about three out of four individuals in the bottom 50 percent retained this ranking in 2013.
- Those who were in the top decile of spenders in both 2012 and 2013 differed by age, race/ethnicity, sex, health status, and insurance coverage (for those under 65) from those who were in the lower half in both years.
- Those in the bottom half of health care spenders both years were more likely to report excellent health status, while those in the top decile of spenders in both years were more likely to be in fair or poor health relative to the overall population.
- While 15.0 percent of persons under age 65 were uninsured for all of 2012, the full year uninsured comprised 25.5 percent of those in the bottom half of spenders for both 2012 and 2013. Only 2.2 percent of those under age 65 who remained in the top decile of spenders in both years were uninsured for all of 2013.
- Relative to the overall population, those who remained in the top decile of spenders were more likely to be in fair or poor health, elderly, non-Hispanic whites and those with public only coverage. Those who remained in the bottom half of spenders were more likely to be in excellent health, children and young adults, Hispanics, and uninsured.
Introduction
Estimates of health care expenses for the U.S. civilian noninstitutionalized (community) population are critical to policymakers and others concerned with access to medical care and the cost and sources of payment for that care. In 2013, health care expenses among the U.S. community population totaled $1.40 trillion. Medical care expenses, however, are highly concentrated among a relatively small proportion of individuals in the community population. As previously reported in 1996, the top 1 percent of the U.S. population accounted for 28 percent of the total health care expenditures and the top 5 percent for more than half. More recent data have revealed that over time there has been some decrease in the extent of this concentration at the upper tail of the expenditure distribution (Yu and Ezzati-Rice, 2005).Using information from the Household Component of the Medical Expenditure Panel Survey (MEPS-HC) for 2012 and 2013, this report provides detailed estimates of the persistence in the level of health care expenditures over time. Studies that examine the persistence of high levels of expenditures over time are essential to help discern the factors most likely to drive health care spending and the characteristics of the individuals who incur that spending. The MEPS-HC data are particularly well suited for measuring trends in concentration and persistence. All differences between estimates discussed in the text are statistically significant at the 0.05 level unless otherwise noted.
Findings
In 2012, 1 percent of the population accounted for 22.7 percent of total health care expenditures, and in 2013, the top 1 percent accounted for 21.5 percent of total expenditures with an annual mean expenditure of $95,200. The lower 50 percent of the population ranked by their expenditures accounted for only 2.7 percent and 2.9 percent of the total for 2012 and 2013 respectively. Of those individuals ranked at the top 1 percent of the health care expenditure distribution in 2012 (with a mean expenditure of $97,956), 14.0 percent maintained this ranking with respect to their 2013 health care expenditures (figure 1).In both 2012 and 2013, the top 5 percent of the population accounted for nearly 50 percent of health care expenditures. Among those individuals ranked in the top 5 percent of the health care expenditure distribution in 2012 (with a mean expenditure of $43,058 (data not shown), 33.7 percent retained this ranking with respect to their 2013 health care expenditures (figure 1). Similarly, the top 10 percent of the population accounted for 66.0 percent of overall health care expenditures in 2012 (with a mean expenditure of $28,468, data not shown), and 42.7 percent of this subgroup retained this top decile ranking with respect to their 2013 health care expenditures. In addition, a small percentage of the individuals in the top percentiles in 2012 had expenditures for only one year because they died, were institutionalized, or were otherwise ineligible for the survey in the subsequent year.
Given the high concentration of medical expenditures incurred by the top decile of the population ranked by health care spending (65 percent in 2013), identifying the characteristics of those individuals exhibiting significant reductions in health care spending in a subsequent year is also of interest. Among those ranked in the top decile in 2012 based on their high level of medical expenditures, 27.9 percent shifted to a ranking in the lower 75 percent of the expenditure distribution in 2013 (data not shown). Individuals ranked in the lower 75 percent of health care spending accounted for only 14.6 percent of all medical expenditures in 2013.
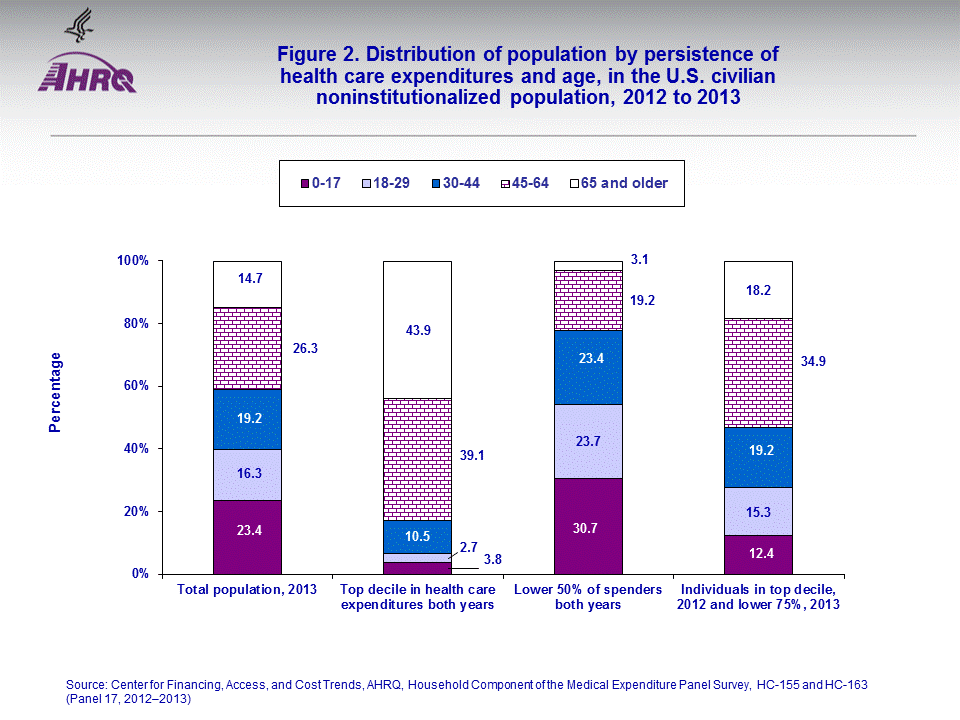
Individuals who were between the ages of 45 and 64 and the elderly (65 and older) were disproportionately represented among the population that remained in the top decile of spenders for both 2012 and 2013. While the elderly represented 14.7 percent of the overall population in 2013, they represented 43.9 percent of those individuals who remained in the top decile of spenders (figure 2). For those individuals who remained in the lower half of the distribution based on health care expenditures over the two-year span, the elderly represented only 3.1 percent of the population. Alternatively, children (0–17) and young adults (18–29) were disproportionately represented among the population that remained in the bottom half of spenders (30.7 percent and 23.7 percent, respectively). In contrast, children and young adults represented only 3.8 percent and 2.7 percent, respectively, of those individuals who remained in the top decile of spenders. Individuals in the top decile ordered by medical expenditures in 2012 that shifted below the first quartile in 2013 were disproportionately between the ages of 45–64.
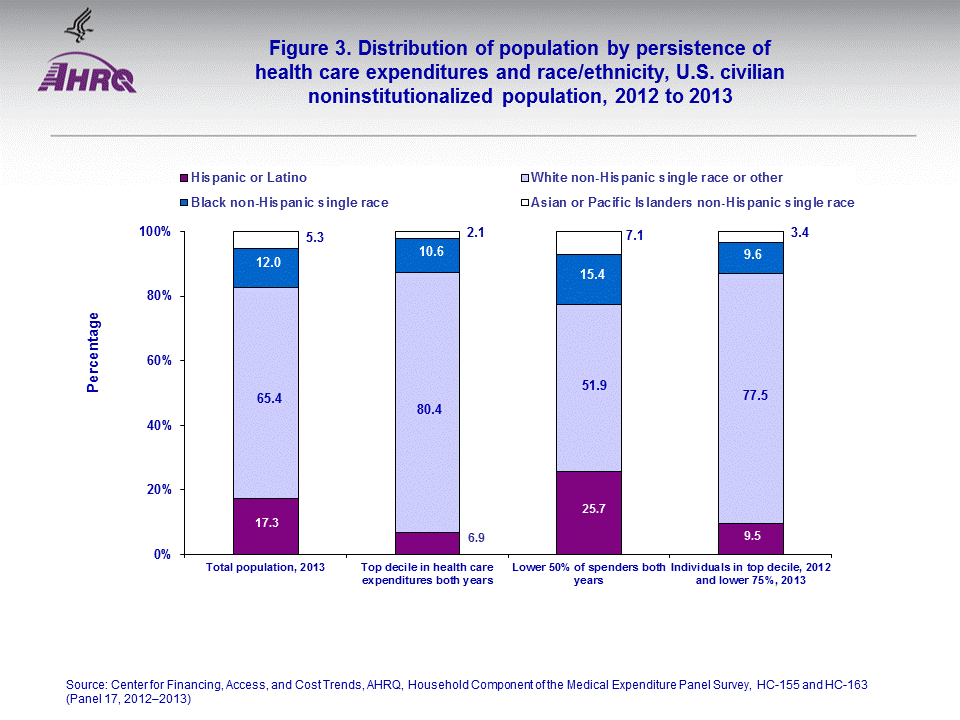
Individuals identified as Hispanics and black non-Hispanic single race were disproportionately represented among the population that remained in the lower half of the distribution based on health care spending. While Hispanics represented 17.3 percent of the overall population in 2013, they represented 25.7 percent of those individuals who remained in the bottom 50 percent of spenders (figure 3). For those individuals who remained in the top decile of spenders, Hispanics represented only 6.9 percent of the population. Individuals in the top decile ordered by medical expenditures in 2012 that shifted below the first quartile in 2013 were most likely to be non-Hispanic whites and other races (77.5 percent).
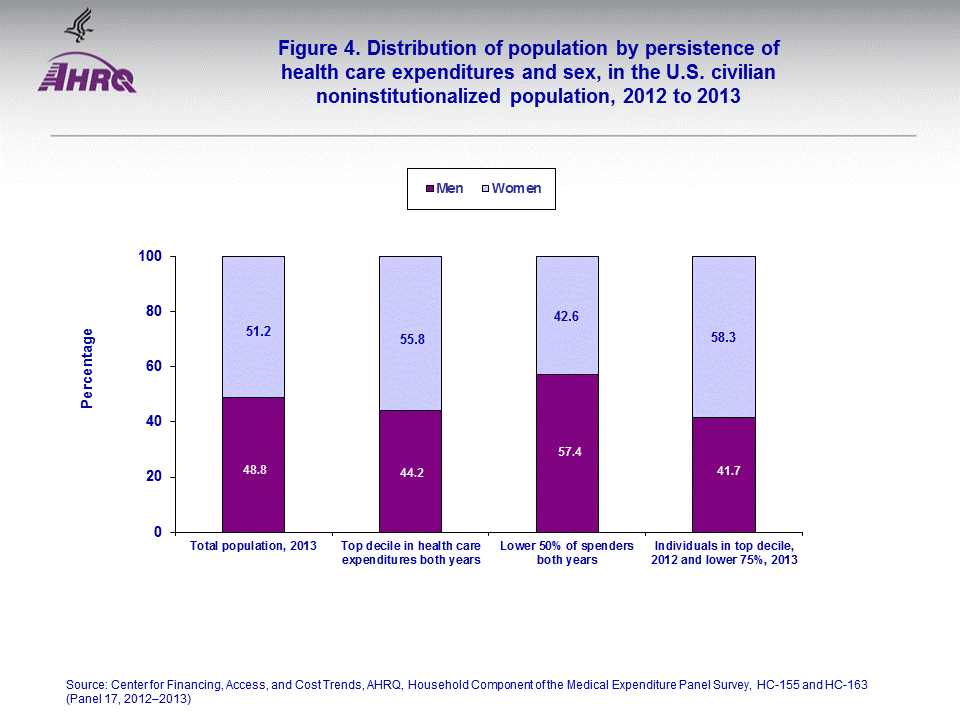
Individuals who remained in the top decile of spenders in 2012 and 2013 also differed significantly by sex, compared with those who remained in the lower half of the distribution ranked by medical care expenditures. Women represented 55.8 percent of individuals who remained in the top decile of spenders, while for those individuals who remained in the lower half of the distribution based on health care expenditures over the two-year span, women represented only 42.6 percent of the population (figure 4). Alternatively, men were disproportionately represented among the population that remained in the bottom half of spenders (57.4 percent). In contrast, men represented only 44.2 percent of those individuals who remained in the top decile of spenders. Individuals in the top decile ordered by medical expenditures in 2012 that shifted below the first quartile in 2013 were predominantly female (58.3 percent).
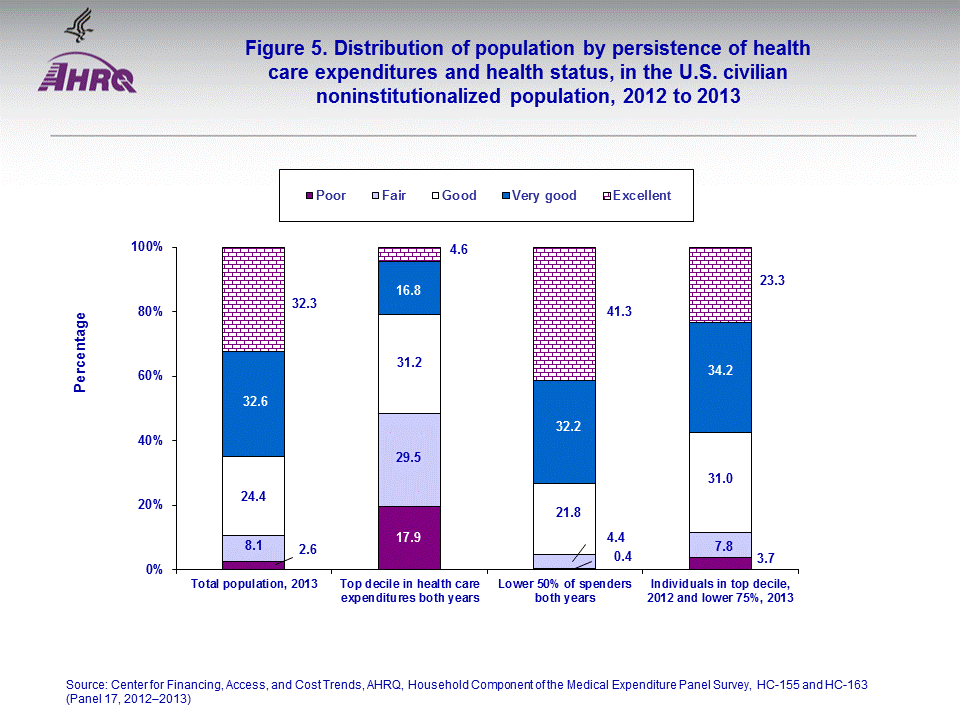
Health status was a particularly salient factor that distinguished those individuals who remained in the top decile of spenders. Overall, 2.6 percent of the population was reported to be in poor health in 2013, and another 8.1 percent was classified in fair health (figure 5). In contrast, of those individuals who remained in the top decile of spenders, 17.9 percent were in poor health and another 29.5 percent were in fair health. Furthermore, for those individuals remaining in the bottom half of spenders, only 0.4 percent were reported to be in poor health and 4.4 percent in fair health. Individuals in excellent health were disproportionately represented among those who remained in the lower half of spenders both years (41.3 percent). Alternatively, for those individuals remaining in the top decile of spenders, only 4.6 percent were reported to be in excellent health and 16.8 percent in very good health. Individuals in the top decile ordered by medical expenditures in 2012 that shifted below the top quartile in 2013 were predominantly in excellent, very good, or good health (23.3, 34.2, and 31.0 percent, respectively).
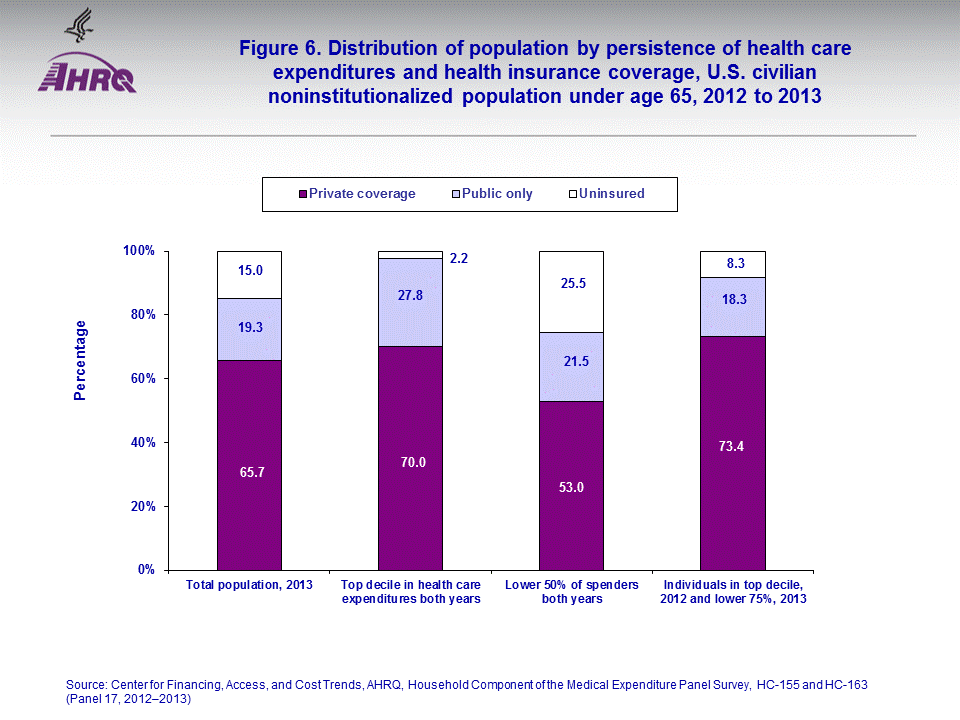
Focusing on the population under age 65, health insurance coverage status also distinguished individuals who remained in the top decile of spenders from their counterparts in the lower half of the distribution. Individuals who were uninsured for all of calendar year 2013 were disproportionately represented among the population that remained in the lower half of the distribution based on health care spending. While 15.0 percent of the overall population under age 65 was uninsured for all of 2013, the full year uninsured comprised 25.5 percent of all individuals remaining in the bottom half of spenders (figure 6). Alternatively, only 2.2 percent of those under age 65 who remained in the top decile of spenders were uninsured. In addition, while 19.3 percent of the overall population under age 65 had public-only coverage for all of 2013, 27.8 percent of those who remained in the top decile of spenders had public-only coverage (figure 6).
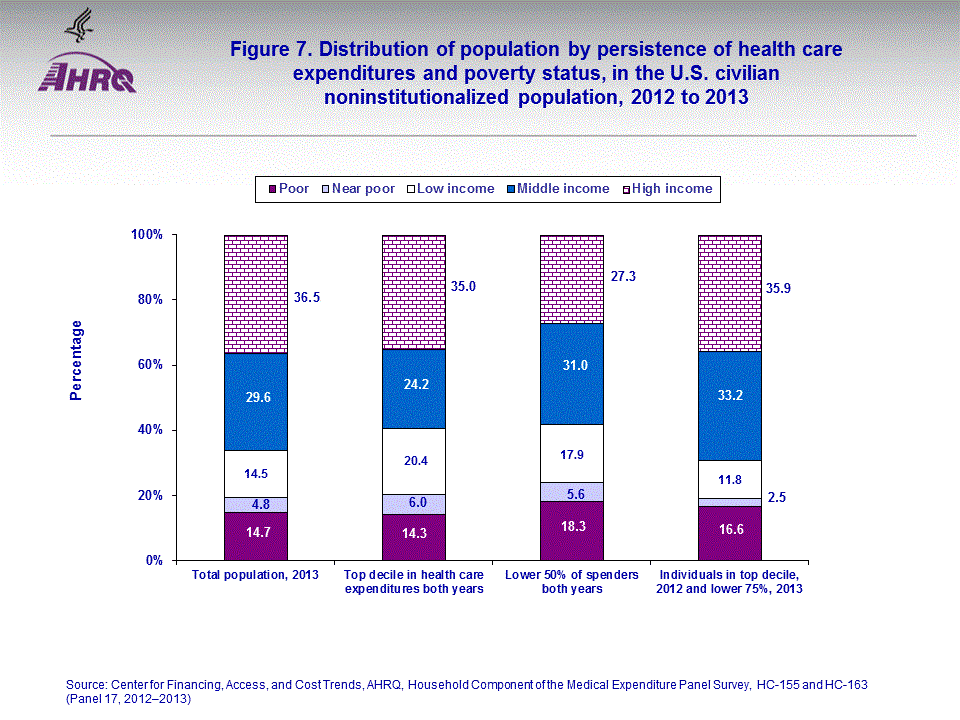
With respect to poverty status classifications, 36.5 percent of the overall population resided in families or single-person households with high incomes in 2012 (figure 7) and 14.7 percent had incomes at or below the poverty threshold. A lower representation of high income individuals (27.3 percent) and a higher representation of the poor (18.3 percent) were observed among those who remained in the lower half of spenders in both 2012 to 2013.
Data Source
The estimates shown in this Statistical Brief are drawn from analyses conducted by the MEPS staff from the following public use files: MEPS HC-155 and HC-163, the 2012 and 2013 Full Year Consolidated Data Files; and the MEPS Panel 17 Longitudinal Data File.Definitions
ExpendituresMEPS-HC defines total expense as the sum of payments from all sources to hospitals, physicians, other health care providers (including dental care), and pharmacies for services reported by respondents in the MEPS-HC. Sources include direct payments from individuals and families, private insurance, Medicare, Medicaid, and miscellaneous other sources.
Uninsured
Individuals who were not covered by any comprehensive private or public health plan during the year were defined as uninsured. People who were covered only by noncomprehensive state-specific programs (e.g., Maryland Kidney Disease Program) or private single-service plans (e.g., coverage for dental or vision care only, coverage for accidents or specific diseases) were also considered to be uninsured. Insurance status was defined for the 2013 calendar year.
Age
Age was defined as age at the end of the year 2013.
Race/ethnicity
Classification by race and ethnicity was based on information reported for each family member. Respondents were asked if each family member's race was best described as American Indian, Alaska Native, Asian or Pacific Islander, black, white, or other. They also were asked if each family member's main national origin or ancestry was Puerto Rican; Cuban; Mexican, Mexicano, Mexican American, or Chicano; other Latin American; or other Spanish. All persons whose main national origin or ancestry was reported in one of these Hispanic groups, regardless of racial background, were classified as Hispanic. Since the Hispanic grouping can include black Hispanic, white Hispanic, Asian and Pacific Islanders Hispanic, and other Hispanic, the race categories of black, white, Asian and Pacific Islanders, and other only include non-Hispanics for the race/ethnicity classifications. MEPS respondents who reported other single or multiple races and were non-Hispanic were included in the other category. For this analysis, the following classification by race and ethnicity was used: Hispanic (of any race), non-Hispanic blacks single race, non-Hispanic whites single race, and others, and non-Hispanic Asian and Pacific Islanders single race.
Poverty status
Sample persons were classified according to the total yearly income of their family. Within a household, all people related by blood, marriage, or adoption were considered to be a family. Poverty status categories are defined by the ratio of family income to the Federal income thresholds, which control for family size and age of the head of family. Poverty status was based on annual income in 2013.
Poverty status categories are defined as follows:
- Poor: Persons in families with income less than or equal to the poverty line; includes those who had negative income.
- Near poor: Persons in families with income over the poverty line through 125 percent of the poverty line.
- Low income: Persons in families with income over 125 percent through 200 percent of the poverty line.
- Middle income: Persons in families with income over 200 percent through 400 percent of the poverty line.
- High income: Persons in families with income over 400 percent of the poverty line.
In every round, the respondent is asked to rate the health of every member of the family. The exact wording of the question is: "In general, compared to other people of (PERSON)'s age, would you say that (PERSON)'s health is excellent, very good, good, fair, or poor?" The health status classification in Round 3 was used for this report, and the small percentage of missing (~1 percent) responses were classified in the good health status category.
About MEPS-HC
MEPS-HC is a nationally representative longitudinal survey that collects detailed information on health care utilization and expenditures, health insurance, and health status, as well as a wide variety of social, demographic, and economic characteristics for the U.S. civilian noninstitutionalized population. It is cosponsored by the Agency for Healthcare Research and Quality and the National Center for Health Statistics.For more information about MEPS, call the MEPS information coordinator at AHRQ (301-427-1406) or visit the MEPS Web site at http://www.meps.ahrq.gov/.
References
Cohen, J. Design and Methods of the Medical Expenditure Panel Survey Household Component. MEPS Methodology Report No. 1. AHCPR Pub. No. 97-0026. Rockville, MD: Agency for Health Care Policy and Research, 1997. http://www.meps.ahrq.gov/mepsweb/data_files/publications/mr1/mr1.shtmlCohen, S. Design Strategies and Innovations in the Medical Expenditure Panel Survey. Medical Care, July 2003: 41(7) Supplement: III-5–III-12.
Cohen, S. The Concentration and Persistence in the Level of Health Expenditures over Time: Estimates for the U.S. Population, 2011–2012. Statistical Brief #449. September 2014. Agency for Healthcare Research and Quality, Rockville, MD. http://www.meps.ahrq.gov/mepsweb/data_files/publications/st449/stat449.shtml
Cohen, S. and Yu, W. The Concentration and Persistence in the Level of Health Expenditures over Time: Estimates for the U.S. Population, 2009–2010. Statistical Brief #392. November 2012. Agency for Healthcare Research and Quality, Rockville, MD. http://www.meps.ahrq.gov/mepsweb/data_files/publications/st392/stat392.shtml
Ezzati-Rice, T.M., Rohde, F. Greenblatt, J. Sample Design of the Medical Expenditure Panel Survey Household Component, 1998–2007. Methodology Report No. 22. March 2008. Agency for Healthcare Research and Quality, Rockville, MD. http://www.meps.ahrq.gov/mepsweb/data_files/publications/mr22/mr22.shtml
Yu, W. and Ezzati-Rice, T. Concentration of Health Care Expenditures in the U.S. Civilian Noninstitutionalized Population. Statistical Brief #81. May 2005. Agency for Healthcare Research and Quality, Rockville, MD. http://www.meps.ahrq.gov/mepsweb/data_files/publications/st81/stat81.shtml
Suggested Citation
Cohen, S. The Concentration and Persistence in the Level of Health Expenditures over Time: Estimates for the U.S. Population, 2012–2013. Statistical Brief #481. September 2015. Agency for Healthcare Research and Quality, Rockville, MD. http://www.meps.ahrq.gov/mepsweb/data_files/publications/st481/stat481.shtmlAHRQ welcomes questions and comments from readers of this publication who are interested in obtaining more information about access, cost, use, financing, and quality of health care in the United States. We also invite you to tell us how you are using this Statistical Brief and other MEPS data and tools and to share suggestions on how MEPS products might be enhanced to further meet your needs. Please email us at MEPSProjectDirector@ahrq.hhs.gov or send a letter to the address below:
Steven B. Cohen, PhD, Director
Center for Financing, Access, and Cost Trends
Agency for Healthcare Research and Quality
540 Gaither Road
Rockville, MD 20850
 |
|||||||||||||||||||||||||||||||||||
|
|||||||||||||||||||||||||||||||||||
|
|
|||||||||||||||||||||||||||||||||||
 |
|||||||||||||||||||||||||||||||||||
|
|||||||||||||||||||||||||||||||||||
|
|
|||||||||||||||||||||||||||||||||||
 |
|||||||||||||||||||||||||||||||||||
|
|||||||||||||||||||||||||||||||||||
|
|
|||||||||||||||||||||||||||||||||||
 |
|||||||||||||||||||||||||||||||||||
|
|||||||||||||||||||||||||||||||||||
|
|
|||||||||||||||||||||||||||||||||||
 |
|||||||||||||||||||||||||||||||||||
|
|||||||||||||||||||||||||||||||||||
|
|
|||||||||||||||||||||||||||||||||||
 |
|||||||||||||||||||||||||||||||||||
|
|||||||||||||||||||||||||||||||||||
|
|
|||||||||||||||||||||||||||||||||||
 |
|||||||||||||||||||||||||||||||||||
|
|||||||||||||||||||||||||||||||||||
|
|
|||||||||||||||||||||||||||||||||||