
|
|
|
Font Size:
|
||||
|
|
|
|
||||
STATISTICAL BRIEF #482:
Specialist Need and Access among Adults with Multiple Chronic Conditions, U.S. Civilian Noninstitutionalized Population, 2012
Highlights
- In 2012, approximately 60 percent of the U.S. civilian noninstitutionalized adult population who had multiple chronic conditions (see definitions) reported they or a doctor thought they needed to see a specialist in the past 12 months.
- Among adults with two or more chronic conditions, younger adults were less likely to report that they or a doctor thought that they needed to see a specialist compared to the elderly.
- Among adults with multiple chronic conditions who reported they needed to see a specialist, Hispanics were more likely to report less access to specialists than non-Hispanic blacks or non-Hispanic whites.
- Among nonelderly adults with multiple chronic conditions who reported they needed to see a specialist, uninsured persons reported less access to a specialist than adults with only public insurance or adults with private insurance coverage.
Introduction
Most adults need specialty care at some time in their lives. Many adults with chronic conditions, such as heart disease or diabetes, need to see specialists more frequently than healthier adults. Individuals with multiple chronic conditions have clinical needs that may differentiate them from persons with a single chronic condition (Wolff et al. 2002). Persons with chronic conditions often need physicians with specialized knowledge and expertise in monitoring and treating their specific conditions (Wagner et al. 2001). The ease with which adults with chronic conditions are able to obtain specialist care when needed is one indication of the accessibility of health care for those with greater needs (Beatty et al. 2003; Schoen et al. 2005).In this Brief, a standard classification scheme for multiple chronic conditions is used that was developed by a working group of the Office of the Assistant Secretary for Health (OASH) in the Department of Health and Human Services (HHS). This classification scheme is consistent with the HHS strategic framework on Measuring Chronic Conditions (MCC)1,2. Using MEPS, a person was considered to have multiple chronic conditions if they had two or more treated conditions during the year from the OASH list of 20 conditions.
Using data from the Household Component of the Medical Expenditure Panel Survey (MEPS-HC), this Statistical Brief presents estimates on the perceptions of adults, age 18 and older, with multiple chronic conditions about their need for and access to physician specialists in 2012. The estimates are based on the opinions of the adult U.S. civilian noninstitutionalized population regarding their need to see specialists and how easy it was to access a specialist. All comparisons discussed in the text are statistically significant at the .05 level unless otherwise noted.
Findings
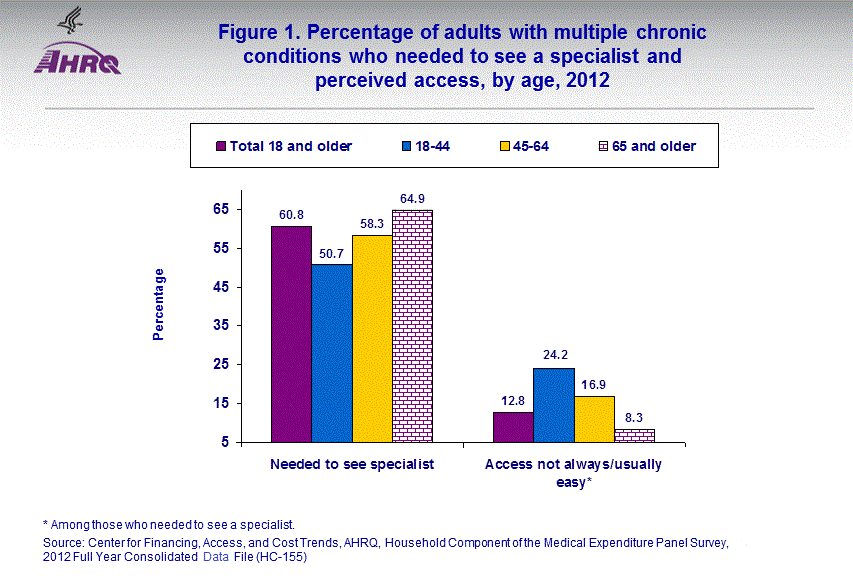
In 2012, about one-quarter of adults (an estimated 60 million persons) were treated for two or more specific chronic conditions (see "Definitions" section). Among those adults treated for multiple chronic conditions, 60.8 percent reported they or a doctor thought they needed to see a specialist (figure 1).Age is correlated with perceived need for and access to specialists (figure 1). Among those with multiple chronic conditions, nearly two-thirds (64.9 percent) of adults age 65 and older needed to see a specialist, compared with 58.3 percent of those ages 45-64 and about half (50.7 percent) of those between the ages of 18 and 44. However, younger adults, ages 18-44 were more likely than the elderly to report that it was not always/usually easy to access a specialist, when needed (24.2 versus 8.3 percent).
Race/ethnicity
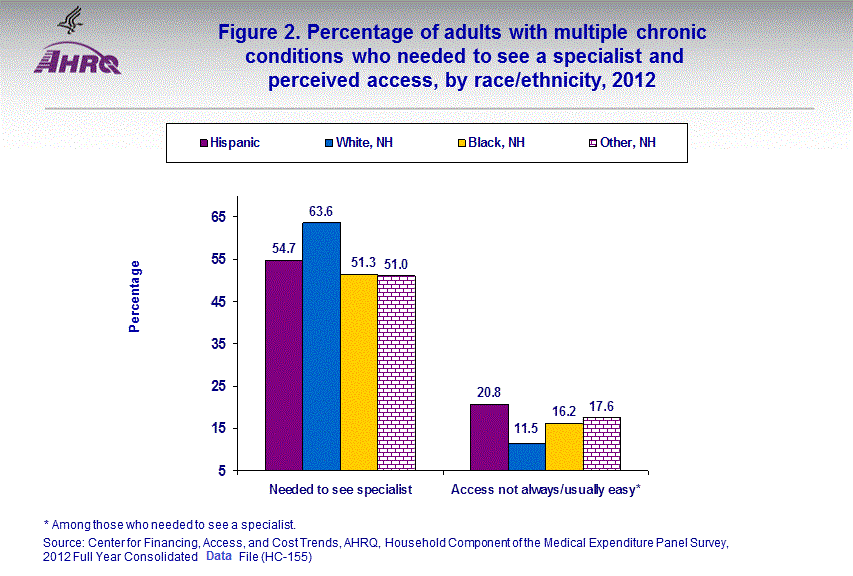
Among adults with multiple chronic conditions, a higher percentage of non-Hispanic whites reported they or a doctor thought they needed to see a specialist (63.6 percent) as compared with Hispanic adults (54.7 percent) and non-Hispanic black adults (51.3 percent) (figure 2). Hispanic adults were more likely to report that it was not always/usually easy to see a specialist when needed as compared to non-Hispanic white and non-Hispanic black adults (20.8 percent versus 11.5 percent and 16.2 percent).
Poverty status
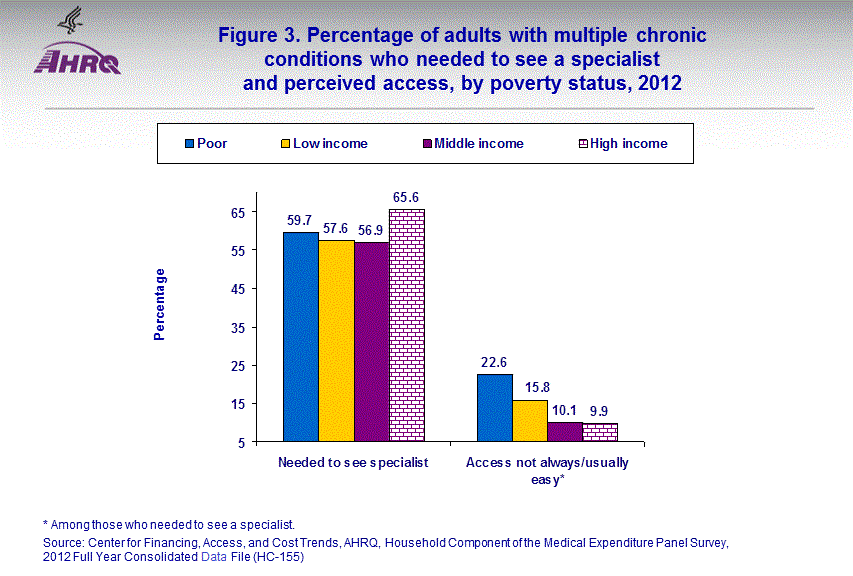
Among adults with multiple chronic conditions, those who were from high income families reported at higher rates that they needed to see a specialist compared to those who were poor, low income, or from middle income families (65.6 percent versus 59.7 percent, 57.6 percent, and 56.9 percent, respectively) (figure 3). Among those with a need to see a specialist, those who were poor reported at higher rates that it was not always/usually easy to see a specialist as compared with those who were low, middle, or high income (22.6 percent versus 15.8 percent, 10.1 percent, and 9.9 percent, respectively).
Insurance status
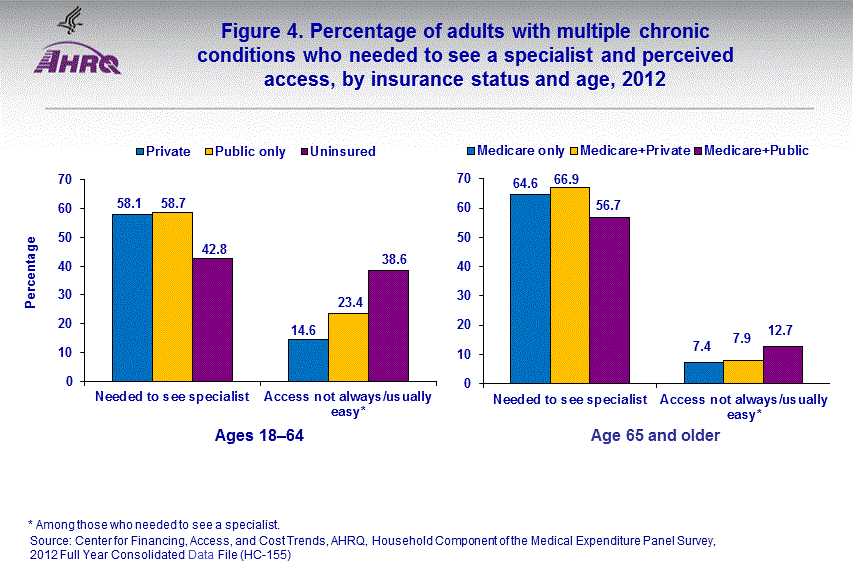
Among nonelderly adults with multiple chronic conditions, persons with any private insurance or public insurance only reported at higher rates that they or a doctor thought they needed to see a specialist compared to uninsured adults (58.1 percent and 58.7 percent versus 42.8 percent) (figure 4). Among those who perceived a need to see a specialist, a higher percentage (38.6 percent) of uninsured adults reported it was difficult to access a specialist compared to adults who had private insurance coverage (14.6 percent) or public insurance only (23.4 percent).
Among elderly adults with two or more chronic conditions, those with Medicare and other public insurance reported at lower rates that they needed to see a specialist compared to those with Medicare only or those with both Medicare and private insurance (56.7 percent versus 64.6 and 66.9 percent, respectively). However, perceived access to specialists did not vary significantly by insurance coverage among the elderly.
Data Source
The estimates shown in this Statistical Brief are based on data from the MEPS 2012 Full Year Consolidated Data File (HC-155), Medical Conditions File (HC-154), Office-Based Medical Provider Visits File (HC-152G), Outpatient Visits File (HC-152F), Hospital Inpatient Stays File (HC-152D), Home Health File (HC-152H), Emergency Room Visits File (HC-152E), and Prescribed Medicines File (HC-152A).This Brief also uses data from the 2012 Self-Administered Questionnaire (SAQ. Questions about adults' need for and access to specialists are asked annually in the MEPS adult SAQ. The SAQ asked respondents questions about their assessment of health care providers and systems. The health care quality measures in the SAQ were taken from the health plan version of Consumer Assessment of Healthcare Providers and Systems (CAHPS®), an AHRQ-sponsored family of survey instruments designed to measure quality of care from the consumer's perspective. All of the variables refer to events experienced in the last 12 months and were asked of adults age 18 and older.
The questions asked: Specialists are doctors like surgeons, heart doctors, allergy doctors, skin doctors, and others who specialize in one area of health care. In the last 12 months, did you or a doctor think you needed to see a specialist?
- If yes: In the last 12 months, how often was it easy to see a specialist that you needed to see? The answer choices are: Never, Sometimes, Usually, or Always.
- Responses of "never" and "sometimes" were combined to measure the difficulty in access to the specialists.
- More information about CAHPS® can be obtained through the CAHPS® Web site (http://www.cahps.ahrq.gov).
- SAQ weights were used to create weighted estimates.
Definitions
Multiple chronic conditionsThe condition data used in this report are conditions reported by MEPS respondents in the Household Component of MEPS as being associated with any reported health services utilization (i.e., home health, inpatient hospital stays, outpatient, office-based, emergency room visits, and prescribed medicines) during the year. The conditions were coded using ICD-9 codes that were translated into CCS codes. A person was considered to have multiple chronic conditions if they had two or more treated conditions and associated CCS codes from the list of chronic conditions developed by a working group of the Office of the Assistant Secretary for Health (OASH) in the Department of Health and Human Services (HHS). The 20 conditions are: Hypertension, congestive heart failure, coronary artery disease, cardiac arrhythmias, hyperlipidemia, stroke, arthritis, Asthma, Autism spectrum disorder, cancer, chronic kidney disease, chronic obstructive pulmonary disease, dementia (including Alzheimer's and other senile dementias), depression, diabetes, hepatitis, human immunodeficiency virus (HIV), osteoporosis, schizophrenia, and substance abuse disorders (drug and alcohol).
Poverty status
Four income groups were defined based on the percentage of the poverty line for total family income, adjusted for family size and composition. The following categories were used:
- Poor: Persons in families with incomes less than or equal to the poverty line, including those who reported negative income; and persons in families with incomes over the poverty line through 125 percent of the poverty line;
- Low income: Persons in families with incomes over 125 percent through 200 percent of the poverty line;
- Middle income: Persons in families with incomes over 200 percent through 400 percent of the poverty line; and
- High income: Persons in families with incomes over 400 percent of the poverty line.
Individuals under age 65 were classified in the following three insurance categories based on household responses to health insurance status questions:
- Any private health insurance: Individuals, who, at any time during the year, had private insurance that provided coverage for hospital and physician care, were classified as having private insurance. Coverage by TRICARE (Armed Forces-related coverage) was also included as private health insurance. Insurance that provided coverage for a single service only, such as dental or vision coverage, was not included.
- Public coverage only: Individuals were considered to have public coverage only if they met both of the following criteria: 1) they were not covered by private insurance at any time during the year, and 2) they were covered by one of the following public programs at any point during the year: Medicare, Medicaid, or other public hospital/physician coverage.
- Uninsured: The uninsured were defined as those not covered by private hospital/physician insurance, Medicare, TRICARE, Medicaid, or other public hospital/physician programs at any time during the year.
- Medicare only: Individuals who were covered by Medicare only during the year. For analytic purposes, this classification also included a very small number of persons age 65 and over who did not report Medicare coverage.
- Medicare plus private (including TRICARE): Individuals who, at any time during the year, were covered by a combination of Medicare and TRICARE or private insurance.
- Medicare plus other public coverage: Individuals who, at any time during the year, were covered by Medicare and some other type of public insurance.
About MEPS-HC
MEPS-HC is a nationally representative longitudinal survey that collects detailed information on health care utilization and expenditures, health insurance, and health status, as well as a wide variety of social, demographic, and economic characteristics for the U.S. civilian noninstitutionalized population. It is cosponsored by the Agency for Healthcare Research and Quality and the National Center for Health Statistics.For more information about MEPS, call the MEPS information coordinator at AHRQ (301-427-1406) or visit the MEPS Web site at http://www.meps.ahrq.gov/.
References
For a detailed description of the MEPS-HC survey design, sample design, and methods used to minimize sources of non-sampling errors, see the following publications:Cohen, J. Design and Methods of the Medical Expenditure Panel Survey Household Component. MEPS Methodology Report No. 1. AHCPR Pub. No. 97-0026. Rockville, MD. Agency for Health Care Policy and Research, 1997. http://meps.ahrq.gov/mepsweb/data_files/publications/mr1/mr1.shtml
Cohen, S. Sample Design of the 1996 Medical Expenditure Panel Survey Household Component. MEPS Methodology Report No. 2. AHCPR Pub. No. 97-0027. Rockville, MD. Agency for Health Care Policy and Research, 1997. http://meps.ahrq.gov/mepsweb/data_files/publications/mr2/mr2.shtml
Cohen, S. Design Strategies and Innovations in the Medical Expenditure Panel Survey. Medical Care, July 2003: 41(7) Supplement: III-5–III-12.
CAHPS®: https://cahps.ahrq.gov/cahps-database/about/index.html
For more information about specialists and care for people with chronic conditions, see the following publications:
Preventing Chronic Disease – Public Health Research, Practice, and Policy. PCD Collection: Multiple Chronic Conditions 2013; 10: April 2013. DOI: http://www.cdc.gov/pcd/collections/pdf/PCD_MCC_Collection_5-17-13.pdf.
Goodman R.A., Posner S.F., Huang E.S., Parekh A.K., Koh H.K. Defining and Measuring Chronic Conditions: Imperatives for Research, Policy, Program and Practice. Preventing Chronic Disease 2013; 10: 120239. DOI: http://dx.doi.org/10.5888/pcd10.120239.
Beatty, P.W., K.J. Hagglund, M.T. Neri, K.R. Dhont, M.J. Clark, and S.A. Hilton. Access to health care services among people with chronic or disabling conditions: patterns and predictors. Archives of Physical Medicine and Rehabilitation, October 2003, 84(10):1417–25.
Wagner, E. H., B. T. Austin, C. Davis, M. Hindmarsh, J. Schaefer, and A. Bonomi. Improving chronic illness care: translating evidence into action. Health Affairs, November-December 2001, 20(6):64–78.
Jennifer L. Wolff, MHS; Barbara Starfield, MD, MPH; Gerard Anderson, PhD. Prevalence, Expenditures, and Complications of Multiple Chronic Conditions in the Elderly. Archives of Internal Medicine, 2002, 162(20):2269-2276. http://archinte.jamanetwork.com/article.aspx?articleid=213908#ArticleInformation.
Suggested Citation
Soni, A. Specialist Need and Access among Adults with Multiple Chronic Conditions, U.S. Civilian Noninstitutionalized Population, 2012. Statistical Brief #482. November 2015. Agency for Healthcare Research and Quality, Rockville, MD. http://www.meps.ahrq.gov/mepsweb/data_files/publications/st482/stat482.shtmlAHRQ welcomes questions and comments from readers of this publication who are interested in obtaining more information about access, cost, use, financing, and quality of health care in the United States. We also invite you to tell us how you are using this Statistical Brief and other MEPS data and tools and to share suggestions on how MEPS products might be enhanced to further meet your needs. Please email us at MEPSProjectDirectors@ahrq.hhs.gov or send a letter to the address below:
Joel W. Cohen, PhD, Director
Center for Financing, Access, and Cost Trends
Agency for Healthcare Research and Quality
5600 Fishers Lane
Rockville, MD 20857
1Preventing Chronic Disease – Public Health Research, Practice, and Policy. PCD Collection: Multiple Chronic Conditions 2013; 10: April 2013. DOI: http://www.cdc.gov/pcd/collections/pdf/PCD_MCC_Collection_5-17-13.pdf.
2Goodman RA, Posner SF, Huang ES, Parekh AK, Koh HK. Defining and Measuring Chronic Conditions: Imperatives for Research, Policy, Program and Practice. Prev Chronic Dis 2013; 10: 120239. DOI: http://dx.doi.org/10.5888/pcd10.120239.
 |
||||||||||||||||||||||||
|
||||||||||||||||||||||||
|
|
||||||||||||||||||||||||
 |
||||||||||||||||||||||||
|
||||||||||||||||||||||||
|
|
||||||||||||||||||||||||
 |
||||||||||||||||||||||||
|
||||||||||||||||||||||||
|
|
||||||||||||||||||||||||
 |
||||||||||||||||||||||||
|
||||||||||||||||||||||||
|
|
||||||||||||||||||||||||