
|
|
|
Font Size:
|
||||
|
|
|
|
||||
STATISTICAL BRIEF #488:
The Uninsured in America: Estimates of the Percentage of Non-Elderly Adults Uninsured throughout Each Calendar Year, by Selected Population Subgroups and State Medicaid Expansion Status: 2013 and 2014
Highlights
- The percentage of non-elderly adults ages 18-64, uninsured for the entire calendar year ("the uninsured rate") declined from 18.8 percent (35.6 million adults) to 14.4 percent (27.4 million adults) between 2013 and 2014.
- The uninsured rate declined between 2013 and 2014 for adults ages 18-35, 36-54, and 55-64 in both Medicaid expansion and non-expansion states. In states that expanded Medicaid, the decline was larger for adults ages 18-35, than for adults ages 55-64, narrowing the percentage point difference in the uninsured rates between these two age groups in 2014.
- Uninsured rates declined between 2013 and 2014 for Hispanic, white, black and Asian non-elderly adults ages 18-64. The percentage point difference in the uninsured rates for Hispanic non-elderly adults and white non-Hispanic adults decreased between 2013 and 2014, overall and in Medicaid expansion states.
Introduction
The 2014 implementation of key provisions included in the Affordable Care Act (ACA) represents one of the largest health insurance expansions since the creation of Medicare and Medicaid in 1965. These provisions include premium tax credits for the purchase of private insurance for low-income adults and, in participating states, expanded Medicaid eligibility for adults with incomes up to 138 percent of the federal poverty level. Though the ACA's Medicaid expansion is optional, 26 states and the District of Columbia had expanded their Medicaid programs by the end of 2014.Using information from the Household Component of the Medical Expenditure Panel Survey (MEPS-HC), this Brief provides annual estimates for 2009–2014 of the percentage and number of non-elderly adults ages 18–64, in the U.S. civilian noninstitutionalized population, that were uninsured for the entire calendar year. However, the primary focus of this Brief is to examine changes in calendar-year uninsured rates between 2013 and 2014 for various demographic groups, overall and by state Medicaid expansion status. All differences between estimates discussed in the text are statistically significant at the 0.05 level unless otherwise noted.
Findings
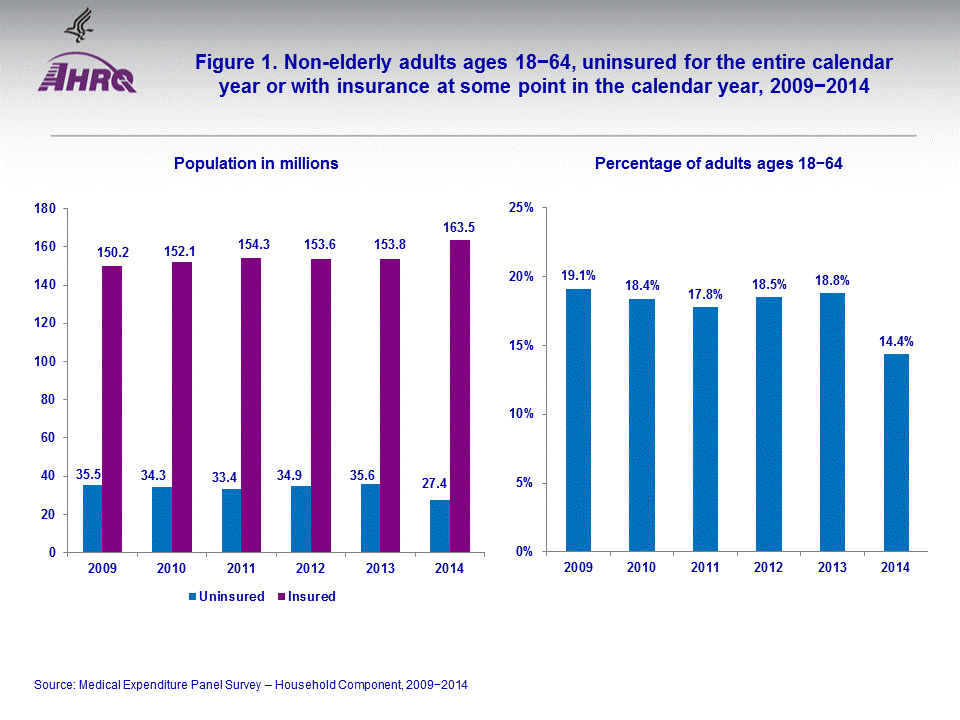
Year-to-year changes in calendar-year uninsured rates for non-elderly adults were not significant between 2009 and 2013. However, in 2014, when key provisions of the ACA were implemented, the uninsured rate for non-elderly adults declined from the 2013 rate of 18.8 percent (35.6 million adults) to 14.4 percent (27.4 million adults) (figure 1). The remainder of this Brief examines changes in the calendar-year uninsured rate between 2013 and 2014 for various demographic groups and by state Medicaid expansion status.Age
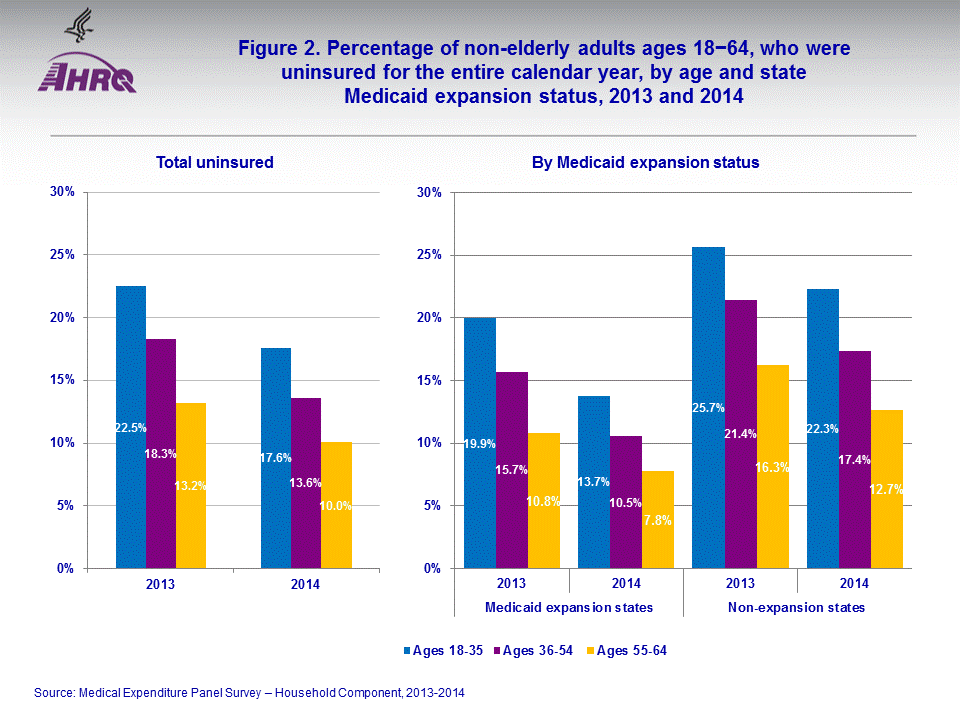
Nationally, the percentage of non-elderly adults uninsured throughout 2013 declined with increasing age (figure 2). For example, 22.5, 18.3, and 13.2 percent of adults ages 18–35, 36–54, and 55–64, respectively, were uninsured throughout 2013. In 2014, uninsured rates decreased from their 2013 levels in all age groups by about 3–5 percentage points.
Although uninsured rates declined for adults in all age groups in 2014 in both expansion and non-expansion states, uninsured rates continued to decrease with age, nationally and in both state categories in 2014. However, in expansion states, the decline in uninsured rates was larger for adults ages 18–35 (6.2 percentage points), than for those ages 55–64 (3.0 percentage points), narrowing the percentage point difference in uninsured rates between these two age groups.
Race/ethnicity/nativity
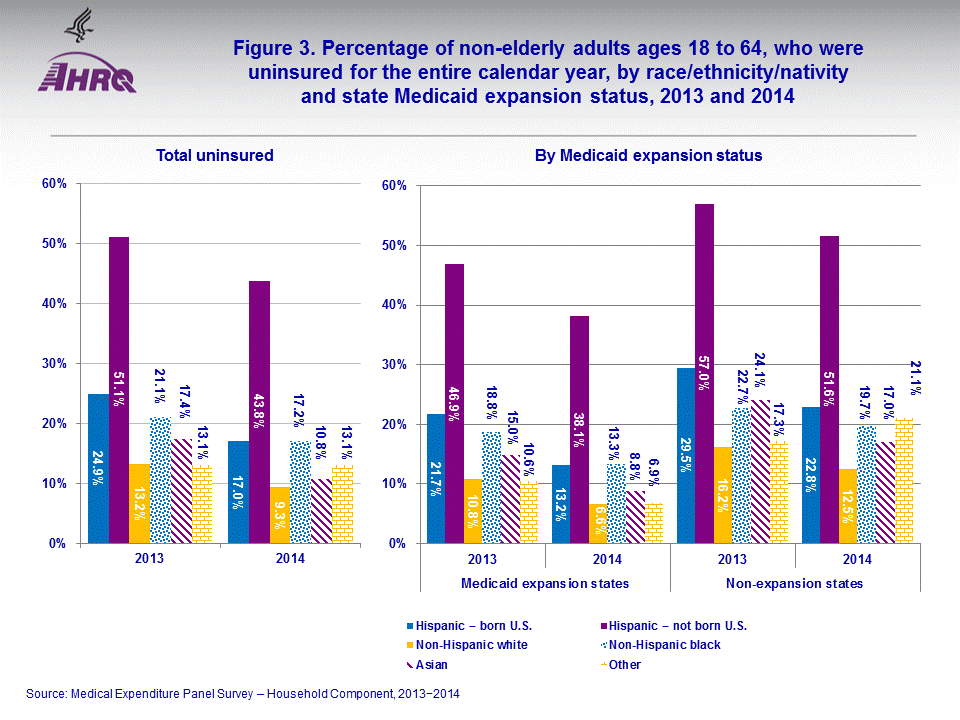
In 2013, white non-Hispanic adults had a lower uninsured rate than Hispanic, black non-Hispanic and Asian non-Hispanic adults (13.2 percent for white non-Hispanic adults, 24.9 percent for Hispanic adults born in the U.S., 51.1 percent for Hispanic adults not born in the U.S., 21.1 percent for black non-Hispanic adults, and 17.4 percent for Asian non-Hispanic adults) (figure 3). In 2014, uninsured rates declined for Hispanic, black non-Hispanic, white non-Hispanic and Asian non-Hispanic non-elderly adults. The decline for Asian non-Hispanic adults was larger than that for white non-Hispanic adults (p < 0.10), so that by 2014 there was no statistically significant percentage point difference in uninsured rates for adults in these two racial/ethnic groups. The difference in percentage points between uninsured rates for Hispanic adults born in the U.S. and white non-Hispanic adults also narrowed in 2014 (from 11.7 percentage points in 2013 to 7.7 percentage points) and the percentage point gap between Hispanic adults not born in the U.S. and white non-Hispanic adults narrowed slightly but remained large.
Similar to findings for all states, uninsured rates declined for Hispanic, white non-Hispanic, black non-Hispanic and Asian non-Hispanic adults in expansion and non-expansion states. The narrowing of the difference in uninsured rates for Hispanic non-elderly adults that were both born and not born in the U.S. and white non-Hispanic adults, described above, occurred only in expansion states.
Sex
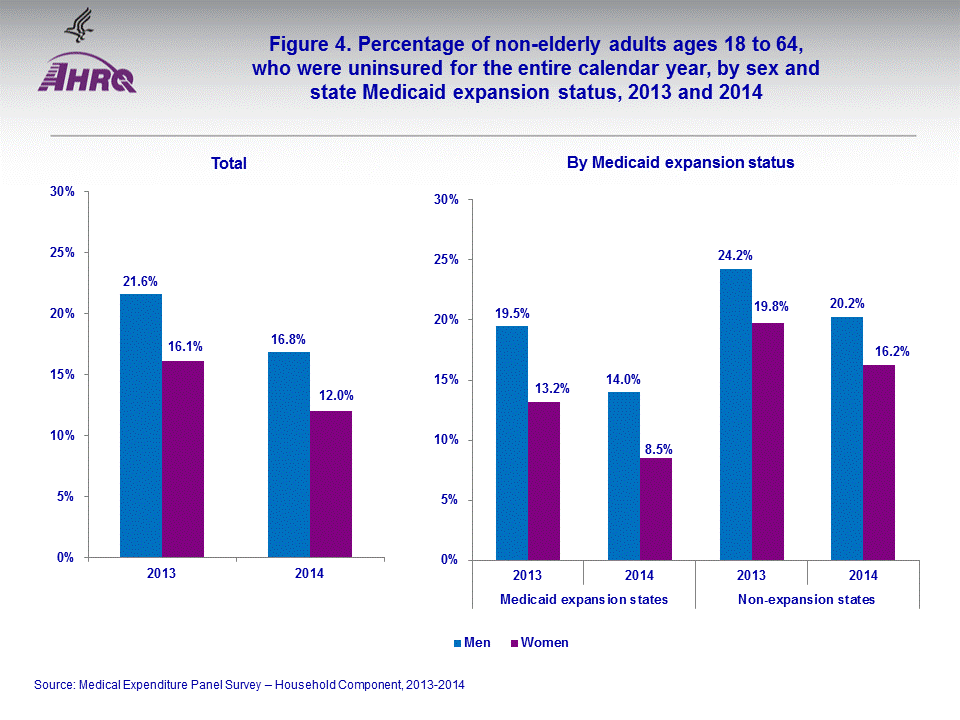
Uninsured rates for non-elderly men were higher than for women, both overall and in Medicaid expansion and non-expansion states in both 2013 and 2014 (figure 4). In 2014, uninsured rates declined for both men and women (21.6 to 16.8 percent for men and 16.1 to 12.0 percent for women). In Medicaid expansion states, uninsured rates declined from 19.5 to 14.0 percent for men and from 13.2 to 8.5 percent for women. In non-expansion states, rates declined from 24.2 percent to 20.2 percent for men and 19.8 percent to 16.2 percent for women.
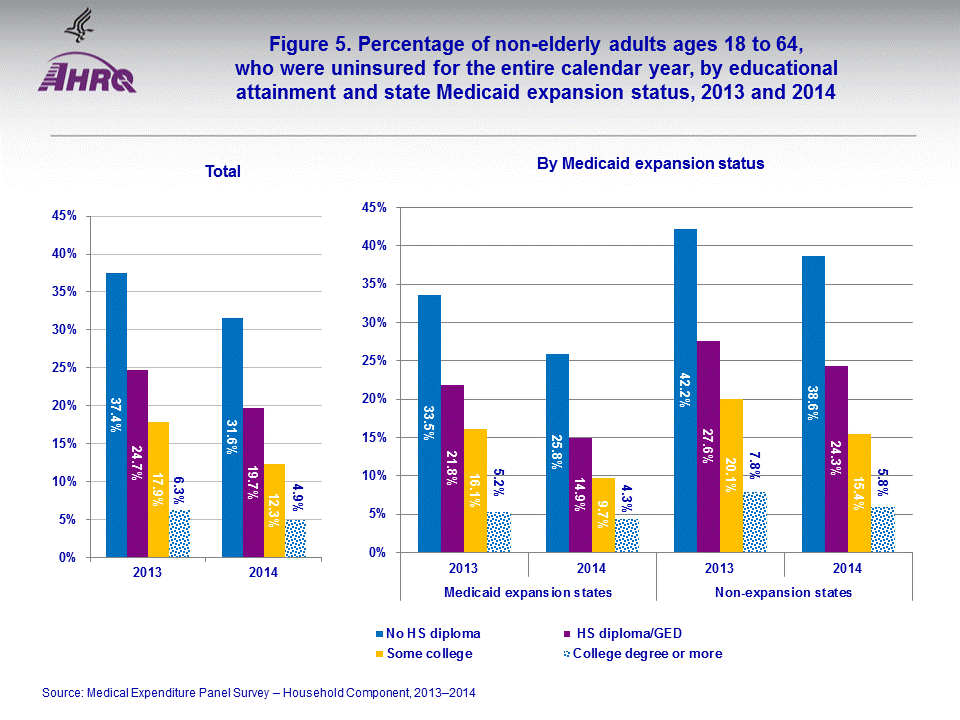
Educational attainment
Nationally in 2013, uninsured rates were lower for adults with higher levels of educational attainment (figure 5). In 2013, uninsured rates were 37.4, 24.7, 17.9, and 6.3 percent for individuals with no high school diploma, a high school diploma or GED, some college, and a college degree or more, respectively. In 2014, uninsured rates declined for all education categories but the decline was smaller among those with the highest educational attainment compared to those in other education categories, narrowing the differences between those with less educational attainment and those with a college degree or more.
Uninsured rates were significantly lower in states that expanded Medicaid than in non-expansion states for non-elderly adults in each education category in 2013 and for all but the highest educational category in 2014. There was a significant decrease in 2014 for adults in all education groups in both state categories, except for adults with the highest educational attainment in expansion states. Analogous to the finding for all states, differences in uninsured rates between those with a college degree or more and those with less educational attainment narrowed in expansion states in 2014 and narrowed in non-expansion states between those with some college and a college degree or more.
Data Source
The estimates shown in this Statistical Brief are drawn from analyses conducted by the MEPS staff from files HC-129, HC-138, HC-147, HC-155, HC-163, and HC-165, augmented with information on the person's state of residence and weighted using a weight that is post-stratified by poverty status to the Current Population Survey.Definitions
AgePeople were included in the sample if they were between the ages of 18 and 64 throughout the calendar year and present in the MEPS-HC for the entire calendar year. This restriction excludes individuals who were institutionalized, left the country or died during the year and those who joined the household after January. Age is categorized based on the person's age at the end of the calendar year. Uninsured
People who did not have health insurance coverage for the entire calendar year were classified as uninsured. The uninsured were defined as people not covered by Medicaid, Medicare, TRICARE (Armed Forces-related coverage), other public hospital/physician programs, private hospital/physician insurance (including Medigap coverage) or insurance purchased through health insurance Marketplaces established in accordance with the Affordable Care Act. People covered only by non-comprehensive State-specific programs (e.g., Maryland Kidney Disease Program) or private single service plans such as coverage for dental or vision care only, or coverage for accidents or specific diseases, were considered uninsured.
Race/ethnicity/nativity
Classification by race/ethnicity was based on information reported for each family member. First, respondents were asked if the person's main national origin or ancestry was Puerto Rican; Cuban; Mexican, Mexican-American, or Chicano; other Latin American; or other Spanish. All persons whose main national origin or ancestry was reported in one of these Hispanic groups, regardless of racial background, were classified as Hispanic. All other persons were classified according to their reported race. For this analysis, the following classification by race/ethnicity, in combination with information on nativity, was used: Hispanic adults who were born in the U.S. (of any race), Hispanic adults who were not born in the U.S. (of any race), black non-Hispanic only, white non-Hispanic only, Asian non-Hispanic only, and other non-Hispanic or multiple races reported.
Education
Information on the highest level of schooling completed or the highest degree received by a person was asked in the first round the person was included in the MEPS-HC. The categories included in this Statistical Brief include 12 or fewer years of school (no high school diploma), high school diploma or GED, some college, and a college degree or more.
Medicaid expansion states
This analysis defined Medicaid expansion states as those states that implemented the ACA's Medicaid expansion at any time during calendar year 2014 and this definition was used to classify states in 2013 as well as in 2014. Medicaid expansion states included Arizona, Arkansas, California, Colorado, Connecticut, Delaware, District of Columbia, Hawaii, Illinois, Iowa, Kentucky, Maryland, Massachusetts, Michigan, Minnesota, Nevada, New Hampshire, New Jersey, New Mexico, New York, North Dakota, Ohio, Oregon, Rhode Island, Vermont, Washington, and West Virginia.
About MEPS-HC
MEPS-HC is a nationally representative longitudinal survey that collects detailed information on health care utilization and expenditures, health insurance, and health status, as well as a wide variety of social, demographic, and economic characteristics for the U.S. civilian noninstitutionalized population. It is co-sponsored by the Agency for Healthcare Research and Quality and the National Center for Health Statistics. For more information about MEPS, call the MEPS information coordinator at AHRQ (301) 427-1406 or visit the MEPS Web site at http://www.meps.ahrq.gov/.References
Carroll, W. The Uninsured in America, First Part of 2013: Estimates for the U.S. Civilian Noninstitutionalized Population under Age 65. Statistical Brief #447. August 2013. Agency for Healthcare Research and Quality, Rockville, MD. http://meps.ahrq.gov/mepsweb/data_files/publications/st447/stat447.shtmlCohen, J. Design and Methods of the Medical Expenditure Panel Survey Household Component. MEPS Methodology Report No. 1. AHCPR Pub. No. 97-0026. Rockville, MD. Agency for Healthcare Policy and Research, 1997. http://www.meps.ahrq.gov/mepsweb/data_files/publications/mr1/mr1.shtml
Ezzati-Rice, T.M., Rohde, F. Greenblatt, J. Sample Design of the Medical Expenditure Panel Survey Household Component, 1998-2007. Methodology Report No. 22. March 2008. Agency for Healthcare Research and Quality, Rockville, MD. http://meps.ahrq.gov/mepsweb/data_files/publications/mr22/mr22.shtml
Kaiser Family Foundation. Status of State Action on the Medicaid Expansion Decision. Kaiser Family Foundation, 2016. Accessed on June 2. 2016. Available from: http://kff.org/medicaid/state-indicator/state-activity-around-expanding-medicaid-under-the-affordable-care-act/.)
Rhoades, J.A. and Cohen, S.B. The Long-Term Uninsured in America, 2008–2011 (Selected Intervals): Estimates for the U.S. Civilian Noninstitutionalized Population under Age 65. Statistical Brief #424. November 2013. Agency for Healthcare Research and Quality, Rockville, MD. http://meps.ahrq.gov/mepsweb/data_files/publications/st424/stat424.shtml
Roemer, M. The Uninsured in America, First Part of 2012: Estimates for the U.S. Civilian Noninstitutionalized Population under Age 65. Statistical Brief #422. September 2013. Agency for Healthcare Research and Quality, Rockville, MD. http://meps.ahrq.gov/mepsweb/data_files/publications/st422/stat422.shtml
Vistnes, J., Lipton, B. and Miller G.E. Uninsurance and Insurance Transitions Before and After 2014: Estimates for U.S., Non-Elderly Adults by Health Status, Presence of Chronic Conditions and State Medicaid Expansion Status. Statistical Brief #490. June 2016. Agency for Healthcare Research and Quality, Rockville, MD. http://meps.ahrq.gov/mepsweb/data_files/publications/st490/stat490.shtml
Vistnes, J. and Miller G.E. Transitions in Health Insurance Coverage for Non-Elderly Adults in the U.S. Civilian Noninstitutionalized Population: 2013-2014 and Selected Preceding Two-Year Periods. Statistical Brief #489. June 2016. Agency for Healthcare Research and Quality, Rockville, MD. http://meps.ahrq.gov/mepsweb/data_files/publications/st489/stat489.shtml
Suggested Citation
Vistnes, J. and Lipton, B. The Uninsured in America: Estimates of the Percentage of Non-Elderly Adults Uninsured throughout Each Calendar Year, by Selected Population Subgroups and State Medicaid Expansion Status: 2013 and 2014. Statistical Brief #488. June 2016. Agency for Healthcare Research and Quality, Rockville, MD. http://meps.ahrq.gov/mepsweb/data_files/publications/st488/stat488.shtmlJoel W. Cohen, PhD, Director
Center for Financing, Access, and Cost Trends
Agency for Healthcare Research and Quality
5600 Fishers Lane, Mailstop 07W41A
Rockville, MD 20857
 |
|||||||||||||||||||||||||||||||||||||||||||||||||||||||||||||||
|
|||||||||||||||||||||||||||||||||||||||||||||||||||||||||||||||
|
|
|||||||||||||||||||||||||||||||||||||||||||||||||||||||||||||||
 |
|||||||||||||||||||||||||||||||||||||||||||||||||||||||||||||||
|
|||||||||||||||||||||||||||||||||||||||||||||||||||||||||||||||
|
|
|||||||||||||||||||||||||||||||||||||||||||||||||||||||||||||||
 |
|||||||||||||||||||||||||||||||||||||||||||||||||||||||||||||||
|
|||||||||||||||||||||||||||||||||||||||||||||||||||||||||||||||
|
|
|||||||||||||||||||||||||||||||||||||||||||||||||||||||||||||||
 |
|||||||||||||||||||||||||||||||||||||||||||||||||||||||||||||||
|
|||||||||||||||||||||||||||||||||||||||||||||||||||||||||||||||
|
|
|||||||||||||||||||||||||||||||||||||||||||||||||||||||||||||||
 |
|||||||||||||||||||||||||||||||||||||||||||||||||||||||||||||||
|
|||||||||||||||||||||||||||||||||||||||||||||||||||||||||||||||
|
|
|||||||||||||||||||||||||||||||||||||||||||||||||||||||||||||||