
|
|
|
Font Size:
|
||||
|
|
|
|
||||
STATISTICAL BRIEF #489:
Transitions in Health Insurance Coverage for Non-Elderly Adults in the U.S. Civilian Noninstitutionalized Population: 2013-2014 and Selected Preceding Two-Year Periods
Highlights
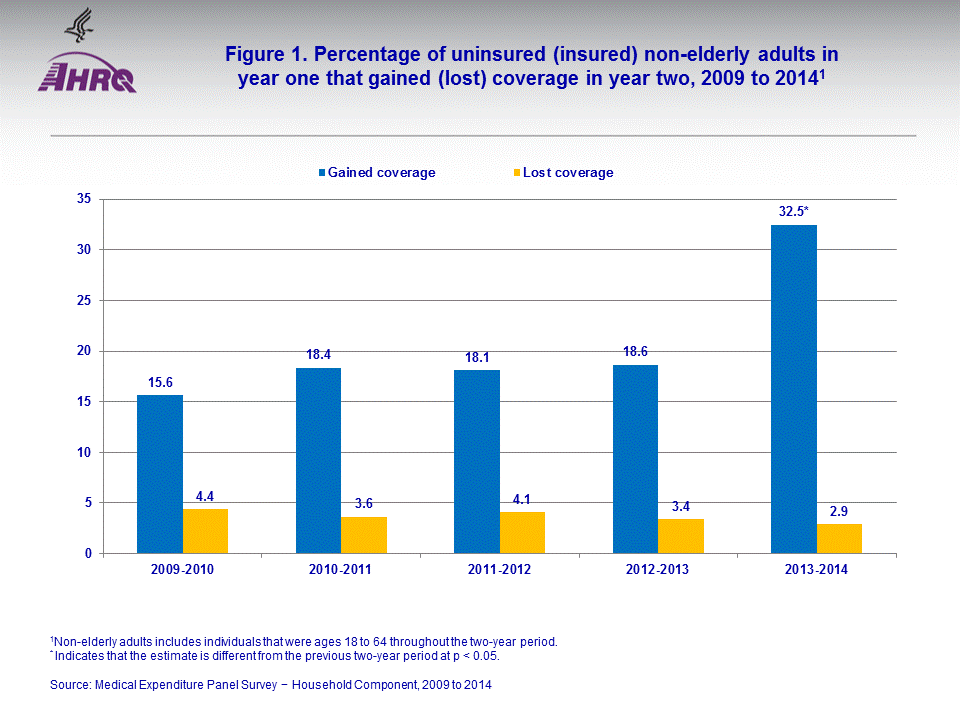
- About one-third of non-elderly adults who were uninsured for the entire year in 2013 had insurance coverage at some point in 2014 (32.5 percent), representing an increase of almost 14 percentage points from 2012-2013, when 18.6 percent of uninsured adults gained coverage.
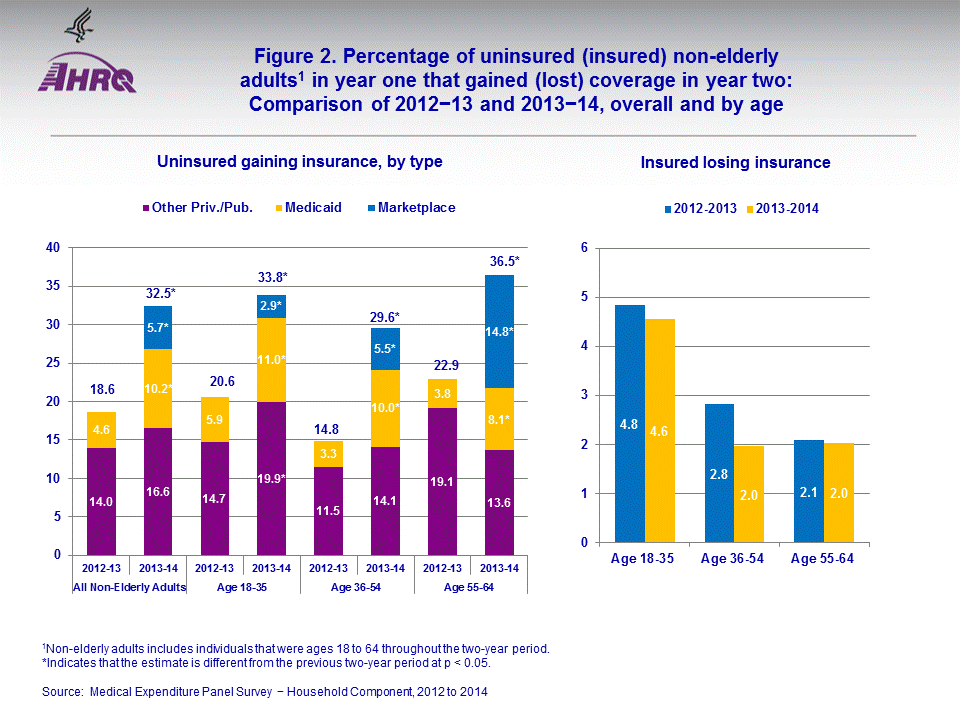
- Adults who were uninsured in 2013 were more likely to gain Medicaid coverage in 2014 than uninsured adults in the 2012-2013 period (10.2 percent versus 4.6 percent), and 5.7 percent of adults who were uninsured throughout 2013 enrolled in Marketplace coverage, which was newly available in 2014.
- From 2012-2013 to 2013-2014, the pattern of an increased likelihood of gaining any coverage and of gaining Medicaid coverage, along with some enrollment in newly-available Marketplace coverage, was observed across a broad array of demographic groups defined by age, race/ethnicity, and educational attainment.
Introduction
In 2014, new sources of insurance coverage became available for previously uninsured adults. These new sources included premium subsidies for low and middle-income adults to purchase private insurance in the new Marketplaces and the potential for states to expand Medicaid eligibility to include adults with incomes up to 138 percent of the federal poverty line. By the end of 2014, 26 states and the District of Columbia had expanded their Medicaid programs.Using information from the Household Component of the Medical Expenditure Panel Survey (MEPS-HC) for the 5 two-year intervals from 2009–2010 through 2013–2014, this Statistical Brief provides detailed estimates of health insurance coverage transitions for non-elderly adults between the ages of 18 and 64. More specifically, this Brief presents estimates of the percentage of uninsured adults that 'gained' insurance and the percentage of insured adults that 'lost' coverage in each two-year period.1 Individuals are considered to have gained coverage if they were uninsured for the entire first year of each period and were insured at any point in the second year. Individuals are considered to have lost coverage if they were insured at any point during the first year and were uninsured for the entire second year. Note that individuals that 'lost' coverage could be insured for all or any part of the first year, so they may have lost coverage before the second year began. For uninsured adults who gained coverage, this Brief further examines the contributions of three types of insurance—Marketplace coverage, Medicaid, and other private/public insurance—to overall gains in coverage. Estimates are presented for all non-elderly adults and for subgroups of adults defined by age, race/ethnicity, and educational attainment. All differences between estimates discussed in the text are statistically significant at the 0.05 level or are noted if significant at the 0.10 level (p < 0.10).
Findings
Comparisons of the 2013–2014 period to earlier periodsIn 2014, newly-available Marketplace insurance and the expansion of Medicaid eligibility in many states provided new options for previously uninsured adults to obtain coverage. Estimates from the MEPS-HC suggest these new coverage options affected insurance transitions as nearly one-third (32.5 percent) of non-elderly adults who were uninsured for the entire year in 2013 gained insurance coverage at some point in 2014. This represents a significantly higher percentage than in any two-year period from 2009 through 2013, when the percentage of uninsured adults gaining insurance ranged from 15.6 percent to 18.6 percent. Results also show a small decrease from 2009–2010 to 2013–2014 in the likelihood that insured adults lost coverage (4.4 percent versus 2.9 percent), but no significant difference in the likelihood of losing coverage between the two most recent periods (2012–2013 versus 2013–2014) (figure 1).
Comparisons by population characteristics, 2013–2014
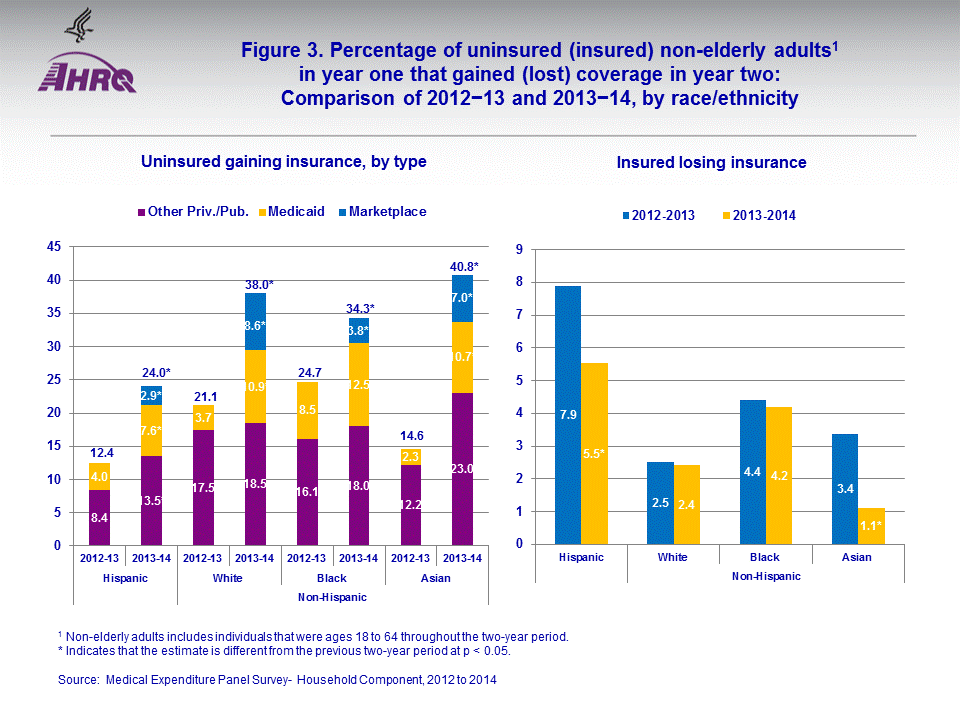
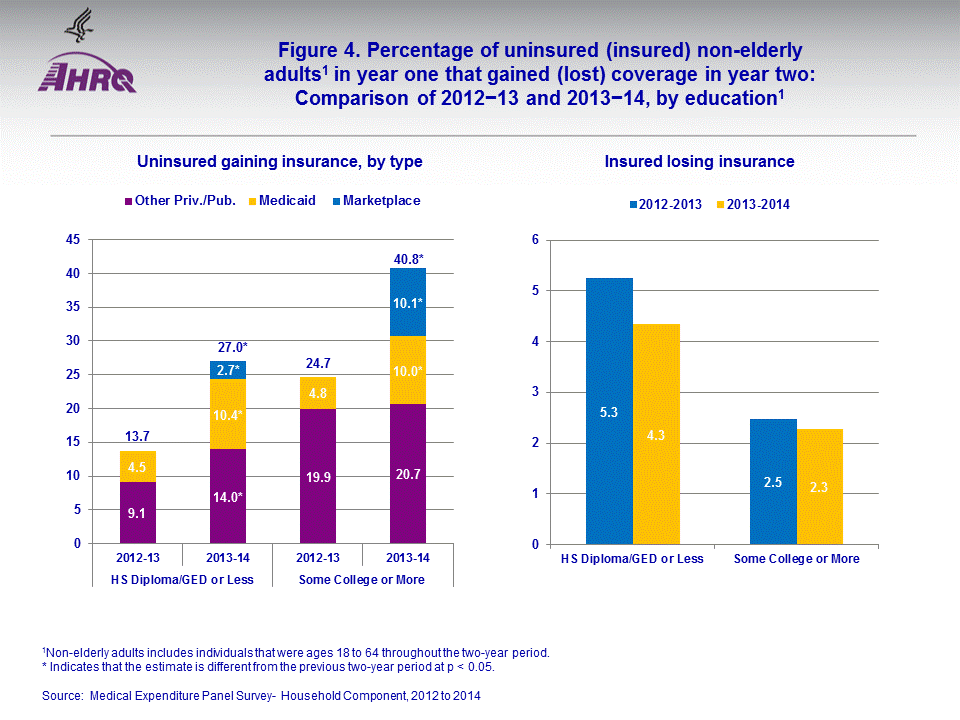
The patterns noted above for all non-elderly adults were similar for nearly every subgroup examined in this Brief. In particular, from 2012–2013 to 2013–2014, the likelihood of gaining coverage increased for every subgroup defined by age, race/ethnicity and educational attainment. Regarding specific types of coverage, the likelihood of gaining Medicaid coverage increased for every subgroup (p < 0.10 for non-Hispanic blacks), and every subgroup had some enrollment, and in some cases substantial enrollment, in newly-available Marketplace coverage in 2014. Increases in the likelihood of gaining other private/public insurance were not as widespread across population subgroups, but were statistically significant for younger adults (ages 18–35), adults with a high school diploma/GED or less education, and Hispanic adults. While there were not significant changes in the likelihood that insured adults lost coverage in most subgroups, there were decreases among Hispanic adults and Asian adults (figures 2–4).
Age
Figure 2 shows uninsured adults ages 55–64 (14.8 percent) were much more likely to enroll in Marketplace coverage in 2014 than adults ages 36–54 (5.5 percent) and adults ages 18–35 (2.9 percent). With respect to losing coverage, among adults who were insured in 2013 the youngest adults (4.6 percent) were more likely than those ages 36–54 (2.0 percent) and those ages 55–64 (2.0 percent) to lose insurance in 2014 (figure 2).
Race/ethnicity
From 2013 to 2014, uninsured Hispanic adults were less likely than adults in the other racial/ethnic groups to gain insurance. The differences were substantial as 24.0 percent of Hispanic adults gained insurance compared to percentages that ranged from 34.3 percent to 40.8 percent for the other racial-ethnic groups. Hispanics were less likely than white (p < 0.10) and black adults to gain Medicaid coverage, while non-Hispanic whites (8.6 percent) were about two times as likely to enroll in Marketplace coverage as non-Hispanic blacks (3.8 percent) and about three times as likely as Hispanic adults (2.9 percent) (figure 3). Among adults insured in 2013, Hispanics were more likely than non-Hispanic whites and Asians to lose coverage. However, their rate of losing coverage declined from the previous two-year period (from 7.9 percent in 2012–2013 to 5.5 percent in 2013–2014) as did the rate for Asian adults (from 3.4 percent – 2012–2013 to 1.1 percent in 2013–2014).
Education
Among adults who were uninsured in 2013, those with a high-school diploma or GED or less education were less likely than adults with more education to gain any insurance coverage in 2014 (27.0 versus 40.8 percent). In 2014, previously uninsured adults with a high-school education or less were less likely to enroll in Marketplace coverage than adults with some college or more (2.7 versus 10.1 percent) and less likely to gain other private/public coverage. Further, among adults with insurance in 2013, those with a high-school diploma/ GED or less education were more likely than those with some college or more education (4.3 percent versus 2.3 percent, respectively) to lose coverage in 2014 (figure 4).
Data Source
The estimates shown in this Statistical Brief are drawn from analyses conducted by the MEPS staff from the following public use files: HC-129, HC-138, HC-147, HC-155, HC-163 and HC-165. For consistency with the other data files, the analytic weight from HC-165 was adjusted by post-stratifying by poverty status to the Current Population Survey.Definitions
UninsuredPeople who did not have coverage for the entire year were classified as uninsured. The uninsured were defined as people not covered by Medicaid, Medicare, TRICARE (Armed Forces-related coverage), other public hospital/physician programs, private hospital/physician insurance (including Medigap coverage) or insurance purchased through health insurance Marketplaces established in accordance with the Affordable Care Act. People covered only by non-comprehensive State-specific programs (e.g., Maryland Kidney Disease Program) or private single service plans such as coverage for dental or vision care only, or coverage for accidents or specific diseases, were considered uninsured.
Insured
People who had coverage at any point during the year were classified as insured. The insured were defined as people covered by Medicaid, Medicare, TRICARE (Armed Forces-related coverage), other public hospital/physician programs, private hospital/physician insurance (including Medigap coverage) or insurance purchased through health insurance Marketplaces established in accordance with the Affordable Care Act. People covered only by non-comprehensive State-specific programs (e.g., Maryland Kidney Disease Program) or private single service plans such as coverage for dental or vision care only, or coverage for accidents or specific diseases, were not considered to be insured.
Coverage type gained
Individuals who gained coverage from the first to the second year of the reference period were placed into one of three hierarchical insurance categories: Marketplace, Medicaid (no Marketplace or private coverage), and Other Public and Private Coverage that includes all sources of coverage except for those identified in the first two categories.
Population covered
Persons included in this analysis were in the survey for the entire two-year period of eligibility and were ages 18-64 for the entire two-year period of eligibility. This restriction excludes individuals who were institutionalized, left the country or died during the two-year period and those who joined the household after January of the first year of the two-year period.
Age
Individuals are included in the analysis if they were ages 18-64 for the entire two-year period of eligibility. Although this sample restriction ensures individuals are always in the target age range, it excludes those who were age 64 in the first year of the reference period (and turned 65 in the second year), and also excludes those who were 18 in the second year of their reference period. Age is categorized based on the person's age at the end of the person's first calendar year in the MEPS-HC.
Race/ethnicity
Classification by race/ethnicity was based on information reported for each family member. First, respondents were asked if the person's main national origin or ancestry was Puerto Rican; Cuban; Mexican, Mexican-American, or Chicano; other Latin American; or other Spanish. All persons whose main national origin or ancestry was reported in one of these Hispanic groups, regardless of racial background, were classified as Hispanic. All other persons were classified according to their reported race. For this analysis, the following classification by race and ethnicity was used Hispanic, non-Hispanic black only, non-Hispanic white only, and non-Hispanic Asian only. Adults who reported other races and/or multiple races were not included in the analysis due to insufficient sample size.
Education
Information on the highest level of schooling completed or the highest degree received by a person was asked in the first round the person was included in the MEPS-HC. The categories included in this Statistical Brief are: 1) a high school diploma/ GED or less education and 2) some college or more education.
About MEPS-HC
MEPS-HC is a nationally representative longitudinal survey that collects detailed information on health care utilization and expenditures, health insurance, and health status, as well as a wide variety of social, demographic, and economic characteristics for the U.S. civilian noninstitutionalized population. It is cosponsored by the Agency for Healthcare Research and Quality and the National Center for Health Statistics.For more information about MEPS, call the MEPS information coordinator at AHRQ (301-427-1406) or visit the MEPS Web site at http://meps.ahrq.gov/mepsweb/.
References
Carroll, W. The Uninsured in America, First Part of 2013: Estimates for the U.S. Civilian Noninstitutionalized Population under Age 65. Statistical Brief #447. August 2013. Agency for Healthcare Research and Quality, Rockville, MD. http://meps.ahrq.gov/mepsweb/data_files/publications/st447/stat447.shtmlCohen, J. Design and Methods of the Medical Expenditure Panel Survey Household Component. MEPS Methodology Report No. 1. AHCPR Pub. No. 97-0026. Rockville, MD: Agency for Health Care Policy and Research, 1997. http://meps.ahrq.gov/mepsweb/data_files/publications/mr1/mr1.shtml
Cohen, S. Transitions in Health Insurance Coverage Over Time, 2009-2013 (Selected Intervals): Estimates for the U.S. Civilian Noninstitutionalized Adult Population under Age 65. Statistical Brief #439. May 2014. Agency for Healthcare Research and Quality, Rockville, MD. http://meps.ahrq.gov/mepsweb/data_files/publications/st439/stat439.shtml
Ezzati-Rice, T.M., Rohde, F., Greenblatt, J. Sample Design of the Medical Expenditure Panel Survey Household Component, 1998-2007. Methodology Report No. 22. March 2008. Agency for Healthcare Research and Quality, Rockville, MD. http://meps.ahrq.gov/mepsweb/data_files/publications/mr22/mr22.shtml
Rhoades, J.A. and Cohen, S.B. The Long-Term Uninsured in America, 2008-2011 (Selected Intervals): Estimates for the U.S. Civilian Noninstitutionalized Population under Age 65. Statistical Brief #424. November 2013. Agency for Healthcare Research and Quality, Rockville, MD. http://meps.ahrq.gov/mepsweb/data_files/publications/st424/stat424.shtml
Roemer, M. The Uninsured in America, First Part of 2012: Estimates for the U.S. Civilian Noninstitutionalized Population under Age 65. Statistical Brief #422. September 2013. Agency for Healthcare Research and Quality, Rockville, MD. http://meps.ahrq.gov/mepsweb/data_files/publications/st422/stat422.shtml
Vistnes, J. and Cohen, S. Transitions in Health Insurance Coverage Over Time, 2012-2014 (Selected Intervals): Estimates for the U.S. Civilian Noninstitutionalized Adult Population under Age 65. Statistical Brief #467. February 2015. Agency for Healthcare Research and Quality, Rockville, MD. http://www.meps.ahrq.gov/mepsweb/data_files/publications/st467/stat467.shtml
Vistnes, J. and Lipton, B. The Uninsured in America: Estimates of the Percentage of Non-Elderly Adults Uninsured throughout each Calendar Year, by Selected Population Subgroups and State Medicaid Expansion Status: 2013 and 2014. Statistical Brief #488. June 2016. Agency for Healthcare Research and Quality, Rockville, MD. http://meps.ahrq.gov/mepsweb/data_files/publications/st488/stat488.shtml
Vistnes, J., Lipton, B. and Miller G.E. Uninsurance and Insurance Transitions Before and After 2014: Estimates for U.S., Non-Elderly Adults by Health Status, Presence of Chronic Conditions and State Medicaid Expansion Status. Statistical Brief #490. June 2016. Agency for Healthcare Research and Quality, Rockville, MD. http://meps.ahrq.gov/mepsweb/data_files/publications/st490/stat490.shtml
Suggested Citation
Vistnes, J. and Miller G.E. Transitions in Health Insurance Coverage for Non-Elderly Adults in the U.S. Civilian Noninstitutionalized Population: 2013-2014 and Selected Preceding Two-Year Periods. Statistical Brief #489. June 2016. Agency for Healthcare Research and Quality, Rockville, MD. http://meps.ahrq.gov/mepsweb/data_files/publications/st489/stat489.shtmlJoel W. Cohen, PhD, Director
Center for Financing, Access, and Cost Trends
Agency for Healthcare Research and Quality
5600 Fishers Lane, Mailstop 07W41A
Rockville, MD 20857
1 For estimates of the percentage of adults ages 18 to 64 who were uninsured throughout the calendar year, see Vistnes and Lipton (2016). Note that the samples for the estimates in this Statistical Brief differ somewhat from those in Vistnes and Lipton (2016) since they use observations from one panel in the MEPS-HC, not the combined two panels used in Vistnes and Lipton (2016) and the age restrictions are based on a two-year, rather than a one-year period.
 |
||||||||||||||||||||||||||||||||||||||||||||||||||||||||||||||||||||||||||||||||||||||||||||||||
|
||||||||||||||||||||||||||||||||||||||||||||||||||||||||||||||||||||||||||||||||||||||||||||||||
|
|
||||||||||||||||||||||||||||||||||||||||||||||||||||||||||||||||||||||||||||||||||||||||||||||||
 |
||||||||||||||||||||||||||||||||||||||||||||||||||||||||||||||||||||||||||||||||||||||||||||||||
|
||||||||||||||||||||||||||||||||||||||||||||||||||||||||||||||||||||||||||||||||||||||||||||||||
|
|
||||||||||||||||||||||||||||||||||||||||||||||||||||||||||||||||||||||||||||||||||||||||||||||||
 |
||||||||||||||||||||||||||||||||||||||||||||||||||||||||||||||||||||||||||||||||||||||||||||||||
|
||||||||||||||||||||||||||||||||||||||||||||||||||||||||||||||||||||||||||||||||||||||||||||||||
| Uninsured gaining insurance, by type | ||||
|---|---|---|---|---|
| HS diploma/GED or less | Some college or more | |||
| 2012-2013 | 2013-2014 | 2012-2013 | 2013-2014 | |
| Total | 13.7 | 27.0* | 24.7 | 40.8* |
| Other priv./pub. | 9.1 | 14.0* | 19.9 | 20.7 |
| Medicaid | 4.5 | 10.4* | 4.8 | 10.0* |
| Marketplace | NA | 2.7* | NA | 10.1* |
| 1Non-elderly adults includes individuals that were ages 18 to 64 throughout the two-year period. *Indicates that the estimate is different from the previous two-year period at p<0.05. Source: Medical Expenditure Panel Survey - Household Component, 2012 to 2014 |
||||
| Insured losing insurance | ||||
| HS diploma/GED or less | Some college or more | |||
| 2012–2013 | 5.3 | 2.5 | ||
| 2013–2014 | 4.3 | 2.3 | ||
| Source: Medical Expenditure Panel Survey - Household Component, 2012 to 2014 | ||||