
|
|
|
Font Size:
|
||||
|
|
|
|
||||
STATISTICAL BRIEF #64:
Family Health Care Expenses, by Income Level, 2002
Highlights
- Overall, about 95 percent of families had some health care expenses, and the total expenses for these families averaged $6,928.
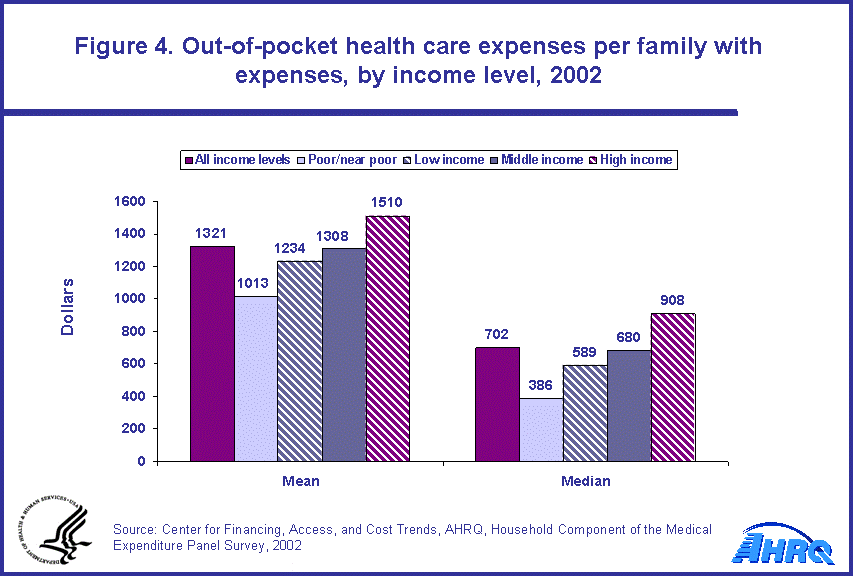
- The average amount of expenses paid out-of-pocket per family with expenses was $1,321.
- Both total and out-of-pocket median expenses were approximately half as large as their respective averages.
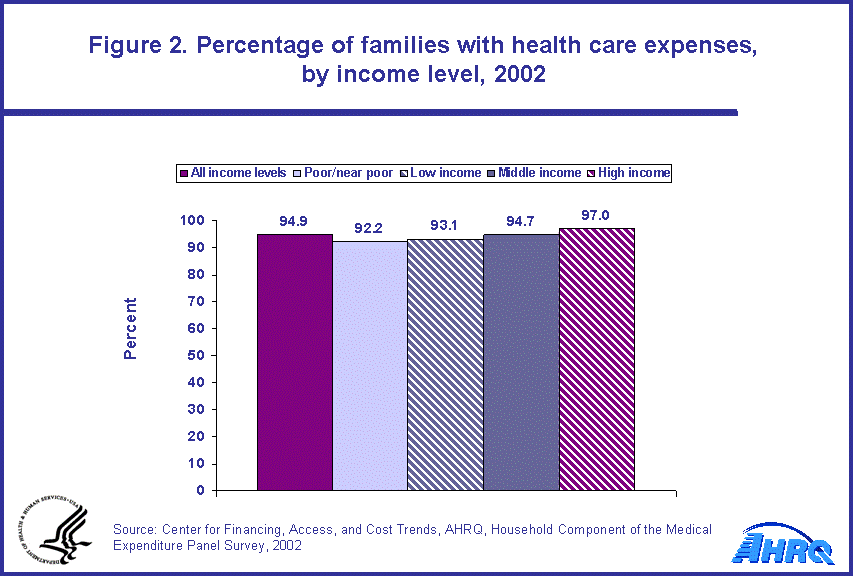
- Poor/near poor families were less likely to have expenses for health care than families with high income levels.
- Among families with some health care expenses, there was no significant variation in mean expenses by family income level, but median expenses were highest for high income families.
- Poor/near poor families tended to have lower out-of-pocket health care expenses than families with higher income levels. The median percentage of total expenses paid out-of-pocket was also lower for poor/near poor families than for higher income families.
Introduction
The Household Component of the Medical Expenditure Panel Survey (MEPS-HC) is designed to produce nationally representative estimates of the health care use, expenditures, sources of payment, and insurance coverage among the United States civilian noninstitutionalized population. Data from the survey are used by statisticians and researchers to generalize to this population as well as to conduct research in which the family is the unit of analysis. Moreover, MEPS-HC is the only source of information available for estimating the total health care expenses that American families incur each year.
Many factors can influence the level of health care expenses for a family, including the size of the family as well as the demographic, socioeconomic, and health status characteristics of family members. Further, the extent to which persons in the family have health insurance coverage can impact both access to care and the average level of family expenditures.
This Statistical Brief provides descriptive statistics on total and out-of-pocket health care expenses in 2002 for families, by family income level. Family units in MEPS-HC include both persons living together in the same household and individuals living on their own. Family income level is classified in this brief into four categories that were derived based on poverty thresholds from the U.S. Census Bureau. In addition to family income, these thresholds take family size, number of children, and age of family members into consideration. All differences discussed in this brief are statistically significant at the 0.05 level.
Findings
In 2002, there were approximately 121 million family households in the United States civilian noninstitutionalized population. In this Statistical Brief, about one-third of family units in MEPS-HC are classified as poor/near poor (18.4 percent) or low income (14.4 percent), while 36.7 percent are classified as having high income levels. (figure 1)
The vast majority of families (about 95 percent) had some health care expenses in 2002. However, families in the poor/near poor category were less likely to have health expenses than those in the high income category (92.2 versus 97.0 percent). (figure 2)
In 2002, the total expenses for families with expenses averaged $6,928 while the median expense ($3,180) was less than half the mean expenditure level (figure 3). The average amount paid out-of-pocket per family with health care expenses was $1,321 while the median of $702 was just over half as large (figure 4). Median health care expenses were substantially lower than mean expenses because a small percentage of families include people who incur a disproportionately large share of total medical expenses.
The variation in mean expenses by income level among families with some expenses was not statistically significant (figure 3). However, median expenses were highest for families in the high income category ($3,587 versus $2,959 or less in other income groups).
The average amount of expenses paid out-of-pocket per family was lower for poor/near poor families ($1,013) than for families in the higher income categories ($1,234 to $1,510) (figure 4). Also, the median percentage of total expenses that was paid out-of-pocket was notably lower for poor/near poor families (16.9) than for higher income families (24.6 to 27.9). (figure 5)
Data Source
The estimates in this Statistical Brief are based upon data from the MEPS 2002 Full-Year Consolidated Data File: HC-070.
Definitions
Family
A family in MEPS-HC generally consists of two or more persons living together in the same household who are related by blood, marriage, or adoption, as well as foster children. Other types of family units include unmarried persons living together who consider and report themselves a family unit and single persons living with neither a relative nor a person identified as a "significant other." Relatives identified as usual residents of the household who were not present at the time of the interview, such as college students living away from their parents' home during the school year, are considered as members of the family that identified them. All families with one or more members living in the community population for any part of the year are included in the estimates.
Expenditures
Total expenses include payments from all sources to hospitals, physicians, other health care providers (including dental care), and pharmacies for services reported by respondents in the MEPS-HC. Sources include direct payments from individuals, private insurance, Medicare, Medicaid, and miscellaneous other sources. Out-of-pocket expenses include payments by individuals and families for services received by all family members during the year.
Income level
Family income is expressed in terms of poverty status, the ratio of the family's income to the Federal poverty thresholds, which control for the size of the family and the age of the head of the family (see the 2002 U.S. Department of Health and Human Services Poverty Guidelines at http://aspe.hhs.gov/poverty/02poverty.htm for more details). In this Statistical Brief, the following classification was used:
- Poor/near poor: Persons in families with income less than 125 percent of the poverty line, including those whose losses exceeded their earnings, resulting in negative income.
- Low income: Persons in families with income from 125 percent to less than 200 percent of the poverty line.
- Middle income: Persons in families with income from 200 percent to less than 400 percent of the poverty line.
- High income: Persons in families with income at or over 400 percent of the poverty line.
About MEPS-HC
MEPS-HC is a nationally representative longitudinal survey that collects detailed information on health care utilization and expenditures, health insurance, and health status, as well as a wide variety of social, demographic, and economic characteristics for the civilian noninstitutionalized population. It is cosponsored by the Agency for Healthcare Research and Quality and the National Center for Health Statistics.
For details on how to create family-level estimates, see the documentation for any MEPS full-year person-level public use file (e.g., HC-070 for 2002 estimates presented in this Statistical Brief).
For more information about MEPS, call the MEPS information coordinator at AHRQ (301-427-1406) or visit the MEPS Web site at http://www.meps.ahrq.gov/.
References
For a detailed description of the MEPS-HC survey design, sample design, and methods used to minimize sources on nonsampling error, see the following publications:
Cohen, J. Design and Methods of the Medical Expenditure Panel Survey Household Component. MEPS Methodology Report No. 1. AHCPR Pub. No. 97-0026. Rockville, Md.: Agency for Health Care Policy and Research, 1997.
Cohen, S. Sample Design of the 1996 Medical Expenditure Panel Survey Household Component. MEPS Methodology Report No. 2. AHCPR Pub. No. 97-0027. Rockville, Md.: Agency for Health Care Policy and Research, 1997.
Suggested Citation
Machlin, S. R. and Zodet, M. W. Family Health Care Expenses, by Income Level, 2002. Statistical Brief #64. January 2005. Agency for Healthcare Research and Quality, Rockville, MD. http://meps.ahrq.gov/mepsweb/data_files/publications/st64/stat64.shtml
 |
||||||||||||||||||||||||
|
||||||||||||||||||||||||
|
|
||||||||||||||||||||||||
 |
||||||||||||||||||||||||
|
||||||||||||||||||||||||
|
|
||||||||||||||||||||||||
 |
||||||||||||||||||||||||
|
||||||||||||||||||||||||
|
|
||||||||||||||||||||||||
 |
||||||||||||||||||||||||
|
||||||||||||||||||||||||
|
|
||||||||||||||||||||||||
 |
||||||||||||||||||||||||
|
||||||||||||||||||||||||
|
|
||||||||||||||||||||||||