
|
|
|
Font Size:
|
||||
|
|
|
|
||||
STATISTICAL BRIEF #83:
The Uninsured in America, 2004: Estimates for the U.S. Civilian Noninstitutionalized Population under Age 65
Highlights
- In early 2004, 16.8 percent of the U.S. civilian noninstitutionalized population (48.3 million people) was uninsured. Among those under age 65, 19.0 percent (48.1 million people) were uninsured. These estimates do not differ significantly from the comparable figures for 2003.
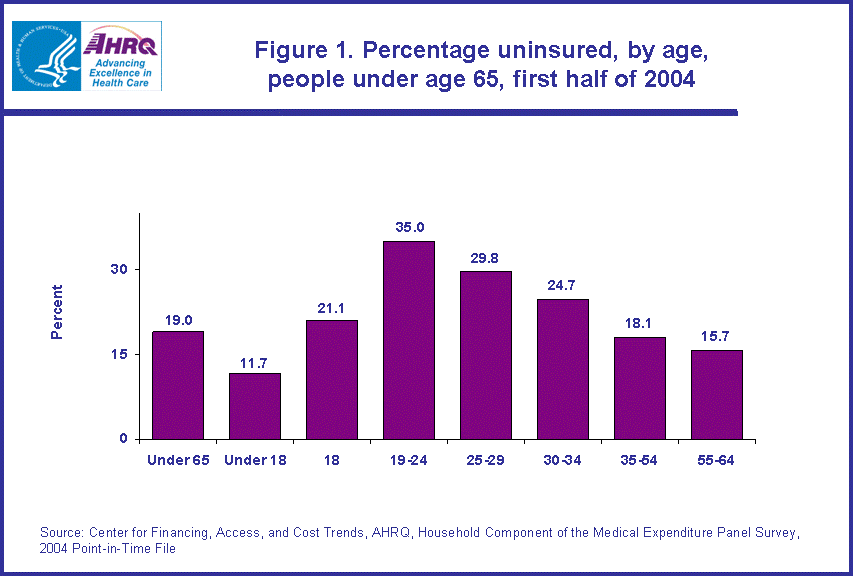
- Young adults age 19 to 24 were the age group at the greatest risk of being uninsured, with 35.0 percent of this group lacking health insurance.
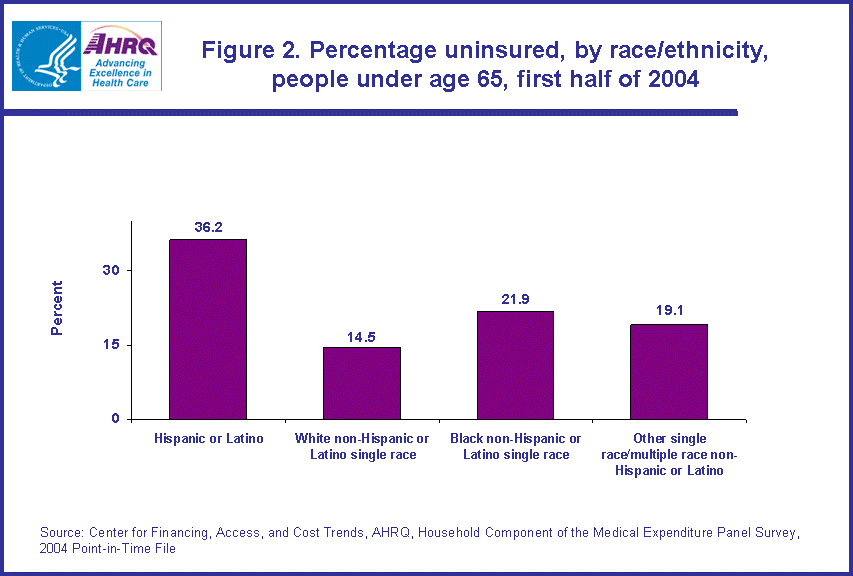
- Among those under age 65, 36.2 percent of Hispanics or Latinos, 21.9 percent of black non-Hispanics or Latinos single race, and 19.1 percent of other single race/multiple race non-Hispanics or Latinos, were uninsured during the first half of 2004 compared with 14.5 percent of white non-Hispanics or Latinos single race.
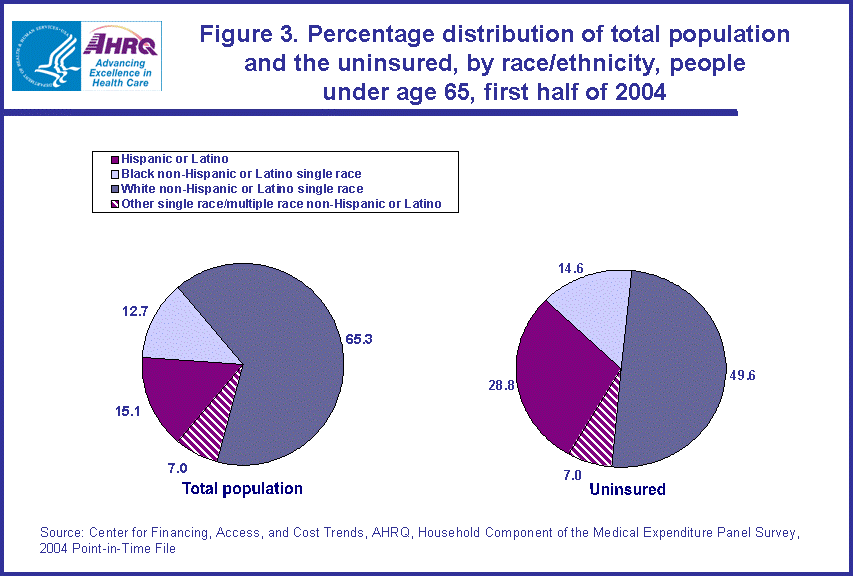
- Among people under age 65, Hispanics or Latinos accounted for 28.8 percent of the uninsured civilian noninstitutionalized population even though they represented only 15.1 percent of the overall population this age.
Introduction
The uninsured population in the United States is an issue of public policy concern for several reasons. First, health insurance is viewed as necessary to ensure that people have access to medical care and protection against the risk of costly and unforeseen medical events. Second, timely and reliable estimates of the population's health insurance status are vital to evaluate the costs and expected impact of public policy interventions to expand coverage or to change the way that private and public insurance is funded. Finally, comparisons of the characteristics of insured and uninsured populations over time provide information on whether greater parity has been achieved in insurance coverage or whether serious gaps remain.
Estimates from the Household Component of the 2004 Medical Expenditure Panel Survey (MEPS-HC) show that health insurance status among people under age 65 varies according to demographic characteristics, such as age, race/ethnicity, sex, and marital status. This Statistical Brief shows the estimated size of the civilian noninstitutionalized population under age 65 that was uninsured throughout the first half of 2004 and identifies groups especially at risk of lacking health insurance. All differences between estimates discussed in the text are statistically significant at the 0.05 level unless otherwise noted.
Findings
In early 2004, 16.8 percent of the U.S. civilian noninstitutionalized population (48.3 million people) were uninsured (estimate not shown). Among those less than age 65, 19.0 percent (48.1 million people) were uninsured. Age plays a key role in whether a person has health insurance coverage. Young adults age 19 to 24, 35.0 percent of whom were uninsured, were the age group at the greatest risk of being uninsured (figure 1). This group represents 9.5 percent of the total non-elderly population but 17.5 percent of the uninsured population (estimates not shown). For children (under age 18), 29.4 percent had public insurance only, 11.7 percent were uninsured, and the remainder (58.9 percent) had private insurance; this compares to 27.5, 11.9, and 60.6 percent, respectively, for 2003 (estimates not shown). For children, estimates between the two years are not significantly different.
Minorities were substantially more likely than whites to lack health insurance. Among people under age 65, 36.2 percent of Hispanics or Latinos, 21.9 percent of black non-Hispanics or Latinos single race, and 19.1 percent of other single race/multiple race non-Hispanics or Latinos were uninsured during the first half of 2004 compared with 14.5 percent of white non-Hispanics or Latinos single race. (figure 2)
Hispanics or Latinos were disproportionately represented among the uninsured. Although 15.1 percent of non-elderly Americans were Hispanic or Latino, they accounted for 28.8 percent of uninsured persons. (figure 3)
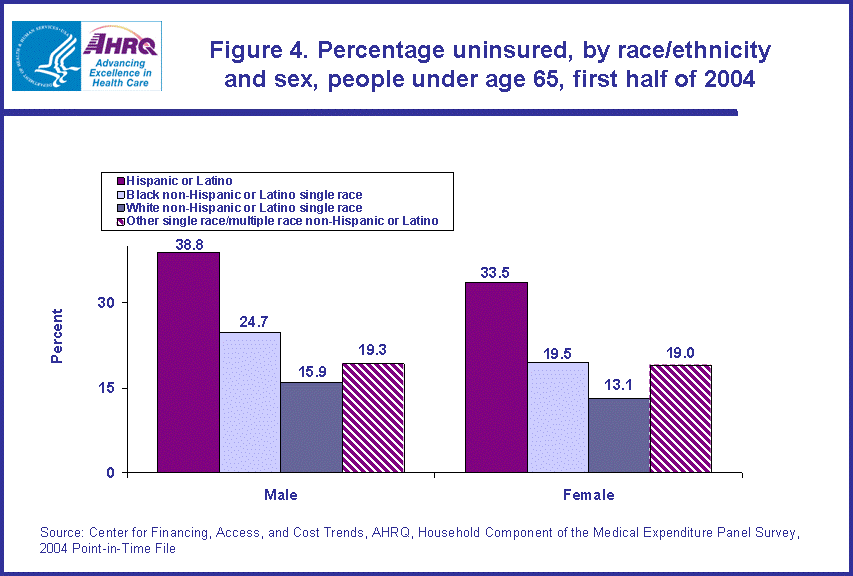
Among males under age 65, being uninsured was more likely among Hispanics or Latinos (38.8 percent) than among black non-Hispanics or Latinos single race (24.7 percent), white non-Hispanics or Latinos single race (15.9 percent), or other single race/multiple race non-Hispanics or Latinos (19.3 percent). Similarly, among females under age 65, being uninsured was more likely among Hispanics or Latinos (33.5 percent) than among black non-Hispanics or Latinos single race (19.5 percent), white non-Hispanics or Latinos single race (13.1 percent), or other single race/multiple race non-Hispanics or Latinos (19.0 percent). (figure 4)
Persons who never married accounted for 24.1 percent of the non-elderly population but 37.5 percent of the uninsured population (estimates not shown). People who were married were the least likely to be uninsured: 15.4 percent of all persons under 65 who were married were uninsured. (figure 5)
Data Source
The estimates shown in this Statistical Brief are drawn from analyses conducted by the MEPS staff from the following public use file: HC-075 (July 2005).
Definitions
The uninsured were defined as people not covered by Medicare, TRICARE (Armed Forces-related coverage), Medicaid, other public hospital/physician programs, or private hospital/physician insurance (including Medigap coverage) from January 2004 through the MEPS-HC interview date. People covered only by noncomprehensive State-specific programs (e.g., Maryland Kidney Disease Program) or private single service plans (e.g., coverage for dental or vision care only, coverage for accidents or specific diseases) were considered to be uninsured.
About MEPS-HC
MEPS-HC is a nationally representative longitudinal survey that collects detailed information on health care utilization and expenditures, health insurance, and health status, as well as a wide variety of social, demographic, and economic characteristics for the civilian noninstitutionalized population. It is cosponsored by the Agency for Healthcare Research and Quality and the National Center for Health Statistics.
For more information about MEPS, call the MEPS information coordinator at AHRQ (301-427-1656) or visit the MEPS Web site at http://www.meps.ahrq.gov/.
References
For a detailed description of the MEPS-HC survey design, sample design, and methods used to minimize sources on nonsampling error, see the following publications:
Cohen, J. Design and Methods of the Medical Expenditure Panel Survey Household Component. MEPS Methodology Report No. 1. AHCPR Pub. No. 97-0026. Rockville, Md.: Agency for Health Care Policy and Research, 1997.
Cohen, S. Sample Design of the 1996 Medical Expenditure Panel Survey Household Component. MEPS Methodology Report No. 2. AHCPR Pub. No. 97-0027. Rockville, Md.: Agency for Health Care Policy and Research, 1997.
Cohen, S. Design Strategies and Innovations in the Medical Expenditure Panel Survey. Medical Care, July 2003: 41(7) Supplement: III-5-III-12.
Suggested Citation
Rhoades, J. A. The Uninsured in America, 2004: Estimates for the U.S. Civilian Noninstitutionalized Population under Age 65. Statistical Brief #83. June 2005. Agency for Healthcare Research and Quality, Rockville, Md. http://www.meps.ahrq.gov/mepsweb/data_files/publications/st83/stat83.shtml
 |
||||||||||||||||||||||||||||||||||||
|
||||||||||||||||||||||||||||||||||||
|
|
||||||||||||||||||||||||||||||||||||
 |
||||||||||||||||||||||||||||||||||||
|
||||||||||||||||||||||||||||||||||||
|
|
||||||||||||||||||||||||||||||||||||
 |
||||||||||||||||||||||||||||||||||||
|
||||||||||||||||||||||||||||||||||||
|
|
||||||||||||||||||||||||||||||||||||
 |
||||||||||||||||||||||||||||||||||||
|
||||||||||||||||||||||||||||||||||||
|
|
||||||||||||||||||||||||||||||||||||
 |
||||||||||||||||||||||||||||||||||||
|
||||||||||||||||||||||||||||||||||||
|
|
||||||||||||||||||||||||||||||||||||