
|
|
|
Font Size:
|
||||
|
|
|
|
||||
STATISTICAL BRIEF #93:
Health Care Expenditures for Injury-Related Conditions, 2002
Highlights
- About 1 of every 10 dollars spent for medical care services in 2002 were for conditions associated with accidents and injuries (excluding dental care and other miscellaneous expenses).
- Emergency department and home health care accounted for substantially larger shares of injury-related than non-injury-related health care expenses. Conversely, prescribed medicines accounted for a much smaller proportion of injury-related expenses.
- Workers' Compensation paid for a negligible portion of non-injury-related expenses but accounted for approximately 1 of every 10 dollars spent for injury-related health care.
- Motor vehicle accidents accounted for the largest portion of health care expenses for injuries, followed by sports injuries and falls.
Introduction
This Statistical Brief presents estimates from the Household Component of the 2002 Medical Expenditure Panel Survey (MEPS-HC) of spending for direct medical care for health conditions resulting from accidents and injuries (excluding dental care and other miscellaneous expenses). These expenses for injury-related care are presented by type of service and source of payment categories, and distributions are compared to those for non-injury-related care. Expenses for injury-related care are also presented for broad categories of injury cause.
The estimates are representative of the U.S. civilian noninstitutionalized population and are based on household-reported data on conditions resulting from injury and associated medical care received for those conditions. Expenses for treatment during the year are included regardless of whether the injury occurred in 2002 or earlier. Only differences between estimates that are statistically significant at the 0.05 level are noted in the text.
Findings
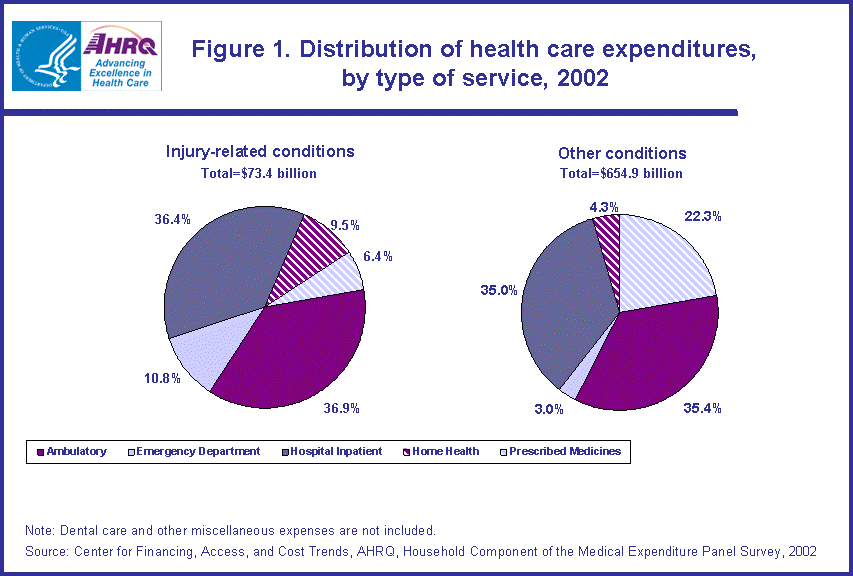
About $73.4 billion was spent on treatment for injury-related conditions for the U.S. civilian noninstitutionalized population during 2002 (figure 1). This accounted for about 1 of every 10 dollars spent (10.1 percent) for medical care services (excluding dental care and other miscellaneous expenses--see Definitions section below).
Type of service
The distribution of injury-related health care expenses by type of service differed from the distribution for health care expenses that were not injury related (figure 1). In particular, the proportion of expenses for emergency department care was more than three times greater for injury-related care (10.8 percent versus 3.0 percent for non-injury-related expenses) and more than twice as large for home health care (9.5 percent versus 4.3 percent for non-injury-related expenses). Conversely, prescribed medicines accounted for a much smaller proportion of injury-related expenses (6.4 percent versus 22.3 percent for non-injury-related expenses).
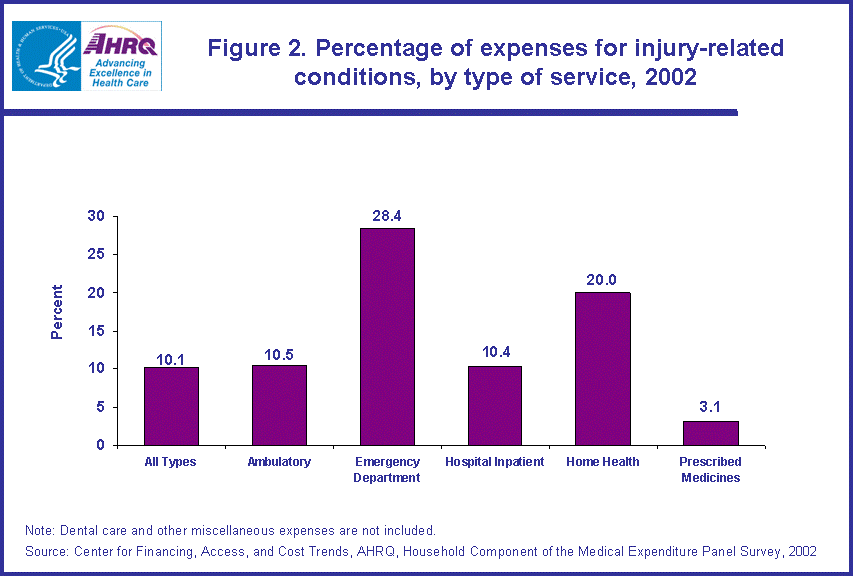
The percentage of expenses associated with injuries ranged from only 3.1 percent of all prescribed medicine expenditures to one-fifth of all home health care expenses and more than one-quarter of all emergency department expenses (figure 2).
Source of payment
The distribution of injury-related health care expenses by source of payment also differed from the distribution for health care expenses that were not injury related (figure 3). In particular, Workers' Compensation paid for only a negligible portion of non-injury-related expenses (0.8 percent) but accounted for about 10 percent of injury-related expenses. Private insurance and out-of-pocket payments accounted for smaller proportions of injury-related than other expenses (35.4 versus 42.9 percent for private insurance; 10.2 versus 16.1 percent for out-of-pocket payments).
Less than 10 percent of all out-of-pocket payments (6.6 percent) and of all private insurance payments (8.5 percent) were for injury-related care (figure 4). In contrast, 57.3 percent of all payments made by Worker's Compensation programs were for injury-related care.
Cause of injury
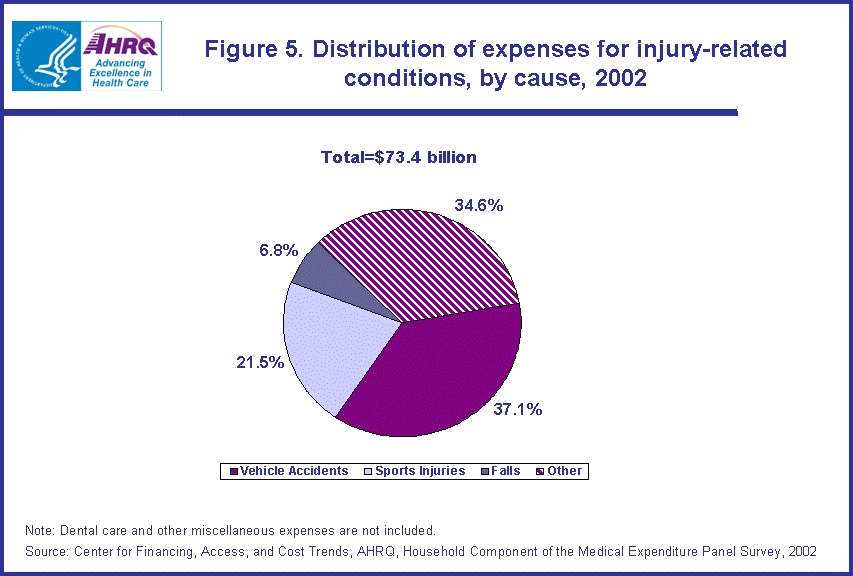
In 2002, motor vehicle accidents accounted for the largest portion of health care expenses for injuries (37.1 percent), followed by sports injuries (21.5 percent) and falls (6.8 percent) (figure 5). The remaining 34.6 percent of injury-related expenses were associated with a variety of factors, including weapons, poisonings, fire, water accidents, and other miscellaneous causes.
Data Source
The estimates in this Statistical Brief are based upon data from the 2002 MEPS Full Year Consolidated Data File (HC-070), Medical Conditions Data File (HC-069), and Medical Events Files (HC-067A and HC-067D-G).
Definitions
Injury-related condition
For each medical condition identified in either the Condition Enumeration, Medical Events, or Disability Days sections of the MEPS questionnaire, respondents were asked whether the condition was due to an accident or injury. Conditions for which there was a positive response to this question were classified as injury-related.
Expenditures
Expenditures (also referred to as expenses) for injuries include payments from all sources to hospitals, physicians, other medical care providers, and pharmacies for services received for injury-related conditions reported by respondents in the MEPS-HC. Sources include direct payments from individuals, private insurance, Medicare, Medicaid, Workers' Compensation, and miscellaneous other sources. Expenditures for hospital-based services include those for both facility and separately billed physicians' services. MEPS does not collect data on payments for over-the-counter-drugs, alternative care services, or telephone contacts with medical providers.
Expenses for treatment during the year are included regardless of whether the injury occurred in 2002 or earlier. Moreover, expenses for injuries may be slightly overstated since some medical events that were identified as associated with an accident/injury may have also involved care for other conditions that were not related to the accident/injury.
In contrast to complete MEPS expenditure estimates, this brief excludes expenses for dental services, durable medical equipment, and other miscellaneous items (eyeglasses, contact lenses, ambulance services, orthopedic items, hearing devices, prostheses, bathroom aids, medical equipment, disposable supplies, and other miscellaneous items or services) because it was not possible to determine from the 2002 survey questions which of these expenses were associated with injuries.
Type of service
The following categories of expenses are included in this brief:
- Hospital inpatient services: This category includes room and board and all hospital diagnostic and laboratory expenses associated with the basic facility charge, payments for separately billed physician inpatient services, and some emergency room expenses incurred immediately prior to inpatient stays.
- Ambulatory services: This category includes expenses for visits to medical providers seen in office-based settings as well as expenses for visits to both physicians and other medical providers seen in hospital outpatient departments, including payments for services covered under the basic facility charge and those for separately billed physician services.
- Emergency department services: This category includes payments for services covered under the basic facility charge and those for separately billed physician services but excludes expenses for emergency room services followed by a hospital admission.
- Prescribed medicines: This category includes expenses for all prescribed medications that were initially purchased or refilled during the year, as well as expenses for diabetic supplies.
- Home health services: This category includes expenses for care provided by home health agencies and independent home health providers. Agency providers accounted for a large majority of the expenses in this category.
- Out-of-pocket: This category includes expenses paid by the user or other family member.
- Private insurance: This category includes payments made by insurance plans covering hospital and medical care (excluding payments from Medicare, Medicaid, and other public sources). Payments from Medigap plans or TRICARE (Armed Forces-related coverage) are included. Payments from plans that provide coverage for a single service only, such as dental or vision coverage, are not included.
- Medicare: Medicare is a federally financed health insurance plan for the elderly, persons receiving Social Security disability payments, and most persons with end-stage renal disease. Medicare Part A, which provides hospital insurance, is automatically given to those who are eligible for Social Security. Medicare Part B provides supplementary medical insurance that pays for medical expenses and can be purchased for a monthly premium.
- Medicaid: Medicaid is a means-tested government program jointly financed by Federal and State funds that provides health care to those who are eligible. Program eligibility criteria vary significantly by State, but the program is designed to provide health coverage to families and individuals who are unable to afford necessary medical care.
- Workers' Compensation: Workers' Compensation is a system, required by law, of compensating workers injured or disabled in connection with work. This system establishes the liability of an employer for injuries or sickness arising over and in the course of employment. The benefits under this system generally include hospital and other medical payments and compensation for loss of income.
- Other sources: This category includes payments from the Department of Veterans Affairs (except TRICARE); other Federal sources (Indian Health Service, military treatment facilities, and other care provided by the Federal Government); various State and local sources (community and neighborhood clinics, State and local health departments, and State programs other than Medicaid); various unclassified sources (e.g., automobile, homeowner's, or other liability insurance, and other miscellaneous or unknown sources); Medicaid payments reported for persons who were not reported as enrolled in the Medicaid program at any time during the year; and private insurance payments reported for persons without any reported private health insurance coverage during the year.
About MEPS-HC
MEPS-HC is a nationally representative longitudinal survey that collects detailed information on health care utilization and expenditures, health insurance, and health status, as well as a wide variety of social, demographic, and economic characteristics for the civilian noninstitutionalized population. It is cosponsored by the Agency for Healthcare Research and Quality and the National Center for Health Statistics.
For more information about MEPS, call the MEPS information coordinator at AHRQ (301-427-1656) or visit the MEPS Web site at http://www.meps.ahrq.gov/.
References
For a detailed description of the MEPS survey design, sample design, and methods used to minimize sources of nonsampling error, see the following publications:
Cohen, J. Design and Methods of the Medical Expenditure Panel Survey Household Component. MEPS Methodology Report No. 1. AHCPR Pub. No. 97-0026. Rockville, Md.: Agency for Health Care Policy and Research, 1997.
Cohen, S. Sample Design of the 1996 Medical Expenditure Panel Survey Household Component. MEPS Methodology Report No. 2. AHCPR Pub. No. 97-0027. Rockville, Md.: Agency for Health Care Policy and Research, 1997.
Cohen, S. Design Strategies and Innovations in the Medical Expenditure Panel Survey. Medical Care, July 2003: 41(7) Supplement: III-5-III-12.
Suggested Citation
Machlin, S. Health Care Expenditures for Injury-Related Conditions, 2002. Statistical Brief #93. August 2005. Agency for Healthcare Research and Quality, Rockville, Md. http://meps.ahrq.gov/mepsweb/data_files/publications/st93/stat93.shtml
AHRQ welcomes questions and comments from readers of this publication who are interested in obtaining more information about access, cost, use, financing, and quality of health care in the United States. We also invite you to tell us how you are using this Statistical Brief and other MEPS data and tools and to share suggestions on how MEPS products might be enhanced to further meet your needs. Please e-mail us at mepspd@ahrq.gov or send a letter to the address below:
Steven B. Cohen, PhD
Director
Center for Financing, Access, and Cost Trends
Agency for Healthcare Research and Quality
540 Gaither Road
Rockville, MD 20850
 |
|||||||||||||||||||||||||||||||||||
|
|||||||||||||||||||||||||||||||||||
|
|
|||||||||||||||||||||||||||||||||||
 |
|||||||||||||||||||||||||||||||||||
|
|||||||||||||||||||||||||||||||||||
|
|
|||||||||||||||||||||||||||||||||||
 |
|||||||||||||||||||||||||||||||||||
|
|||||||||||||||||||||||||||||||||||
|
|
|||||||||||||||||||||||||||||||||||
 |
|||||||||||||||||||||||||||||||||||
|
|||||||||||||||||||||||||||||||||||
|
|
|||||||||||||||||||||||||||||||||||
 |
|||||||||||||||||||||||||||||||||||
|
|||||||||||||||||||||||||||||||||||
|
|
|||||||||||||||||||||||||||||||||||