|
|
Font Size:
|
||||
|
|
|
|
||||
STATISTICAL BRIEF #102:
Prescription Drugs: Out-of-Pocket Expenses and Unmet Need Relative to Family Income, 2002
Highlights
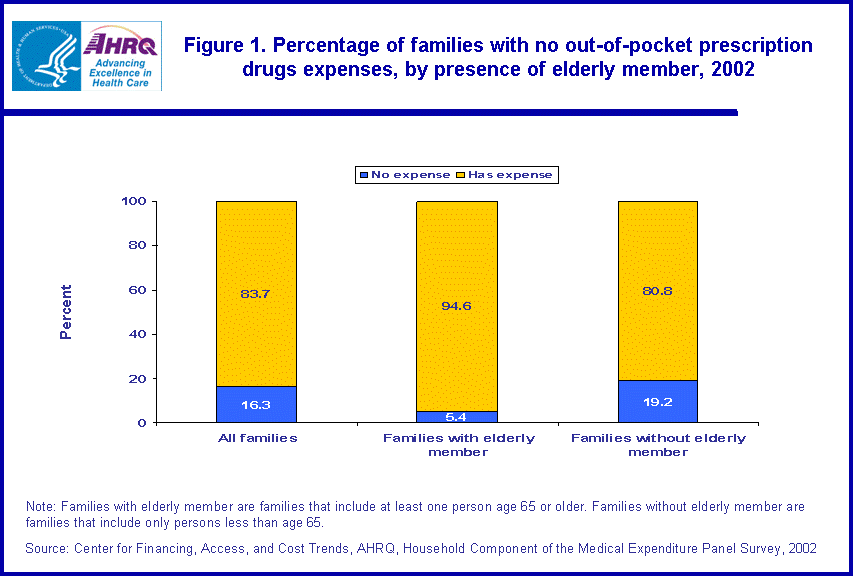
- Families without an elderly member were more than three times as likely not to have an out-of-pocket expense for prescription drugs (19.2 percent) than families with an elderly member (5.4 percent) during 2002.
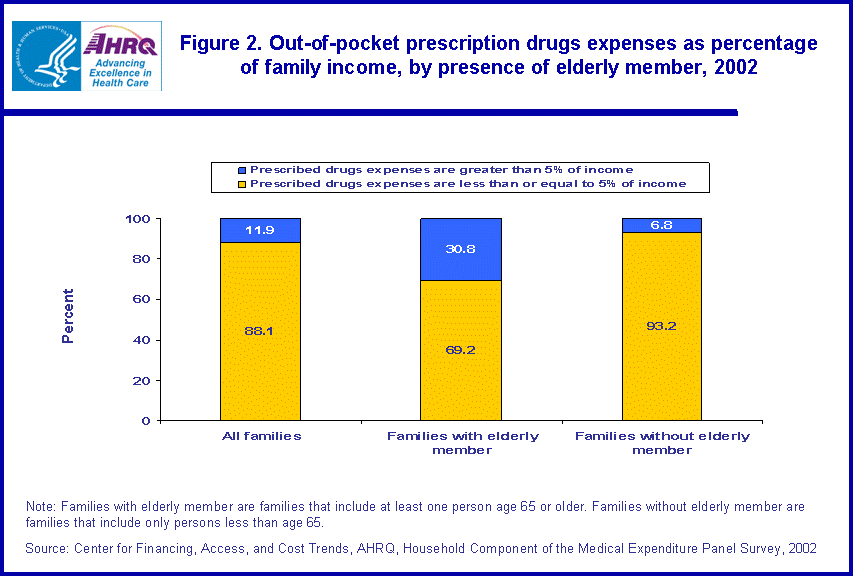
- Families with an elderly member had prescribed drugs out-of-pocket expenses that accounted for greater than 5 percent of family income at a much greater rate (30.8 percent) than families without an elderly member (6.8 percent).
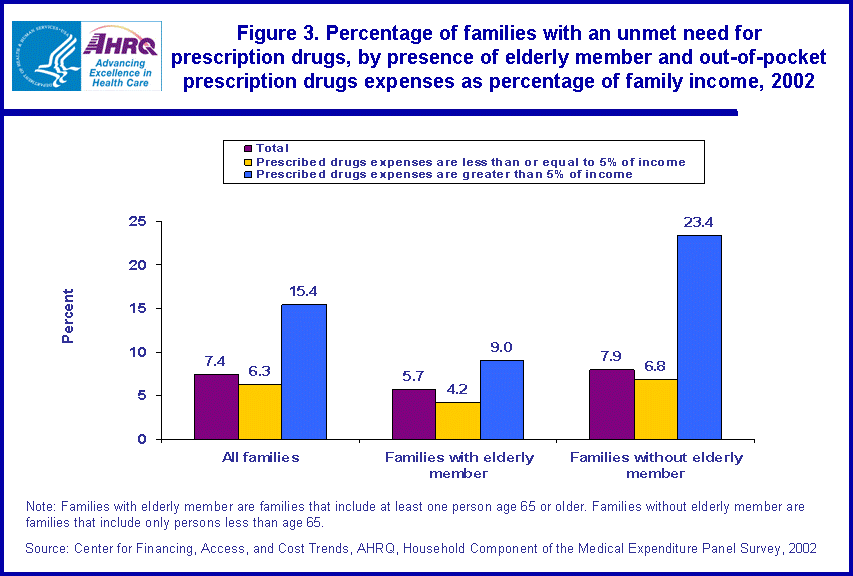
- Families who spent greater than 5 percent of their income on out-of-pocket expenses for prescribed drugs were more likely to report an unmet need (15.4 percent) than families who spent less than or equal to 5 percent of their income (6.3 percent).
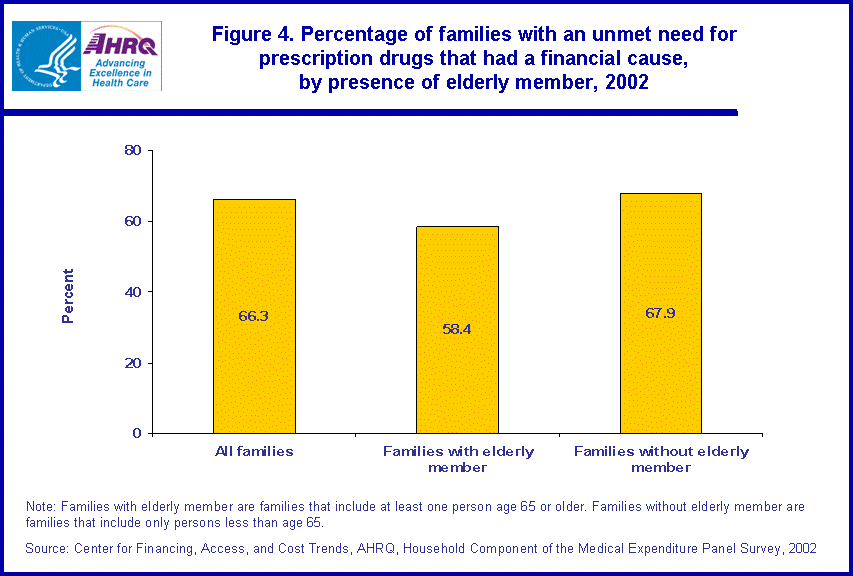
- The majority of families with an unmet need during 2002 reported a financial cause as the sole or partial reason for the problem (66.3 percent).
Introduction
This Statistical Brief discusses out-of-pocket expenses and unmet need related to obtaining prescription drugs for the U.S. civilian noninstitutionalized (community) population in 2002. The analysis examines these topics relative to family income for families with out-of-pocket expenses less than or equal to 5 percent of income and for those with expenses greater than 5 percent of income. Results are provided separately for families with an elderly member (a person age 65 or older) and for families without an elderly member.
The data used to develop these estimates are derived from the Household Component of the Medical Expenditure Panel Survey (MEPS-HC) for 2002. Income and expense estimates are based on annual totals for 2002. All differences between estimates discussed in the text are statistically significant at the 0.05 level.
Findings
About 16 percent of all families did not have an out-of-pocket expense for prescription drugs in 2002 (figure 1). Families without an elderly member were more than three times as likely not to have an out-of-pocket expense (19.2 percent) than families with an elderly member (5.4 percent). Slightly more than one-fifth of all families included at least one elderly person.
Nearly 9 of 10 families had out-of-pocket expenses less than or equal to 5 percent of income, including those with no expenses (figure 2). Overall, 11.9 percent of families reported having out-of-pocket prescription drug expenses totaling greater than 5 percent of income in 2002. However, families with an elderly member had out-of-pocket expenses that accounted for greater than 5 percent of family income at a much greater rate (30.8 percent) than families without an elderly member (6.8 percent).
In 2002, an unmet need for prescription drugs was a problem for 7.4 percent of families, either because a family member was unable to get the needed prescription or because a member experienced a delay in getting a prescription (figure 3). Families who spent greater than 5 percent of their income on out-of-pocket expenses for prescribed drugs were more likely to report an unmet need (15.4 percent) than families who spent less than or equal to 5 percent of their income (6.3 percent). Close to one-fourth (23.4 percent) of families without an elderly member that spent greater than 5 percent of their income on out-of-pocket expenses for prescription drugs reported having an unmet need. This contrasts with only 9.0 percent of families with an elderly member that had out-of-pocket expenses for prescribed drugs equaling greater than 5 percent of their income having an unmet need. For families spending less than or equal to 5 percent of their income on out-of-pocket drug expenses, families without an elderly member were also more apt to have an unmet need (6.8 percent) than families with an elderly member (4.2 percent).
The majority of families with an unmet need for prescription drugs during 2002 reported a financial cause as the sole or partial reason for the problem (66.3 percent) (figure 4). This was true for both families with an elderly member and those without an elderly member. (See Definitions section below for a list of financial causes.)
Definitions
For purposes of this analysis, families reporting annual income of less than or equal to zero dollars in 2002--1.5 percent of all families--had their income reset to $100 for the year. This allowed for computing a meaningful estimate of the ratio of out-of-pocket prescription drug costs to income for those families. Also, about 1 percent of families did not provide information on whether they had any unmet need for prescription drugs in 2002. Therefore, estimates in this analysis on unmet need assume that those families with missing information had the same pattern regarding unmet need as families who did provide such information.
Family
A family in MEPS-HC generally consists of two or more persons living together in the same household who are related by blood, marriage, or adoption, as well as foster children. Other types of family units include unmarried persons living together who consider and report themselves a family unit and single persons living with neither a relative nor a person identified as a "significant other." Relatives identified as usual residents of the household who were not present at the time of the interview, such as college students living away from their parents' home during the school year, are considered as members of the family that identified them. All families with one or more members living in the civilian noninstitutionalized population for any part of the year are included in the estimates.
- Family with an elderly member: A family in which at least one member was age 65 or older. There were 25.9 million families with an elderly member in 2002, who made up 21.4 percent of all families.
- Family without an elderly member: A family containing no person age 65 or older. There were 95.1 million families without an elderly member in 2002, who made up 78.6 percent of all families.
Family income is the sum of the income of each person in the family. Each person's income may include any of the following components: Annual earnings from wages, salaries, bonuses, tips, commissions; business and farm gains and losses; unemployment and workers' compensation; interest and dividends; alimony, child support, and other private cash transfers; private pensions, IRA withdrawals, social security, and veterans' payments; supplemental security income and cash welfare payments from public assistance, Temporary Assistance for Needy Families, and related programs; gains or losses from estates, trusts, partnerships, S corporations, rent, and royalties; and "other" income. Income excludes tax refunds and capital gains.
Unmet need for prescription drugs
In the last 12 months, at least one family member reported that he or she was unable to obtain prescription drugs or was delayed in obtaining prescription drugs that either the person or a doctor believed necessary.
- Financial cause: At least one family member reported an unmet need for prescription drugs due to 1) not being able to afford care; 2) a health insurance plan that would not cover, approve, or pay for care; or 3) a physician who refused to accept the health insurance plan in which the family member was enrolled.
- Other cause: No family member reported a financial cause for unmet need, but reported another reason for the unmet need, such as having a problem getting to the doctor's office.
About MEPS-HC
MEPS-HC is a nationally representative longitudinal survey that collects detailed information on health care utilization and expenditures, health insurance, and health status, as well as a wide variety of social, demographic, and economic characteristics for the civilian noninstitutionalized population. It is cosponsored by the Agency for Healthcare Research and Quality and the National Center for Health Statistics.
For more information about MEPS, call the MEPS information coordinator at AHRQ (301-427-1656) or visit the MEPS Web site at http://www.meps.ahrq.gov/.
References
For a detailed description of the MEPS survey design, sample design, and methods used to minimize sources of nonsampling error, see the following publications:
Cohen, J. Design and Methods of the Medical Expenditure Panel Survey Household Component. MEPS Methodology Report No. 1. AHCPR Pub. No. 97-0026. Rockville, Md.: Agency for Health Care Policy and Research, 1997.
Cohen, S. Sample Design of the 1996 Medical Expenditure Panel Survey Household Component. MEPS Methodology Report No. 2. AHCPR Pub. No. 97-0027. Rockville, Md.: Agency for Health Care Policy and Research, 1997.
Cohen, S. Design Strategies and Innovations in the Medical Expenditure Panel Survey. Medical Care, July 2003: 41(7) Supplement: III-5-III-12.
Suggested Citation
Crimmel, B. L. and Stagnitti, M. N. Prescription Drugs: Out-of-Pocket Expenses and Unmet Need Relative to Family Income, 2002. Statistical Brief #102. October 2005. Agency for Healthcare Research and Quality, Rockville, MD. http://meps.ahrq.gov/mepsweb/data_files/publications/st102/stat102.shtml
AHRQ welcomes questions and comments from readers of this publication who are interested in obtaining more information about access, cost, use, financing, and quality of health care in the United States. We also invite you to tell us how you are using this Statistical Brief and other MEPS data and tools and to share suggestions on how MEPS products might be enhanced to further meet your needs. Please e-mail us at mepspd@ahrq.gov or send a letter to the address below:
Steven B. Cohen, PhD
Director
Center for Financing, Access, and Cost Trends
Agency for Healthcare Research and Quality
540 Gaither Road
Rockville, MD 20850
 |
||||||||||||||||||||||||
|
||||||||||||||||||||||||
|
|
||||||||||||||||||||||||
 |
||||||||||||||||||||||||
|
||||||||||||||||||||||||
|
|
||||||||||||||||||||||||
 |
||||||||||||||||||||||||
|
||||||||||||||||||||||||
|
|
||||||||||||||||||||||||
 |
||||||||||||||||||||||||
|
||||||||||||||||||||||||
|
|
||||||||||||||||||||||||


