
|
|
Font Size:
|
||||
|
|
|
|
||||
STATISTICAL BRIEF #105:
Diabetes Management: Tests and Treatments among the 18 and Older U.S. Civilian Noninstitutionalized Population in 2003
Highlights
- In 2003, 6.6 percent of the U.S. civilian noninstitutionalized population over 18 (14.2 million people) reported being diabetic.
- Men and women had comparable reported rates of diagnosed diabetes (6.6 percent versus 6.7 percent, respectively).
- The reported rate of diagnosed diabetes for those age 65 and older (16.6 percent) was 3.5 times as likely as the rate for those age 18 to 64 (4.7 percent).
- Non-Hispanic blacks had higher rates of reported diagnosed diabetes than Hispanics or non-Hispanic whites (9.5 percent versus 6.5 percent and 6.1 percent, respectively).
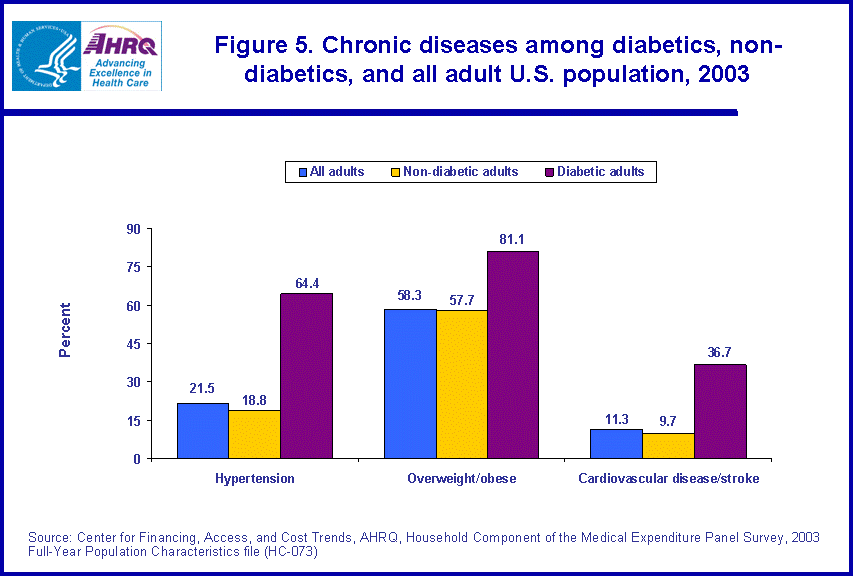
- Adults reported to having been diagnosed with diabetes were three times as likely to have cardiovascular disease or stroke as the overall adult population.
Introduction
Diabetes mellitus is a group of diseases characterized by high levels of blood glucose resulting from defects in insulin production, insulin action, or both. Diabetes is associated with a number of other health problems, including heart disease, stroke, high blood pressure, kidney disease, and blindness. If diagnosed and treated effectively, these complications and comorbidities could be delayed or treated.
This Statistical Brief uses data from the Household Component of the 2003 Medical Expenditure Panel Survey (MEPS-HC) to estimate the health status, preventive health practices, and treatment regimens of adults who reported having been diagnosed with diabetes. Rates at which persons with diabetes obtain preventive medical care and recommended tests are presented.
It should be noted that all references to diabetics in this brief refer to those reported to have ever been diagnosed with this disease by a physician. All comparisons discussed in the text are statistically significant at the .05 level unless otherwise noted.
Findings
Diabetes can affect many parts of the body and can lead to serious complications, such as blindness, kidney damage, and lower-limb amputations. Working together, people with diabetes and their health care providers can reduce the occurrence of these and other diabetic complications by monitoring and controlling the levels of blood glucose, blood pressure, and blood lipids. Among several methods of monitoring and controlling are the yearly hemoglobin A1c test, dilated eye exams, and foot exams for all diabetics.
Demographics
In 2003, 6.6 percent of the adult U.S. civilian noninstitutionalized population (14.2 million) was reported to be diabetic. Men and women had comparable reported rates of diagnosed diabetes (6.6 percent versus 6.7 percent, respectively).
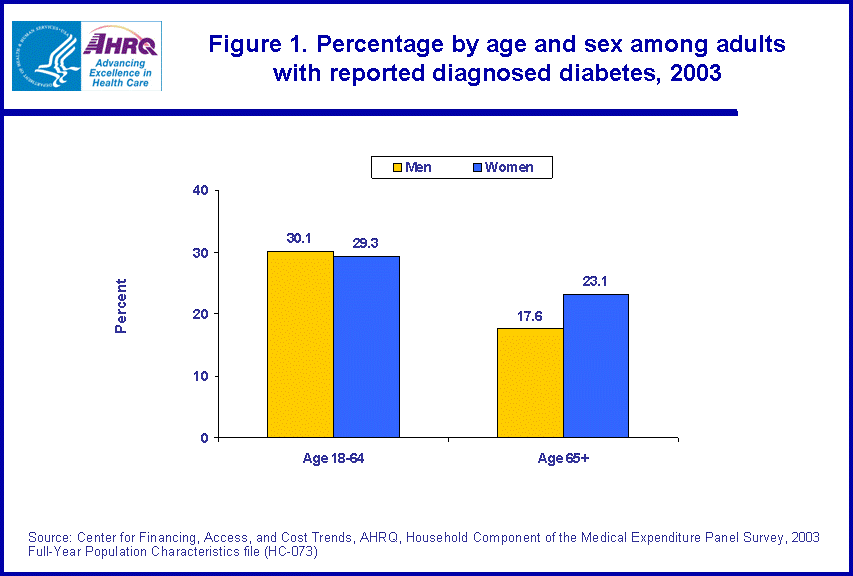
Diabetes was found to be strongly correlated with age. The reported rate of diagnosed diabetes for those aged 65 and older (16.6 percent) was 3.5 times as likely as the rate for those aged 18 to 64 (4.7 percent). When men and women were compared, even though the percentages were similar for the 18-64 age group (30.1 percent of men versus 29.3 percent of women), there were more women who reported having diabetes in the 65 and older age group than men (23.1 percent versus 17.6 percent) (figure 1).
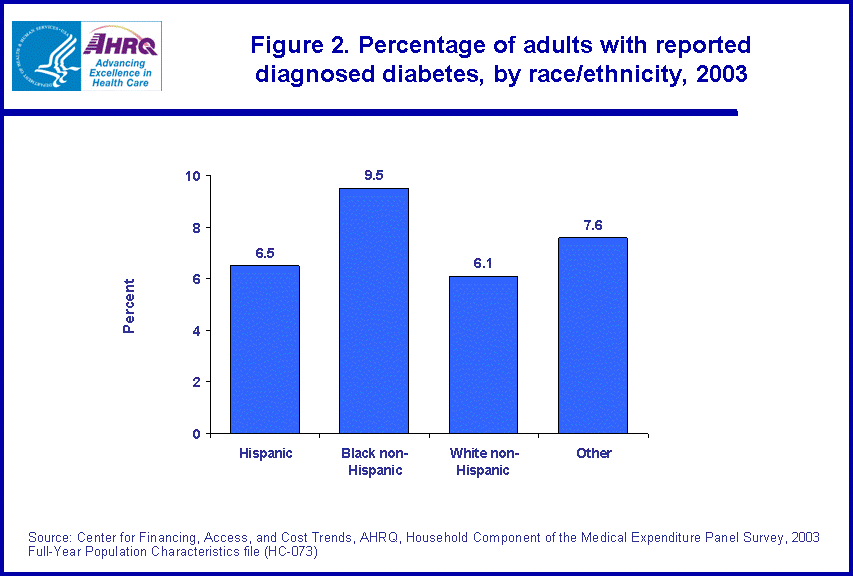
With respect to race/ethnicity, non-Hispanic blacks were more likely to have been diagnosed with diabetes (9.5 percent) than Hispanics (6.5 percent) and non-Hispanic whites (6.1 percent) (figure 2).
Management: Diagnostic tests
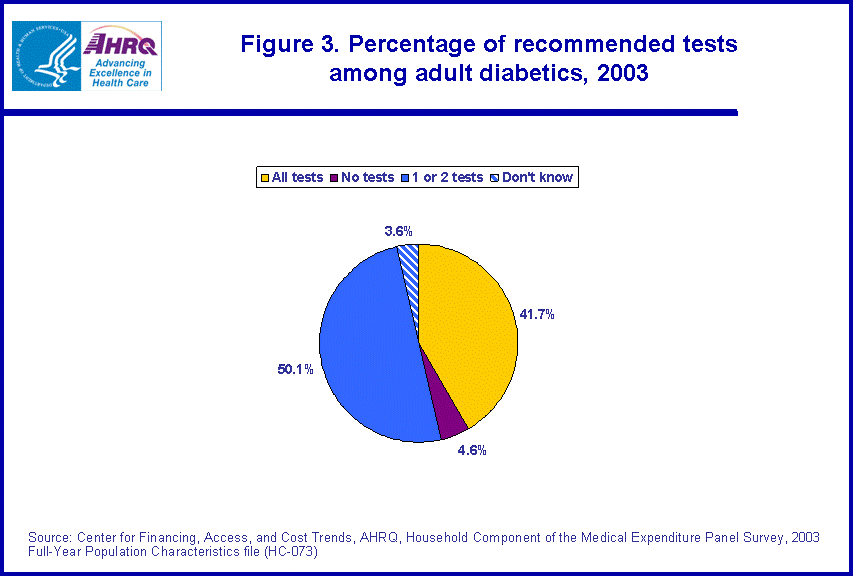
In 2003, 41.7 percent of adults with diagnosed diabetes reported having received all three recommended tests (hemoglobin A1C, dilated eye exam, and foot exam) (figure 3). However, the majority of the adult diabetic population received only one or two of these tests (50.1 percent). There were a small percentage of persons (4.6 percent) who did not obtain any of the recommended diagnostic tests. It should be noted that 3.6 percent of diabetics did not know whether they had received one or more of these tests for diabetic screening.
Non-Hispanic whites were somewhat more likely than non-Hispanic blacks or Hispanics to report having received all three tests (45.4 percent versus 32.0 percent and 35.7 percent, respectively).
There were significant age-related differences in diagnosed diabetes. Adult diabetics between the ages of 18 and 64 were much less likely (38.5 percent) to have received all three tests when compared with people age 65 and above (46.7 percent).
Adults between the ages of 18 and 64 with private insurance were much more likely to have received all three tests when compared with those of the same age group with public insurance or who were uninsured (44.2 percent versus 26.6 percent and 23.5 percent, respectively).
For persons ages 65 and above, those with Medicare plus private (including TRICARE) insurance were more likely to receive all three tests (52.3 percent) when compared with persons with Medicare only coverage or persons with Medicare plus other public insurance coverage (45.2 percent and 33.1 percent).
Management: Treatments
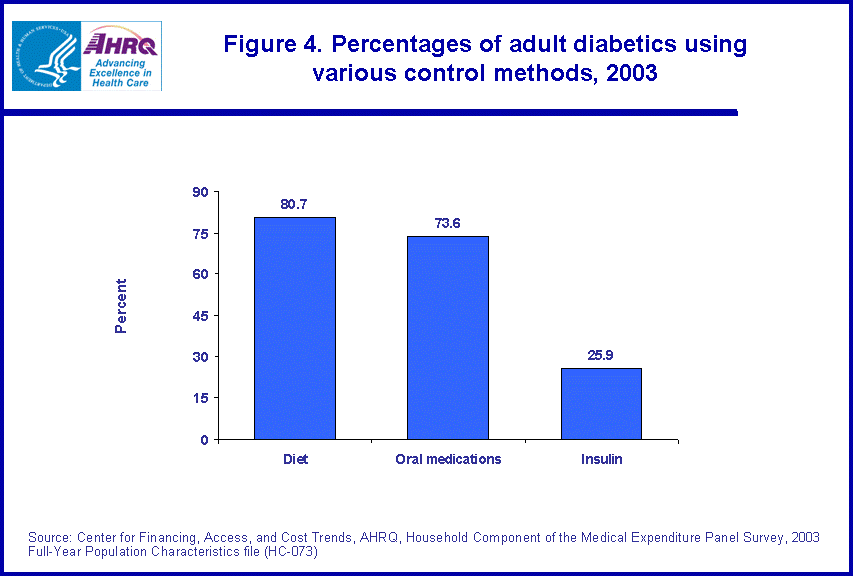
While diabetes can be controlled by following a careful diet and taking oral medications, in some cases, it is necessary to have insulin delivered by injections or a pump. MEPS data indicated that over 80 percent (80.7 percent) of adult diabetics used diet modification to help control their diabetes (figure 4). Almost three-fourths (73.6 percent) of diabetics were taking oral medications to keep their diabetes in control, while only about one-quarter of the population (25.9 percent) was using insulin for treatment of their diabetes. A small percentage of diabetics (4.5 percent) did not use any of these three methods to treat and/or control their diabetes.
Complications
In 2003, 81.1 percent of diabetic adults were overweight/obese compared with 57.7 percent of non-diabetic adults (figure 5). In addition, adult diabetics were more likely than non-diabetic adults to have reported a number of other chronic health conditions. Diabetics were three times as likely to have hypertension (64.4 percent versus 18.8 percent) and were almost four times as likely as the non-diabetic adult population to have had cardiovascular disease or stroke (36.7 percent versus. 9.7 percent).
Data Source
The estimates in this Statistical Brief are based upon data from the MEPS 2003 Full-Year Population Characteristics data file (HC-073). Specifically, the preventive care and treatment data analyzed in this brief were ascertained in a short self-administered questionnaire (the Diabetes Care Supplement), which was distributed in Rounds 3/5 of the MEPS to adults identified as having physician-diagnosed diabetes in the previous MEPS round.
Definitions
Cardiovascular disease and stroke
The indicator for cardiovascular disease and stroke was drawn from variables indicating presence of heart disease (coronary heart disease, angina, heart attack, stroke, or any other heart-related disease). For each of the conditions listed, the following question was asked: "(Have/Has) PERSON ever been told by a doctor or other health professional that PERSON had [condition]."
Racial and ethnic classifications
Classification by race and ethnicity was based on information reported for each family member. Respondents were asked if each family member's race was best described as American Indian, Alaska Native, Asian or Pacific Islander, black, white, or other. They also were asked if each family member's main national origin or ancestry was Puerto Rican; Cuban; Mexican, Mexicano, Mexican American, or Chicano; other Latin American; or other Spanish. All persons whose main national origin or ancestry was reported in one of these Hispanic groups, regardless of racial background, were classified as Hispanic. Since the Hispanic grouping can include black Hispanic, white Hispanic, Asian and Pacific Islanders Hispanic, and other Hispanic, the race categories of black, white, Asian and Pacific Islanders, and other do not include Hispanic. MEPS respondents who reported other single or multiple races and were non-Hispanic were included in the other category.
Health insurance status
Individuals under age 65 were classified in the following three insurance categories, based on household responses to health insurance status questions:
- Any private health insurance: Individuals who, at any time during the year, had insurance that provides coverage for hospital and physician care (other than Medicare, Medicaid, or other public hospital/physician coverage) were classified as having private insurance. Coverage by TRICARE (Armed Forces-related coverage) was also included as private health insurance. Insurance that provides coverage for a single service only, such as dental or vision coverage, was not included.
- Public coverage only: Individuals were considered to have public coverage only if they met both of the following criteria: 1) they were not covered by private insurance at any time during the year, and 2) they were covered by one of the following public programs at any point during the year: Medicare, Medicaid, or other public hospital/physician coverage.
- Uninsured: The uninsured were defined as people not covered by private hospital/physician insurance, Medicare, TRICARE, Medicaid, or other public hospital/physician programs at any time during the entire year or period of eligibility for the survey.
- Medicare only: Individuals who, at any time during the year, were covered by Medicare only. For analytic purposes, this classification also includes a very small number of persons ages 65 and over who did not report Medicare coverage.
- Medicare plus private (including TRICARE): Individuals who at any time during the year, were covered by a combination of Medicare, TRICARE, or private insurance.
- Medicare plus other public coverage: Individuals who, at any time during the year, were covered by Medicare in addition to some other type of public insurance.
About MEPS-HC
MEPS-HC is a nationally representative longitudinal survey that collects detailed information on health care utilization and expenditures, health insurance, and health status, as well as a wide variety of social, demographic, and economic characteristics for the civilian noninstitutionalized population. It is cosponsored by the Agency for Healthcare Research and Quality and the National Center for Health Statistics.
For more information about MEPS, call the MEPS information coordinator at AHRQ (301-427-1656) or visit the MEPS Web site at http://www.meps.ahrq.gov/.
References
National Center for Health Statistics, National Vital Statistics Reports: Deaths: Preliminary Data for 2003; Vol. 53, No. 15, February 2005. http://www.cdc.gov/nchs/data/nvsr/nvsr53/nvsr53_15.pdf
Agency for Healthcare Research and Quality. National Healthcare Quality Report (2004). Rockville, Md.: U.S. Department of Health and Human Services. http://www.qualitytools.ahrq.gov/qualityreport/browse/browse.aspx
Centers for Disease Control and Prevention. National Diabetes Fact Sheet: General Information and National Estimates On Diabetes in the United States, 2003. Rev ed. Atlanta, Ga.: U.S. Department of Health and Human Services, Centers for Disease Control and Prevention, 2004. http://www.cdc.gov/diabetes/pubs/pdf/ndfs_2003.pdf
For a detailed description of the MEPS survey design, sample design, and methods used to minimize sources of nonsampling error, see the following publications:
Cohen, J. Design and Methods of the Medical Expenditure Panel Survey Household Component. MEPS Methodology Report No. 1. AHCPR Pub. No. 97-0026. Rockville, Md.: Agency for Health Care Policy and Research, 1997.
Cohen, S. Sample Design of the 1996 Medical Expenditure Panel Survey Household Component. MEPS Methodology Report No. 2. AHCPR Pub. No. 97-0027. Rockville, Md.: Agency for Health Care Policy and Research, 1997.
Cohen, S. Design Strategies and Innovations in the Medical Expenditure Panel Survey. Medical Care, July 2003: 41(7) Supplement: III-5-III-12.
Suggested Citation
Soni, A. Diabetes Management: Tests and Treatments among the 18 and Older U.S. Civilian Noninstitutionalized Population in 2003. Statistical Brief #105. December 2005. Agency for Healthcare Research and Quality, Rockville, MD. http://meps.ahrq.gov/mepsweb/data_files/publications/st105/stat105.shtml
AHRQ welcomes questions and comments from readers of this publication who are interested in obtaining more information about access, cost, use, financing, and quality of health care in the United States. We also invite you to tell us how you are using this Statistical Brief and other MEPS data and tools and to share suggestions on how MEPS products might be enhanced to further meet your needs. Please e-mail us at mepspd@ahrq.gov or send a letter to the address below:
Steven B. Cohen, PhD, Director
Center for Financing, Access, and Cost Trends
Agency for Healthcare Research and Quality
540 Gaither Road
Rockville, MD 20850
 |
||||||||||||||||||||||||
|
||||||||||||||||||||||||
|
|
||||||||||||||||||||||||
 |
||||||||||||||||||||||||
|
||||||||||||||||||||||||
|
|
||||||||||||||||||||||||
 |
||||||||||||||||||||||||
|
||||||||||||||||||||||||
|
|
||||||||||||||||||||||||
 |
||||||||||||||||||||||||
|
||||||||||||||||||||||||
|
|
||||||||||||||||||||||||
 |
||||||||||||||||||||||||
|
||||||||||||||||||||||||
|
|
||||||||||||||||||||||||


