Chartbook #11: Health Care Expenses in the Community Population, 1999
By Gary L. Olin, Ph.D., and Steven R. Machlin, M.S.
The estimates in this report are based on the most recent data available from MEPS at the time the report was written. However, selected elements of MEPS data may be revised on the basis of additional analyses, which could result in slightly different estimates from those shown here. Please check the MEPS Web site for the most current file releases — www.meps.ahrq.gov.
AHRQ is the lead Federal agency charged with supporting research designed to improve the quality of health care, reduce its cost, address patient safety and medical errors, and broaden access to essential services.AHRQ sponsors and conducts research that provides evidence-based information on health care outcomes; quality; and cost, use, and access.The information helps health care decisionmakers—patients and clinicians, health system leaders, and policymakers—make more informed decisions and improve the quality of health care services.
Executive Summary
Offers and Enrollment
In 1999, the civilian non-institutionalized population had health care expenses of $596 billion. For the 84% with health care expenses, the mean expense was $2,557.
Half of the community population had expenses of about $450 or less for the year. This includes the 16% who had no health care expenses.
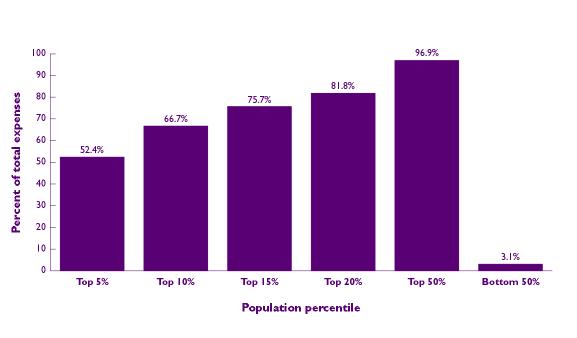
In 1999, 5% of the community population accounted for slightly more than half of the population’s total health expenses. Conversely, the bottom 50% accounted for only 3% of all health expenses.
Inpatient hospital stays, ambulatory medical care, and prescribed medicines accounted for 83% of health care spending for the community population.
In 1999, 83% of the non-elderly and 95% of the elderly had health care expenses. The mean expense per user was $1,939 for the non-elderly and $6,299 for the elderly.
Private insurance paid 54% of health care expenses for people under 65, while Medicare paid 56% for people 65 and over.
The average expense per uninsured person was $684. The average expense per Medicare beneficiary with supplemental Medicaid coverage was $8,069.
Uninsured people under 65 paid 46% of their expenses out of pocket, while their publicly insured counterparts paid only 10%.
The out-of-pocket share of spending by people 65 and over ranged from 7% by Medicare beneficiaries with other public insurance to 19% by beneficiaries with Medicare only.
Return To Table Of Contents
Introduction
This chartbook from the Agency for Healthcare Research and Quality (AHRQ) shows health care spending for the civilian non-institutionalized (community) population in 1999. It presents data from the Medical Expenditure Panel Survey (MEPS).
The chartbook is organized into four sections. Section 1 is a summary of national expenses for the community population by amount, type of service, and source of payment. Section 2 presents information on non-elderly (under age 65) and elderly people living in the community, two groups that have quite different health care expenses. Section 3 shows average health care expenses for persons categorized by age, insurance status, income, and race/ethnicity. Section 4 shows the extent to which selected populations rely on different sources to pay for their health care.
AHRQ’s first chartbook on health care spending for the community population shows data for 1996.
This chartbook and other MEPS publications are available electronically on the MEPS Web site at <http://www.meps.ahrq.gov/>.
Return To Table Of Contents
Data in This Report
Data in the chartbook are derived from MEPS public use file HC-038—the 1999 Full Year Consolidated File. This file contains information from the household component of MEPS, which surveys a nationally representative sample of households for information on the health status, health care use and expenses, and health insurance coverage of individuals and families in the U.S. civilian non-institutionalized population. The utilization information is based on medical events reported by households, but the payment information is based on data collected from medical providers in the Medical Provider Component of the survey wherever possible.
The expenses discussed here represent payments to hospitals, physicians, and other health care providers for services reported by the survey respondents. They were specifically defined as direct payments by individuals, private insurance, Medicaid, Medicare, and other sources for care provided during the year. The expenses do not include indirect payments to health care providers, such as Medicaid Disproportionate Share and Medicare Direct Medical Education subsidies, nor do they include payments for over-the counter drugs, alternative care services, or phone contacts with medical providers. (See “Definitions of Terms” for more information on service categories, sources of payment, and population characteristics.)
The detailed information collected about individuals in MEPS makes it possible to examine spending levels and patterns by population characteristics such as the ones illustrated in this chartbook. However, the MEPS estimates of national medical expenditures are substantially lower than the expenditures for personal health care typically cited from the National Health Accounts (NHA). The main reasons for the differences are that the NHA include a wider variety of expenses and also include expenses for people who are not part of the community population.
MEPS is based on a complex sample design, so survey estimates are subject to statistical sampling error. In this chartbook, only differences between groups that are statistically significant at the 0.05 level (not likely to be attributable to sampling error) are noted in the text.
Return To Table Of Contents
Section 1: Overview
In recent years, health care spending has accounted for about 13% of this Nation’s gross domestic product. U.S. expenses for health care—whether measured as a percent of national income or per capita—are greater than those of any other major industrialized country.
This section contains information on health care spending for the community population in 1999. It highlights the level and type of spending, sources of payment, and distribution of expenses among community residents as a whole.
Return To Table Of Contents
What proportion of the community population has medical expenses?
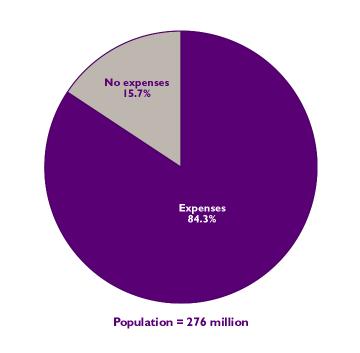
•In 1999, there were about 276 million people in the civilian non-institutionalized population of the United States.
•Approximately 84% of the population had at least one health care expense during the year, and the average expense was $2,557 for persons with expenses (data not shown).
• Not all people had health care expenses in 1999. Of the 16% of the population with no health care spending, a very small proportion received some health care for which no payments were made.
 |
| No expenses |
15.7% |
| Expenses |
84.3% |
| Population = 276 million |
|
Return To Table Of Contents
How is the health care dollar spent?
• Direct spending on health care for the U.S. community population was about $596 billion.
• Hospital inpatient stays accounted for the largest amount of spending on health care (36% of the total), although the inpatient share of total spending has been declining since the early 1980s.
• The second largest expense category was ambulatory health care (31% of the total).
• Prescribed medicines were the third largest type of health care spending for the community population in 1999 (16% of the total). These expenses have approximately doubled as a proportion of the total since 1987.
 |
| Ambulatory |
31.2% |
| Dental |
8.8% |
| Home health |
5.3% |
| Prescribed medicines |
15.8% |
| Inpatient |
36.1% |
| Other |
2.8% |
| Total = $596 billion |
|
Return To Table Of Contents
What share of expensed do different sources pay?
• Third-party payers—anyone except the individual or family—made about 81% of the healthcare payments for the civilian non-institutionalized population in 1999. Individuals and family members paid the remaining 19%.
• Private medical insurance—the largest third-party payer—covered about 40% of total payments. Public sources of payment include Medicare and Medicaid. These two public programs combined paid 31% of the total.
• About 9% of the expenses were paid for by other sources, such as the Department of Veterans Affairs, the Indian Health Service, State and local programs, and liability insurance for homes and cars.
 |
| Medicare |
22.6% |
| Medicaid |
8.8% |
| Out of Pocket |
19.2% |
| Private Insurance |
40.2% |
| Other |
9.2% |
|
Return To Table Of Contents
What is the average medical expense of the community population?
• About half of the community population had health expenses of $451 (the median expense) or less, but the mean per capita expense was $2,156 in 1999. The gap between median and mean expenses stems from large spending by a small proportion of the population.
• Among people with expenses, the mean was $2,557 and the median was $674. These estimates are higher than the per capita estimates because 16% of the community population did not have health expenses in 1999.
• Regardless of whether expenses are expressed as per capita or per user, the mean expense was 4 to 5 times the size of the median expense.
How is spending distributed across the population?
• In any given year, health care spending for the U.S. community population is highly skewed, with no or few expenses for many people and large expenses for a small number of people.
• In 1999, 16% of the community population had no health care expenses and about half had health care expenses of $1,000 or less. At the other extreme, 5% of the population had health care expenses of more than $8,000.
 |
Level of Expenses |
% of Population |
| None |
15.7% |
| $1-$1,000 |
49.9% |
| $1,001-$2,000 |
12.6% |
| $2,001-$3,000 |
6.2% |
| $3,001-$4,000 |
3.6% |
| $4,001-$5,000 |
2.6% |
| $5,001-$6,000 |
1.9% |
| $6,001-$7,000 |
1.3% |
| $7,001-$8,000 |
1.1% |
| Over-$8,000 |
5.2% |
|
Return To Table Of Contents
How is health care spending concentrated in the population?
• High-cost users (people with exceptionally large expenses) are responsible for much of the health care spending in the United States. Five percent of the community population accounted for more than half of total health care spending in 1999.
• At the other extreme, the bottom 50% of the population had few or no health care expenses. This group was responsible for 3% of total health care spending by the community population.
 |
Population
percentile |
Percent of
total expenses |
| Top 5% |
52.4% |
| Top 10% |
66.7% |
| Top 15% |
75.7% |
| Top 20% |
81.8% |
| Top 50% |
96.9% |
| Bottom 50% |
3.1% |
|
| |
Return To Table Of Contents
Section 2: Non-Elderly vs. Elderly
Health care expenses differ substantially between the elderly and non-elderly. For example, the Medicare population, which consists mostly of elderly people, accounts for approximately 37% of all personal health care spending in the United States, even though it comprises only 15% of the population. This section provides estimates of health care spending for non-elderly (under age 65) and elderly (age 65 and over) community residents.
Return To Table Of Contents
What is the average expense of non-elderly health care users?
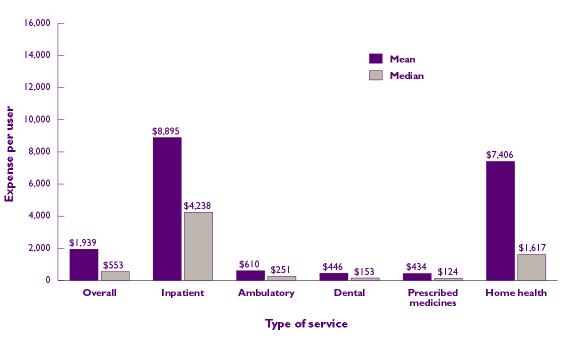
• Non-elderly people who used health care services had mean and median expenses of $1,939 and $553, respectively, in 1999. However, spending on different types of services varied widely.
• Hospital inpatient care was the most expensive type of care, with mean per-user expenses of $8,895. Per-user expenses for home health care were also high, but less than 1% of the population under 65 had home health expenses in 1999. (See page 18.)
• The median expense for most other types of care was relatively low, ranging from $251 for ambulatory care to $124 for prescribed medicines.
 |
| Type of service |
Expense per user |
| Mean |
Median |
| Overall |
$1,939 |
$553 |
| Inpatient |
$8,895 |
$4,238 |
| Ambulatory |
$610 |
$251 |
| Dental |
$446 |
$153 |
| Prescribed medicines |
$434 |
$124 |
| Home health |
$7,406 |
$1,617 |
|
Return To Table Of Contents
What is the average expense of elderly health care users?
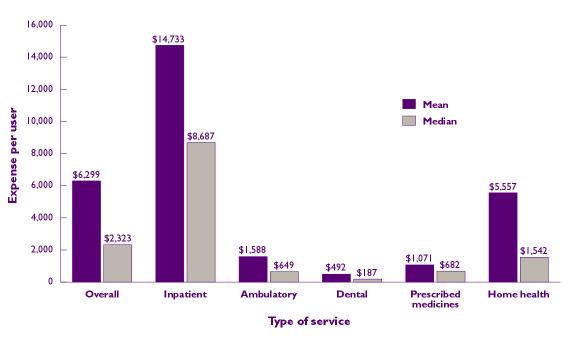
• People tend to use more health care and more expensive services as they age. In 1999, the overall mean and median expenses of elderly users of health care were $6,299 and $2,323, or approximately three to four times the expenses of non-elderly people who used health care (previous chart).
• Elderly users of inpatient hospital services had mean and median annual expenses of $14,733 and $8,687, amounts approaching twice the expenses for non-elderly users. Moreover, the elderly were more than three times as likely as the non-elderly to have an inpatient hospital stay (19% vs. 6%).
• Home health care is relatively common among the elderly, with a mean expense per user of $5,557 in 1999.
 |
| Type of service |
Expense per use |
| Mean |
Median |
| Overall |
$6,229 |
$2,323 |
| Inpatient |
$14,733 |
$8,687 |
| Ambulatory |
$1,588 |
$649 |
| Dental |
$492 |
$187 |
| Prescribed medicines |
$1071 |
$682 |
| Home health |
$5,557 |
$1,542 |
|
Return To Table Of Contents
How does the non-elderly population pay for its health care?
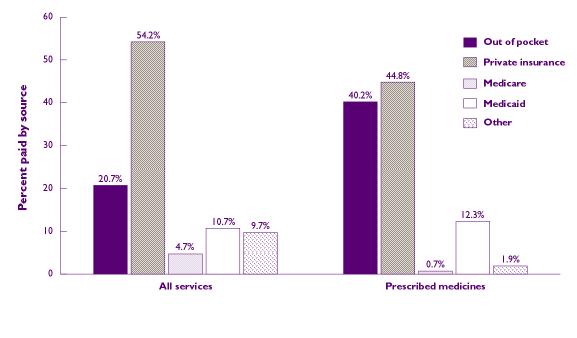
• People under 65 rely heavily on private insurance and their own resources to pay for health care. In 1999, 54% of their total expense was paid by private insurance and another 21% was paid out of pocket.
• Private insurance was the largest payer for prescribed medicine expenses (45%), but out-of pocket expenses also were large (40%).
 |
| |
Percent paid by source |
All
services |
Prescribed
medicines |
| Out of pocket |
20.7% |
40.2% |
| Private insurance |
54.2% |
44.8% |
| Medicare |
4.7% |
0.7% |
| Medicaid |
10.7% |
12.3% |
| Other |
9.7% |
1.9% |
|
Return To Table Of Contents
How does the elderly population pay for its health care?
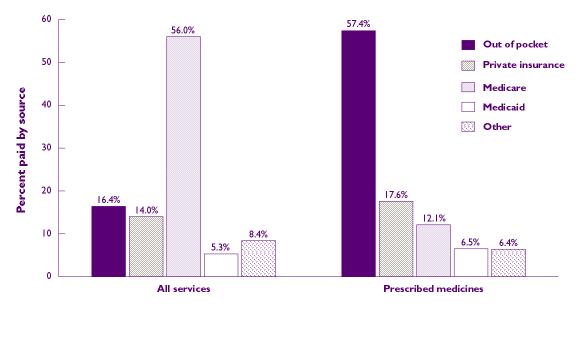
• The elderly rely on Medicare to the same extent that younger people rely on private insurance for coverage of their health care expenses. In 1999, Medicare paid 56% of the health care expenses incurred by elderly people living in the community.
• The Medicare share for prescribed medicines (12%) was relatively low. This spending was for the small proportion of the elderly who were in Medicare managed care plans that covered some expenses for prescribed medicines.
• Medicaid paid a relatively small proportion of expenses incurred by elderly community residents (5%). The Medicaid proportion is small because only about one of eight Medicare beneficiaries in the community is covered by Medicaid, and Medicaid is the payer of last resort for their health care.
 |
| |
Percent paid by source |
All
services |
Prescribed
medicines |
| Out of pocket |
16.4% |
57.4% |
| Private insurance |
14.0% |
17.6% |
| Medicare |
56.0% |
12.1% |
| Medicaid |
5.3% |
6.5% |
| Other |
8.4% |
6.4% |
|
Return To Table Of Contents
How much more likely are elderly people to have expenses for different services?
• The elderly are more likely than the non-elderly to use all types of health care except dental services. Differences in home health and inpatient hospital use rates are particularly large. The elderly are more than 10 times as likely as the non-elderly to have home health care expenses (10% vs.1%), and more than 3 times as likely to have an inpatient hospital stay (19% vs. 6%).
• Regardless of age, most people have at least one health care expense during a year. In 1999, 83% of the population under 65 and 95% of the population 65 and over had health care expenses.
 |
| Type of service |
Percent with an Expense per use |
Under
65 |
65 and
over |
| Overall |
82.8% |
95.3% |
| Inpatient |
5.6% |
18.5% |
| Ambulatory |
69.8% |
89.5% |
| Prescribed medicines |
58.7% |
88.0% |
| Dental |
41.8% |
41.2% |
| Home health |
0.7% |
9.5% |
|
Return To Table Of Contents
Section 3: Demographics and Insurance
Data on national health care expenditures are used for a variety of purposes, including measuring the impact of health care spending on the national economy and monitoring access to care by underserved populations. MEPS data are of particular interest to many researchers and policymakers because the individual- and family-level detail provides the foundation for studies of numerous issues related to the delivery and financing of health care in the United States. This section summarizes the average level of spending for the community population categorized by age, insurance status, income, and race/ethnicity.
Return To Table Of Contents
How do average health care expenses vary by age?
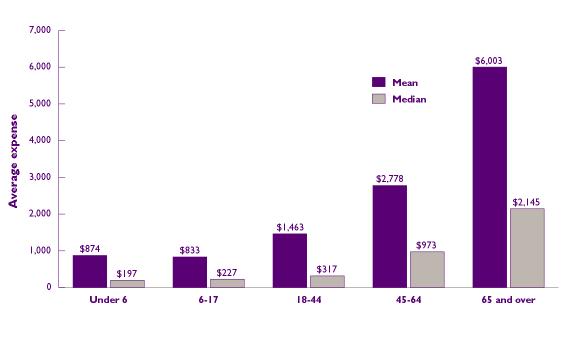
• Mean and median health care expenses of young children (under age 6) and school-age children (ages 6-17) were similar, but spending on health care rose with age. The largest jump in mean expenses occurred between the age groups 45-64 ($2,778) and 65 and over ($6,003).
• The mean expense within each age group is always higher than the median expense because a relatively small proportion of individuals are responsible for a disproportionate share of a group’s total expenses.
 |
| Average expense |
| |
Mean |
Median |
| Under 6 |
$874 |
$197 |
| 6-17 |
$833 |
$227 |
| 18-44 |
$1,463 |
$317 |
| 45-64 |
$2,778 |
$973 |
| 65 and over |
$6,003 |
$2,145 |
|
Return To Table Of Contents
Do health care expenses vary by insurance status?
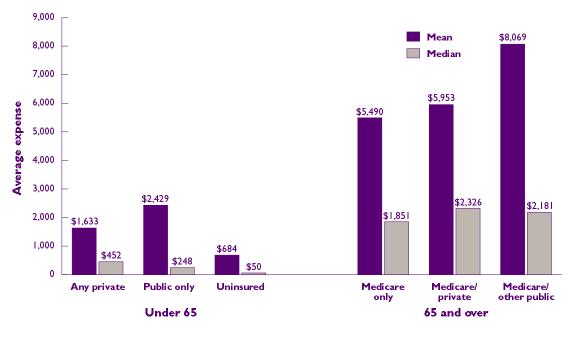
• Among the population under 65, the uninsured receive less health care than either the privately or publicly insured. In 1999, the mean expense of the uninsured ($684) was 72% less than that of people with public insurance ($2,429) and 58% less than that of people with private insurance ($1,633).
• Almost all elderly people have Medicare, and a large proportion have supplementary private or other public (mostly Medicaid) coverage as well. The mean expense for beneficiaries with other public insurance ($8,069) was 36% higher than the expense for Medicare beneficiaries with private insurance ($5,953) and 47% higher than the expense for beneficiaries without supplemental insurance ($5,490).
 |
Average expense
Under 65 |
| |
Mean |
Median |
| Any private |
$1,633 |
$452 |
| Public only |
$2,429 |
$248 |
| Uninsured |
$684 |
$50 |
|
Average expense
65 and over |
| |
Mean |
Median |
| Medicare only |
$5,490 |
$1,851 |
| Medicare/private |
$5,953 |
$2,326 |
| Medicare/other public |
$8,069 |
$2,181 |
|
Return To Table Of Contents
How do average health care expenses vary by income category?
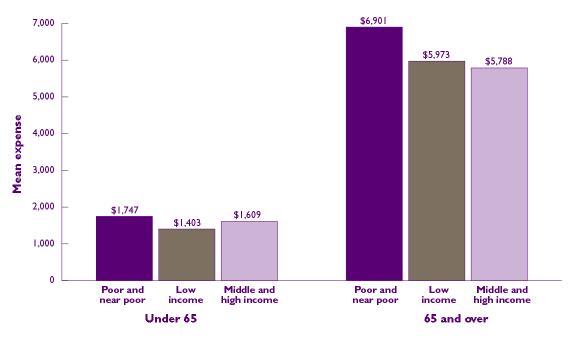
• Differences between income groups in mean health care expenses were not statistically significant for either the non-elderly or the elderly.
• Mean health care expenses for the elderly were 3-4 times those of the non-elderly in all income groups.
 |
| |
Mean expense |
Under
65 |
65 and
over |
| Poor and near poor |
$1,747 |
$6,901 |
| Low income |
$1,403 |
$5,973 |
| Middle and high income |
$1,609 |
$5,788 |
|
Return To Table Of Contents
Is race/ethnicity related to health care expenses?
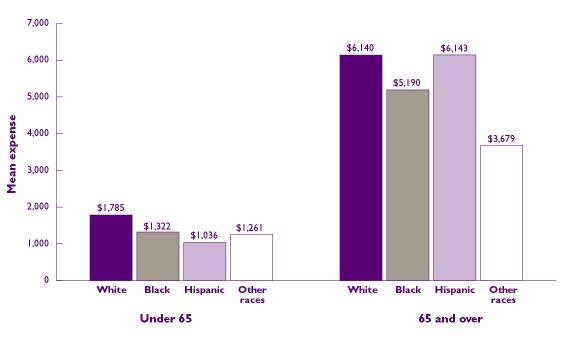
• Health care expenses vary across racial and ethnic groups, but the differences are not consistent for the non-elderly and the elderly. For example, in the group under 65, Hispanics spent significantly less than whites, but among the elderly, Hispanics and whites had about the same health care expenses.
• Among the non-elderly, the average expense was highest among whites ($1,785) and lowest among Hispanics ($1,036).
• Among the elderly, other races (non-Hispanics of any race except black or white) had the lowest average expense ($3,679). Whites and Hispanics had expenses of about $6,100 each.
 |
Mean expense |
| |
Under
65 |
65 and
over |
| White |
$1,785 |
$6,140 |
| Black |
$1,322 |
$5,190 |
| Hispanic |
$1,036 |
$6,143 |
| Other races |
$1,261 |
$3,679 |
|
Return To Table Of Contents
Section 4: Sources of Payment
Health insurance is often studied from the perspective of its impact on access to and use of health care. This section highlights the contribution of third-party payers—private insurance and public programs—to health care expenditures for selected segments of the community population. It also shows the share of expenditures paid by individuals and families—the aggregate out-of-pocket burden of health care spending for the community population.
Return To Table Of Contents How do sources of payment for non-elderly people vary by race/ethnicity?
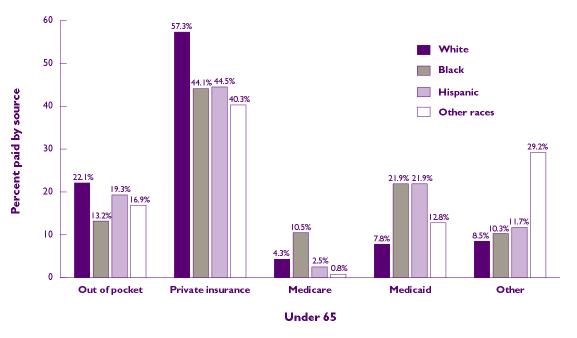
• Private insurance, typically acquired in the work place, is the main payer for health care expenses among the non-elderly community population. However, the share of total expenses paid by private insurance was higher for whites (57%) than it was for other racial and ethnic groups (45% or less) in 1999.
• Blacks paid the lowest share of total expenses out of pocket in 1999 (13%). At the other extreme, whites paid the largest share out of pocket (22%).
• Other races (non-Hispanics of any race except black or white) made proportionately the highest use of miscellaneous Federal and State programs and unclassified sources of insurance (the “other” category in the chart). In 1999, these sources paid 29% of their health care expenses.
 |
Percent paid by source
Under 65 |
| |
White |
Black |
Hispanic |
Other
races |
| Out of pocket |
22.1% |
13.2% |
19.3% |
16.9% |
| Private insurance |
57.3% |
44.1% |
44.5% |
40.3% |
| Medicare |
4.3% |
10.5% |
2.5% |
0.8% |
| Medicaid |
7.8% |
21.9% |
21.9% |
12.8% |
| Other |
8.5% |
10.3% |
11.7% |
29.2% |
|
Return To Table Of Contents
How do sources of payment for elderly people vary by race/ethnicity?
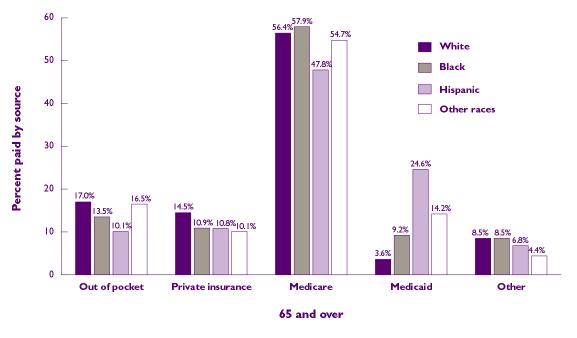
• Medicare provides acute health care coverage for nearly everyone age 65 and over, and it pays the largest share of their health care expenses. The share does vary by race/ethnicity, however. In 1999, Medicare paid a smaller share of the total expense for Hispanics (48%) than it did for whites (56%) and blacks (58%).
• Hispanics in the community population rely on Medicaid to a larger extent than any other group of elderly people. In 1999, Medicaid paid about 25% of their health care expenses.
• Out-of-pocket spending on health care is noteworthy, even though many of the elderly have supplemental private or public insurance. In 1999, out-of-pocket spending relative to total spending varied from 17% by whites and other races to 10% by Hispanics.
 |
Percent paid by source
65 and over |
| |
White |
Black |
Hispanic |
Other
races |
| Out of pocket |
17.0% |
13.5% |
10.1% |
16.5% |
| Private insurance |
14.5% |
10.9% |
10.8% |
10.1% |
| Medicare |
56.4% |
57.9% |
47.8% |
54.7% |
| Medicaid |
3.6% |
9.2% |
24.6% |
14.2% |
| Other |
8.5% |
8.5% |
6.8% |
4.4% |
|
Return To Table Of Contents
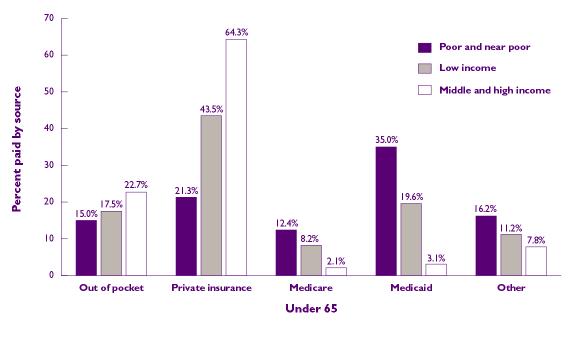
Do sources of payment vary by income for non-elderly people?
• The share of payments by individuals, private insurers, and public programs varies by income. In 1999, private insurance paid for 64% of the health care expenses for middle and high-income people under age 65, as opposed to only 21% for poor and near poor people.
• Medicaid paid about one-third of health care expenses for non-elderly people in the lowest income category.
• Even though Medicare does not include many people under 65, it covered 12% of the health care expenses of poor and near poor non-elderly people. Medicare covered only 2% of the expenses of middle- and high-income people under 65.
 |
Percent paid by source
Under 65 |
| |
Poor and
near poor |
Low
income |
Middle and
high income |
| Out of pocket |
15.0% |
17.5% |
22.7% |
| Private insurance |
21.3% |
43.5% |
64.3% |
| Medicare |
12.4% |
8.2% |
2.1% |
| Medicaid |
35.0% |
19.6% |
3.1% |
| Other |
16.2% |
11.2% |
7.8% |
|
Return To Table Of Contents
Do sources of payment vary by income for elderly people?
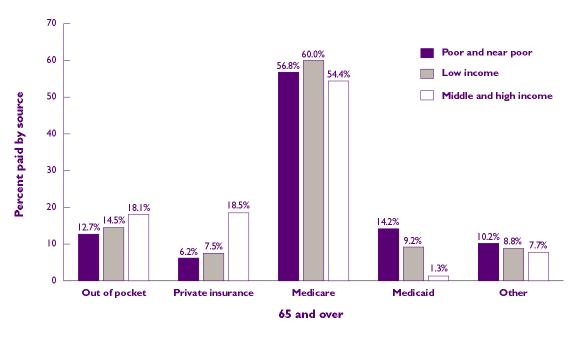
• Medicare is the primary source of payment for the elderly regardless of income. In 1999, the Medicare share of health care expenses for the elderly ranged from 54% for the middle- and high-income group to 60% for the low-income group, but the differences were not statistically significant.
• The share elderly people in the middle- and high-income group paid out of pocket was equal to the share paid by their private insurance (about 18% each).
• In 1999, poor and near poor elderly people living in the community paid about 13% of their expenses out of pocket—an amount about equal to the 14% paid by Medicaid.
 |
| |
Percent paid by source
65 and over |
Poor and
near poor |
Low
income |
Middle and
high income |
| Out of pocket |
12.7% |
14.5% |
18.1% |
| Private insurance |
6.2% |
7.5% |
18.5% |
| Medicare |
56.8% |
60.0% |
54.4% |
| Medicaid |
14.2% |
9.2% |
1.3% |
| Other |
10.2% |
8.8% |
7.7% |
|
Return To Table Of Contents
How do sources of payment vary between elderly and non-elderly people?
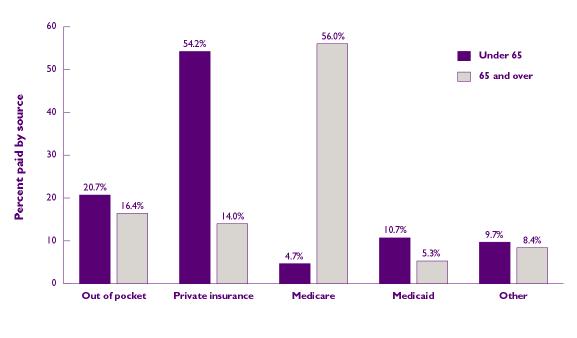
• In 1999, private insurance was the largest payer of health care for the non-elderly (54% of the total), while Medicare paid an equally large share of expenses for the elderly (56% of the total).
• Both age groups relied fairly extensively on their own resources to pay amounts not covered by insurance. Out-of-pocket payments by the non-elderly and the elderly made up 21% and 16% of their total health care payments, respectively.
• As a proportion of total expenses, Medicaid paid about twice as much for the non-elderly as it did for the elderly (11% versus 5%).
 |
Percent paid by source |
| |
Under
65 |
65 and
over |
| Out of pocket |
20.7% |
16.4% |
| Private insurance |
54.2% |
14.0% |
| Medicare |
4.7% |
56.0% |
| Medicaid |
10.7% |
5.3% |
| Other |
9.7% |
8.4% |
|
Return To Table Of Contents
How does out-of-pocket spending for medical care vary by insurance status?
• Out-of-pocket spending is one measure of the financial burden of health care on individuals and families. In 1999, the community population paid 19% of its health care expenses out of pocket (Section 1), but that share varies widely depending on insurance status.
• Among the non-elderly, people with public insurance (primarily Medicaid) paid the lowest proportion of their total expenses out of pocket (10%). In contrast, the uninsured paid about half of their total expenses out of pocket (46%). The remaining expenses for uninsured individuals were paid by other sources, such as the Department of Veterans Affairs, public clinics, and other public and private sources.
• Medicare beneficiaries with supplemental public insurance had the lowest out-of-pocket spending (7%) relative to their total expenses. In contrast, elderly people with only Medicare paid 19%, and those with Medicare plus supplemental private insurance paid 17%.
 |
Percent out of pocket
Under 65 |
| Any private |
21.4% |
| Public only |
10.0% |
| Uninsured |
45.7% |
|
Percent out of pocket
65 and over |
| Medicare only |
19.2% |
| Medicare/private |
17.4% |
| Medicare/other public |
7.0% |
|
Return To Table Of Contents
Definitions of Terms
Type-of-Service Categories
Health care services are categorized according to reports by survey respondents. The six categories used here are inpatient, ambulatory, prescribed medicines, dental, home health, and other. Expenses for these services are defined as follows:
Inpatient service expenses cover room and board and all hospital diagnostic and laboratory services, separately billed physician inpatient services, and emergency room services incurred immediately prior to admission to the hospital.
Ambulatory service expenses cover visits to medical providers seen in office-based settings or clinics, hospital outpatient departments, emergency rooms (except visits resulting in an overnight hospital stay), and clinics owned and operated by hospitals.
Prescribed medicine expenses cover all prescribed medications that were initially purchased or refilled during 1999, as well as diabetic supplies (some of which may have been purchased without a prescription).
Dental service expenses cover any type of dental care, including services provided by general dentists, dental hygienists, dental technicians, dental surgeons, orthodontists, endodontists, and periodontists.
Home health service expenses cover care provided by home health agencies and independent home health providers. Agency providers accounted for most of the expenses in this category.
Other service expenses cover eyeglasses, contact lenses, ambulance services, orthopedic items, hearing devices, prostheses, bathroom aids, medical equipment, disposable supplies, and other miscellaneous items or services that were obtained, purchased, or rented during the year. About half the expenses in this category were for vision items.
Health Care Users
Health care users are persons with some health care expenses during the year.
Sources of Payment
Health care providers are reimbursed for their services by individuals and by third party payers such as private insurance and public programs. Sources of payment in the chartbook are defined as follows:
Out of pocket means paid by the user or family.
Private insurance refers to major medical plans covering hospital and physician care (excluding Medicare, Medicaid, and other public sources). It includes Medigap plans for Medicare beneficiaries, CHAMPUS (the military health care system, now called TRICARE), and CHAMPVA (for military veterans), but excludes single-service plans such as dental or vision insurance.
Medicare is a federally financed health insurance plan for the elderly, persons receiving Social Security disability payments, and most persons with end-stage renal disease. Medicare Part A, which provides hospital insurance, is automatically given to those who are eligible for Social Security. Medicare Part B provides supplementary medical insurance that pays for medical expenses and can be purchased for a monthly premium.
Medicaid is a means-tested government program jointly financed by Federal and State funds that provides health care to those who are eligible. Program eligibility criteria vary significantly by State, but the program is designed to provide health coverage to families and individuals who are unable to afford necessary medical care.
Other sources include the Department of Veterans Affairs (excluding CHAMPVA); other Federal sources (Indian Health Service, military treatment facilities, and other care provided by the Federal Government); various State and local sources (community and neighborhood clinics, State and local health departments, and State programs other than Medicaid); Medicaid payments reported for people who were not enrolled in the Medicaid program at any time during the year; Worker’s Compensation; unclassified sources (automobile, homeowner’s, or liability insurance, and other miscellaneous or unknown sources); and any type of private insurance payments reported for people without private health insurance coverage during the year.
Population Characteristics
In general, population characteristics were measured as of December 31, 1999, or the last date that the sample person was part of the civilian non-institutionalized population living in the United States prior to December 31, 1999.
Race/Ethnicity
Classification by race and ethnicity is based on information reported in MEPS for each family member. Respondents were asked if the race of the sample person was best described as American Indian, Alaska Native, Asian or Pacific Islander, black, white, or other. They also were asked if the sample person’s main national origin or ancestry was Puerto Rican; Cuban; Mexican, Mexicano, Mexican American, or Chicano; other Latin American; or other Spanish. All persons whose main national origin or ancestry was reported in one of these Hispanic groups, regardless of racial background, are classified as Hispanic. The other race categories do not include Hispanic persons.
Comparisons by race/ethnicity in this chartbook are based on the following four race/ethnicity groups: non-Hispanic white, non-Hispanic black, non-Hispanic other races, and Hispanic (of any race). The “other races” category includes American Indians, Aleutian Islanders and Eskimos, Asians and Pacific Islanders, and unspecified races.
Health Insurance Status
The health insurance categories in this chartbook are based on age and insurance coverage at any time during 1999. Individuals under age 65 were classified as follows:
Any private health insurance includes individuals with insurance that provides coverage for hospital and physician care (other than Medicare, Medicaid, or other public hospital/physician coverage) at any time in the year. Persons with Armed Forces-related coverage— CHAMPUS/CHAMPVA—are also included because the number of sample persons in this group is small, and the coverage is similar to private insurance. Individuals who have only single-service coverage for services such as dental and vision care are not included in this category.
Public coverage only includes individuals who met both of the following criteria:
- They were not covered by private insurance at any time during the year.
- They were covered by one of the following public programs at any point during the year: Medicare, Medicaid, or other public hospital/physician coverage.
Uninsured includes individuals who were not covered by Medicare, CHAMPUS/CHAMPVA, Medicaid, other public hospital/physician programs, or private hospital/physician insurance at any time during 1999. Individuals covered only by non-comprehensive State-specific programs (e.g., Maryland Kidney Disease Program, Colorado Child Health Plan) or private single-service plans (e.g., coverage for dental or vision care only, coverage for accidents or specific diseases) are not considered to be insured.
Individuals age 65 and over were classified as follows:
Medicare only includes individuals who were covered by Medicare but did not have private insurance or any other public insurance.
Medicare and private insurance includes individuals who had supplementary private insurance in addition to Medicare.
Medicare and other public insurance includes individuals who had Medicaid or other public insurance in addition to Medicare but no private supplemental insurance.
Income Category
Each person was classified according to the total 1999 income of his or her family. Within a household, all individuals related by blood, marriage, or adoption were considered to be a family. Personal income from all family members was summed to create family income. Possible sources of income included annual earnings from wages, salaries, bonuses, tips, and commissions; business and farm gains and losses; unemployment and Worker’s Compensation; interest and dividends; alimony, child support, and other private cash transfers; private pensions, IRA withdrawals, Social Security, and veterans’ payments; Supplemental Security Income and cash welfare payments from public assistance, Aid to Families with Dependent Children, and Aid to Dependent Children; gains or losses from estates, trusts, partnerships, S corporations, rent, and royalties; and a small amount of other income.
Income category was determined by the ratio of family income to the 1999 Federal poverty thresholds, which vary by family size and age of the head of the family. The three income categories in the chartbook are defined as follows:
Poor and near poor includes persons in families with income less than or equal to 125 percent of the poverty line. (Some of these persons reported negative income.)
Low income includes persons in families with incomes over 125% through 200% of the poverty line.
Middle and high income includes persons in families with income over 200% of the poverty line.
Return To Table Of Contents
| Suggested Citation: Chartbook #11: Health Care Expenses in the Community Population, 1999. October 2003. Agency for Healthcare Research and Quality, Rockville, MD.
http://www.meps.ahrq.gov/data_files/publications/cb11/cb11.shtml |
|
