Chartbook #13: Health Care in Urban and Rural Areas, Combined Years 1998-2000
By Sharon L. Larson, Ph.D.,
Steven R. Machlin, M.S., Alice Nixon, M.A., Marc Zodet, M.S.
The estimates in this report are based on the most recent data available from MEPS at the time the report was written. However, selected elements of MEPS data may be revised on the basis of additional analyses, which could result in slightly different estimates from those shown here. Please check the MEPS Web site for the most current file releases — www.meps.ahrq.gov.
The mission of AHRQ is to improve the quality, safety, efficiency, and effectiveness of health care for all Americans by:
- Using evidence to improve health care.
- Improving health care outcomes through research.
- Transforming research into practice.
This chartbook examines the differences in health care access, use, and expenses between urban and rural areas. Counties are classified along the urban-rural continuum according to whether they are metropolitan statistical areas (MSAs) and, if not, their proximity to an MSA. An MSA is a large population nucleus with a high degree of economic and social interaction. The categories along the continuum are metro (counties in an MSA), near-metro, near-rural, and rural. The last category includes only the most rural areas in the Nation, home to about 3.2 million Americans. For more information on the classification, see the Definitions of Terms section at the end of this chartbook.
Some highlights of information in this chartbook follow.
The percent of people under 65 who were uninsured was not significantly different in rural counties than in the others. People living in near-rural counties were more likely to be uninsured for an entire year than people living in metro or near-metro counties. Uninsured residents of rural counties were more likely than their metro counterparts to have a usual source of care. Among both non-elderly and elderly people with ambulatory expenses, residents of rural counties had the fewest visits per year. This difference was especially prominent for the elderly, among whom rural residents had only half as many visits each year as metro residents (5.5 visits versus 10.9). Among elderly people with ambulatory expenses, residents of rural counties had the lowest average annual expenses: $662, compared with $1,432 or higher in the other areas. The percent of the population under 65 years in rural counties who had expenses for prescription medicines was not significantly different from the percent in other counties.
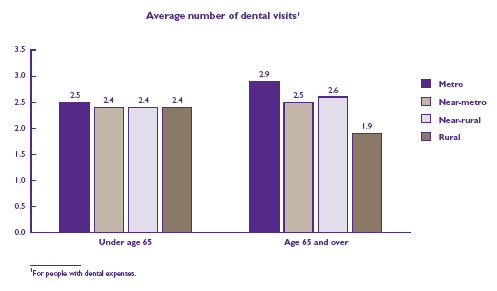
The likelihood of having dental expenses generally declined with increasing rurality. For non-elderly people with dental expenses, the average annual number of visits did not vary significantly among the urban-rural categories. However, elderly rural residents with dental expenses had an average of one fewer dental visit per year than their counterparts in metropolitan areas.
Return To Table Of Contents
In 2000, approximately 49 million people lived in nonmetropolitan counties in the United States, about 3 million of whom lived in rural counties (nonmetropolitan counties with no town or city with a population of 2,500 or more). Researchers and policymakers have found that the demographics, culture, and structural conditions of rural settings are associated with the insurance status and health care use and expenditure patterns of rural residents. Because of the scarcity of providers and facilities in rural places and the resulting potential for lack of access to health care, rural populations have been designated as a priority group in the health policy arena.This chartbook presents data from the Medical Expenditure Panel Survey (MEPS), which is sponsored by the Agency for Healthcare Research and Quality (AHRQ). The charts illustrate similarities and differences between urban and rural places on measures of health care access, use, and expenses. The data shown are for the U.S. civilian noninstitutionalized population for the period 1998-2000.The chartbook is organized into three sections. The first compares people in four categories along the urban-rural spectrum (metro, near-metro, near-rural, and rural) by selected characteristics, including age, race/ethnicity, sex, income, health status, and activity limitations. The second section provides information on insurance status and access to care. The third section focuses on variations in use and expenses for ambulatory care, prescription medicines, and dental care. Comparisons across urban-rural categories are presented for either the population under 65 years of age (also referred to as non-elderly), the population 65 years of age and over (also referred to as elderly), or both.
The four urban-rural categories used in this report are based on a number of factors: whether a county is in a metropolitan statistical area, proximity to a metropolitan statistical area, and population size of the largest city in the county. See the Definitions of Terms section for more details.
This chartbook and other MEPS publications are available electronically on the MEPS Web site at http://www.meps.ahrq.gov/.
Return To Table Of Contents
The comparisons in this chartbook are based on estimated annual averages for the period 1998-2000 using data from MEPS. Data for these three years were combined to provide larger sample sizes that would improve the precision of rural county estimates and the ability to detect significant differences with other county types. Expense data for 1998 and 1999 were adjusted to 2000 dollars based on the Consumer Price Index for all goods and services.MEPS surveys a nationally representative sample of households for information on the health status, health care use and expenses, and health insurance coverage of individuals and families in the U.S. civilian noninstitutionalized population. Data for this report come from MEPS public use files HC-028 (1998 Full Year Consolidated File), HC-038 (1999 Full Year Consolidated File), and HC-050 (2000 Full Year Consolidated File). The utilization information is based on medical events reported by households, and the payment information is based on data collected from both households and medical providers.Expenses in MEPS are payments to hospitals, physicians, and other health care providers for services reported by the survey respondents. They were specifically defined as direct payments by individuals, private insurance, Medicaid, Medicare, and other sources for care provided during the year.MEPS is based on a complex sample design, so survey estimates are subject to statistical sampling error. Unless otherwise noted, only differences between groups that are statistically significant at the 0.05 level (not likely to be attributable to sampling error) are noted in the text.
In a few instances, differences that appear large may not be statistically significant because estimates for rural areas are based on much smaller samples, so they can have relatively large standard errors.
Return To Table Of Contents
Section 1: Demographic Characteristics
Variations in factors such as age, sex, socioeconomic status, and physical health across geographic areas can provide insight into differences in health care use and expenses. For example, people living in rural areas are more likely to be elderly and more likely to have activity limitations than residents of metro areas. Demographic characteristics as well as urban-rural location are related to differences in health care access and use. This section examines the extent to which demographics and health status differ across the four urban-rural categories.
Return To Table Of Contents
Proportionately more elderly in rural than metro counties
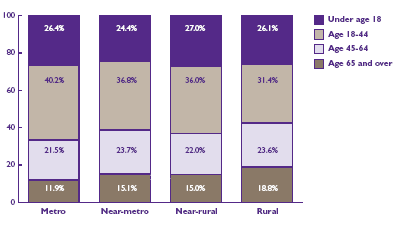
• There were proportionately more elderly people in rural counties (18.8%) than in metro counties (11.9%). However, differences between rural counties and other county types were not statistically significant.
• The percent of residents ages 18-44 was lowest in rural counties (31.4%, compared to 36.0%-40.2% for the other three groups).
• Approximately one-quarter of the population were children under 18 in all four categories.
• The proportion of people ages 45-64 did not vary significantly by type of county.
 |
| Geographic Proportion of Population by Age Groups |
| |
Metro |
Near-Metro |
Near-Rural |
Rural |
| Under age 18 |
26.4% |
24.4% |
27.0% |
26.1% |
| Age 18-44 |
40.2% |
36.8% |
36.0% |
31.4% |
| Age 45-64 |
21.5% |
23.7% |
22.0% |
23.6% |
| Age 65 and over |
11.9% |
15.1% |
15.0% |
18.8% |
|
Return To Table Of Contents
Higher proportion of elderly in rural counties are women
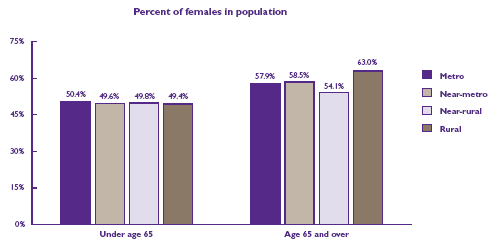
• While there are more elderly women than men in all county types, the proportion of elderly people who were women was significantly higher in rural counties (63.0%) than in near-rural counties (54.1%).
• Among the population under 65 years of age, there were approximately equal numbers of males and females regardless of urban-rural location.
 |
| Percent of females in population |
| |
Under Age 65 |
Age 65 and over |
| Metro |
50.4% |
57.9% |
| Near-Metro |
49.6% |
58.5% |
| Near-Rural |
49.8% |
54.1% |
| Rural |
49.4% |
63.0% |
|
Return To Table Of Contents
Educational attainment generally lower for rural residents
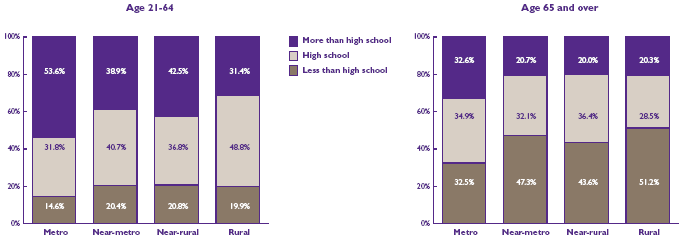
• Among non-elderly adults, less than one-third of rural residents had post-high school education (31.4%), compared to 53.6% in metro counties and 42.5% in near-rural counties. The proportion of non-elderly adults with post-high school education was higher in metro areas than in near-metro counties. • About half of the elderly in rural counties had less than a high school education, compared with only about a third of the elderly in metro counties.
 |
| Educational Attainment |
| |
Less than high school |
High school |
More than high school |
| |
Age 21-64 |
Age 65 and over |
Age 21-64 |
Age 65 and over |
Age 21-64 |
Age 65 and over |
| Metro |
14.6% |
32.5% |
31.8% |
34.9% |
53.6% |
32.6% |
| Near-metro |
20.4% |
47.3% |
40.7% |
32.1% |
38.9% |
20.7% |
| Near-rural |
20.8% |
43.6% |
36.8% |
36.4% |
42.5% |
20.0% |
| Rural |
19.9% |
51.2% |
48.8% |
28.5% |
31.4% |
20.3% |
|
Return To Table Of Contents
Higher proportion of poor/near poor in less urban counties
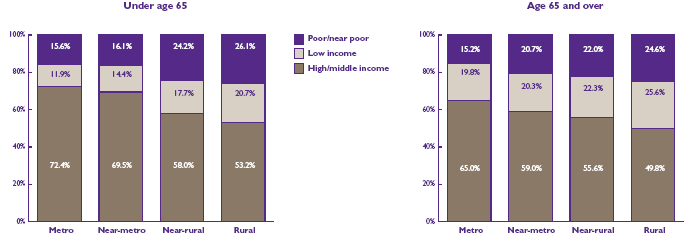
• Approximately one-quarter of non-elderly people in near-rural and rural areas were in the poor/near poor income category, having income less than 125% of the poverty line. In comparison, only about 16% of non-elderly people in the two more urban areas (metro and near-metro) were poor or near poor.
• Among people under 65, only 58.0% of residents in near-rural counties and 53.2% in rural counties were in the high/middle income category (income over 200% of the poverty line), compared to 72.4% of the non-elderly residents in metro areas and 69.5% of those in near-metro areas.
• Among the elderly, residents of counties in near-rural and rural areas were more likely to have incomes in the poor/near poor category (22.0% and 24.6%), compared to 15.2% of those in metro areas.
• Metro areas had the largest proportion of elderly residents in the high/middle income group, 65.0%, compared to 49.8%-59.0% in the other areas.
 |
| Geographic Proportion of Population by Income |
| |
Poor/near poor |
Low income |
High/middle income |
| |
Under age 65 |
Age 65 and over |
Under age 65 |
Age 65 and over |
Under age 65 |
Age 65 and over |
| Metro |
15.6% |
15.2% |
11.9% |
19.8% |
72.4% |
65.0% |
| Near-metro |
16.1% |
20.7% |
14.4% |
20.3% |
69.5% |
59.0% |
| Near-rural |
24.2% |
22.0% |
17.7% |
22.3% |
58.0% |
55.6% |
| Rural |
26.1% |
24.6% |
20.7% |
25.6% |
53.2% |
49.8% |
|
Return To Table Of Contents
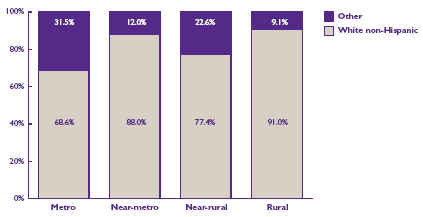
Metro counties have higher proportion of minorities
• There were proportionately more racial and ethnic minorities in metro areas (31.5%) than in rural counties (9.1%) or near-metro counties (12.0%).
• Minorities in this chart comprise all people not classified as white non-Hispanic. More detailed racial/ethnic groups are not shown because estimates for these smaller subgroups were not statistically reliable across the four urban-rural categories.
 |
| Proportion of Minorities |
| |
White non-Hispanic |
Other |
| Metro |
68.6% |
31.5% |
| Near-metro |
88.0% |
12.0% |
| Near-rural |
77.4% |
22.6% |
| Rural |
91.0% |
9.1% |
|
Return To Table Of Contents
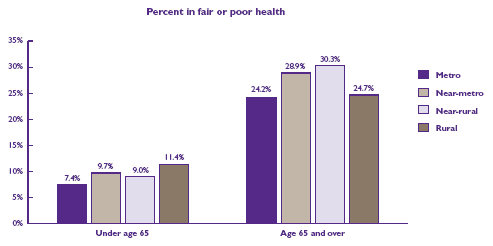
Metro residents less likely to be in fair or poor health
• Among the non-elderly, metro residents were less likely to have fair or poor health (7.4%) than near-metro residents (9.7%).
• Although the proportion of non-elderly people in fair or poor health appears to be highest in rural counties (11.4%), it is not significantly higher than for other groups.
• Elderly residents in near-metro and near-rural counties were somewhat more likely than metro residents to have fair or poor health (28.9% and 30.3%, compared to 24.2%).
• While the percent of elderly people in fair or poor health appears to be lower in rural counties than in near-metro or near-rural counties, these differences are not statistically significant.
 |
| Percent in fair or poor Health |
| |
Under age 65 |
Age 65 and over |
| Metro |
7.4% |
24.2% |
| Near-metro |
9.7% |
28.9% |
| Near-rural |
9.0% |
30.3% |
| Rural |
11.4% |
24.7% |
|
Return To Table Of Contents
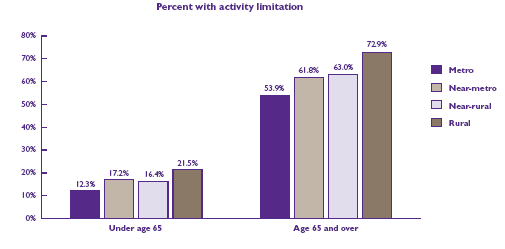
Rural residents more likely to have activity limitation
• About one in five non-elderly residents of rural counties (21.5%) had one or more activity limitations, a notably higher proportion than for metro residents (12.3%). The percent of non-elderly people with limitations was also higher for near-metro (17.2%) and near-rural counties (16.4%) than for metro residents.
• Among the elderly, residents of rural counties were much more likely to have activity limitations (72.9%) than residents of either metro counties (53.9%) or near-metro counties (61.8%).
 |
| Percent with activity limitation |
| |
Under age 65 |
Age 65 and over |
| Metro |
12.3% |
53.9% |
| Near-metro |
17.2% |
61.8% |
| Near-rural |
16.4% |
63.0% |
| Rural |
21.5% |
72.9% |
|
Return To Table Of Contents
Adequate access to health care services can significantly influence health care use and health outcomes. There has been research that suggests rural residents have less access to health care services than residents of more densely populated areas. This section examines variations in the likelihood of having health insurance coverage and the likelihood of having a usual source of care—both of which can affect access to health care— across the urban-rural spectrum.• Health insurance plays a critical role in ensuring that Americans obtain timely medical care and have protection against expensive health care costs.
• Another measure used to reflect access to care is whether people have a usual source of care—a person or place they usually go to if they are sick or need advice about their health. Lacking a usual source of care may also have important implications for the quality and continuity of care received.
Return To Table Of Contents
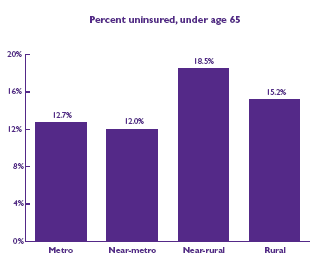
Percent uninsured higher in near-rural counties
• Among the population under 65 years of age, residents of near-rural counties were more likely to be uninsured for an entire year (18.5%) than those living in metro counties (12.7%) or near-metro counties (12.0%).
• The percent uninsured in rural counties (15.2%) did not differ significantly from the other groups.
 |
| Percent uninsured, under Age 65 |
| Metro |
12.7% |
| Near-metro |
12.0% |
| Near-rural |
18.5% |
| Rural |
15.2% |
|
Return To Table Of Contents
About one-third of the elderly in all county types lack Medicare supplemental insurance
• The likelihood of not having Medicare supplemental coverage was similar for metro, near-metro, and near-rural counties, ranging from 29.4% to 32.8%.
• Although the proportion of elderly people without Medicare supplemental coverage appears highest in rural counties (38.6%), the difference from other county types is not significant.
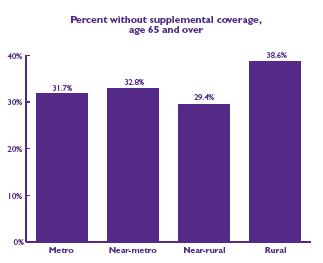 |
Percent without supplemental coverage
age 65 and over |
| Metro |
31.7% |
| Near-metro |
32.8% |
| Near-rural |
29.4% |
| Rural |
38.6% |
|
Return To Table Of Contents
Elderly and children show little variation across areas in having a usual source of care
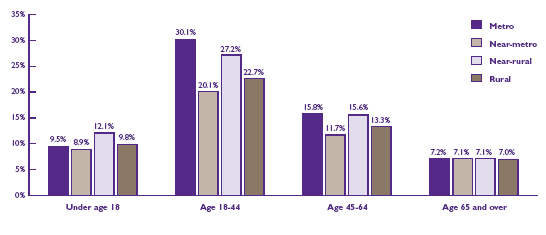
• For each of the four urban-rural categories, only about 7 percent of adults 65 and over lacked a usual source of care.
• Regardless of type of county, about 1 of every 10 children under 18 lacked a usual source of care.
• Among adults 18-44 years, lacking a usual source of care was more common for residents of metro counties (30.1%) and near-rural counties (27.2%) than for those living in near-metro counties (20.1%).
• For adults ages 45-64, lacking a usual source of care was more common for metro residents (15.8%) than for those living in near-metro counties (11.7%).
• For all age groups, the percent of people without a usual source of care was not significantly different for rural counties than for other areas.
• Regardless of county type, people ages 18-44 were the least likely to have a usual source of care.

 |
| Percent without a usual source of care |
| |
Metro |
Near-Metro |
Near-Rural |
Rural |
| Under age 18 |
9.5% |
8.9% |
12.1% |
9.8% |
| Age 18-44 |
30.1% |
20.1% |
27.2% |
22.7% |
| Age 45-64 |
15.8% |
11.7% |
15.6% |
13.3% |
| Age 65 and over |
7.2% |
7.1% |
7.1% |
7.0% |
|
Return To Table Of Contents
Uninsured metro residents most likely to lack a usual source of care
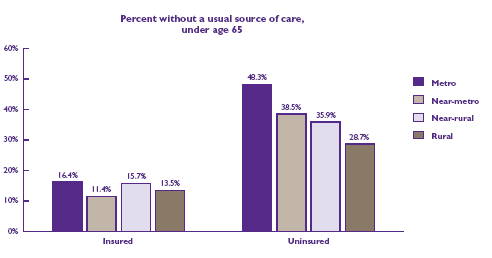
• Uninsured people under 65 were more likely to lack a usual source of care if they lived in more urban areas, with the proportion ranging from 48.3% in metro areas to 28.7% in rural counties.
• There was less variation across urban-rural categories for the insured than for the uninsured. Among insured people under 65, residents of metro and near-rural counties were more likely to lack a usual source of care (about 16%) than near-metro residents (11.4%).
 |
Percent without a usual source of care
under age 65 |
| |
Insured |
Uninsured |
| Metro |
16.4% |
48.3% |
| Near-metro |
11.4% |
38.5% |
| Near-rural |
15.7% |
35.9% |
| Rural |
13.5% |
28.7% |
|
Return To Table Of Contents
While the likelihood of using health care, as well as the amount of health care expenses, are associated with many individual and demographic characteristics, population density and geographic proximity to health care providers are also factors. Some studies suggest that rural residents have less access to primary care, specialty care, and other health services than residents of counties with a larger population or near metropolitan areas. This section examines variations in health care use and expenses across the four county types for three types of services: ambulatory care (office-based and hospital outpatient visits), prescription medicines, and dental services.For each type of service, average expenses are shown for people having any expenses during the year. Charts illustrating the percent of the population with any expenses are also shown. These charts can generally be interpreted as the proportion of people who had at least one visit during the year since only a negligible portion of the population visits a health care provider without incurring expenses.
Return To Table Of Contents
Ambulatory Care
Ambulatory care includes the treatment of acute conditions and chronic diseases, both preventive and diagnostic services. It generally serves as the entry point for most health care in the United States. The majority of Americans have at least one visit each year to a health care professional in an ambulatory setting. The outcome for those who cannot obtain these services may be poorer general health and quality of life. While most Americans have ambulatory care expenses during the year, this section illustrates some noteworthy variations in levels of use and expenses across urban-rural categories.
Return To Table Of Contents
Percent of people with ambulatory care expenses fairly similar across areas
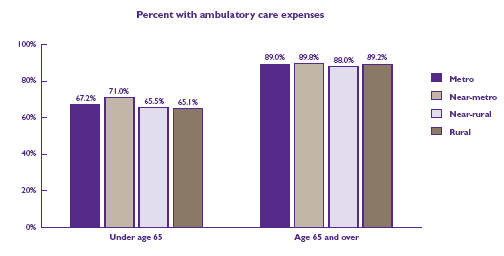
• Among the non-elderly population, near-metro residents were slightly more likely to have ambulatory expenses (71.0%) than those living in metro counties (67.2%) or near-rural counties (65.5%). However, the proportion of the rural group with expenses (65.1%) was not significantly different from the other groups.
• Regardless of urban-rural category, approximately 9 of every 10 elderly people had ambulatory expenses.
 |
| Percent with ambulatory care expenses |
| |
Under Age 65 |
Age 65 and Over |
| Metro |
67.2% |
89.0% |
| Near-metro |
71.0% |
89.8% |
| Near-rural |
65.5% |
88.0% |
| Rural |
65.1% |
89.2% |
|
Return To Table Of Contents
Rural residents have fewer ambulatory visits
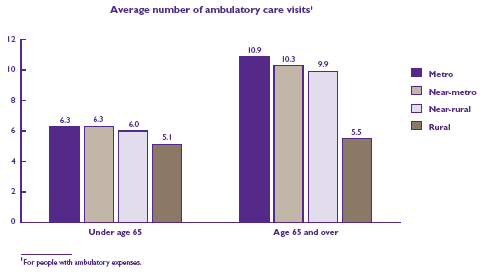
• Among people with an ambulatory expense, residents of rural counties had the lowest average number of ambulatory visits per year. This was true in both the elderly and non-elderly groups, but the difference was especially prominent for the elderly.
• Among the elderly with ambulatory expenses, rural residents had about half as many ambulatory visits each year as metro residents (5.5 vs. 10.9 visits).
• Among the non-elderly with ambulatory expenses, rural residents had an average of about one fewer ambulatory visit per year than those in other counties (5.1 vs. 6.0-6.3)
 |
| Average number of ambulatory care visits1 |
| |
Under Age 65 |
Age 65 and Over |
| Metro |
6.3 |
10.9 |
| Near-metro |
6.3 |
10.3 |
| Near-rural |
6.0 |
9.9 |
| Rural |
5.1 |
5.5 |
| 1 For people with ambulatory expenses. |
|
Return To Table Of Contents
Area differences in ambulatory visits greater for people with activity limitation
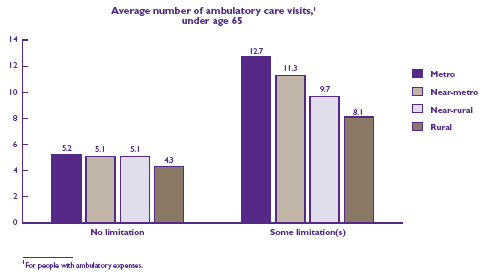
• Among non-elderly people with ambulatory expenses, those in rural counties had a lower average number of ambulatory care visits than residents of more urban places. This difference was especially pronounced for people with at least one activity limitation.
• For the non-elderly with at least one limitation and some expenses for ambulatory care, the estimated average number of visits was significantly lower in rural counties (8.1) than in metro (12.7) or near-metro counties (11.3).
• For the non-elderly with no limitations and some expenses for ambulatory care, the average number of ambulatory visits was lower in rural counties (4.3) than in metro counties (5.2).
• Similar comparisons for the elderly are not shown because of limited sample size for the rural group.
 |
Average number of ambulatory care visits 1
under age 65 |
| |
No Limitation |
Some Limitation(s) |
| Metro |
5.2 |
12.7 |
| Near-metro |
5.1 |
11.3 |
| Near-rural |
5.1 |
9.7 |
| Rural |
4.3 |
8.1 |
| 1For people with ambulatory expenses. |
|
Return To Table Of Contents
People in rural counties have lower ambulatory expenses
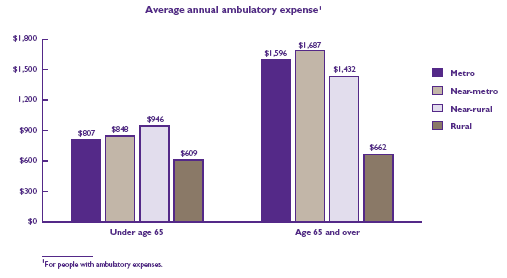
• Among both non-elderly and elderly people with ambulatory expenses, residents of rural counties had the lowest average annual expenses. Differences from other county types were especially large for the elderly.
• Among the elderly with ambulatory expenses, the average expense was less than half as large for people in rural counties ($662) as for people in the other urban-rural categories ($1,432-$1,687).
• Among the non-elderly with ambulatory expenses, residents of rural counties had lower average ambulatory expenses ($609) than those in the other urban-rural categories ($807-$946).
 |
| Average annual ambulatory expense1 |
| |
Under Age 65 |
Age 65 and Over |
| Metro |
$807 |
$1,596 |
| Near-metro |
$848 |
$1,687 |
| Near-rural |
$946 |
$1,432 |
| Rural |
$609 |
$662 |
| 1For people with ambulatory expenses. |
|
Return To Table Of Contents
Ambulatory expenses for children similar across areas
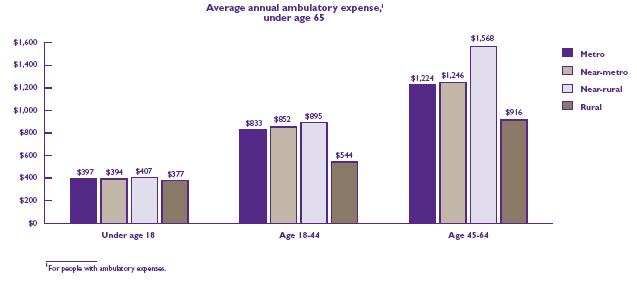
• Average ambulatory expenses for children under 18 with expenses were similar across the urban-rural categories (approximately $400).
• Among people ages 18-44 with ambulatory expenses, those in rural counties had lower average ambulatory expenses ($544) than those in the other categories ($833-$895).
• Among people ages 45-64 with ambulatory expenses, those living in near-rural counties had higher average ambulatory expenses ($1,568) than those living in rural counties ($916).
 |
Average annual ambulatory expense1
under age 65 |
| |
Under Age 18 Age 18-44 |
Age 45-64 |
| Metro |
$397 $833 |
$1,224 |
| Near-metro |
$394 $852 |
$1,246 |
| Near-rural |
$407 $895 |
$1,568 |
| Rural |
$377 $544 |
$916 |
| 1For people with ambulatory expenses. |
|
Return To Table Of Contents
Ambulatory expenses for males under 65 lowest in rural counties
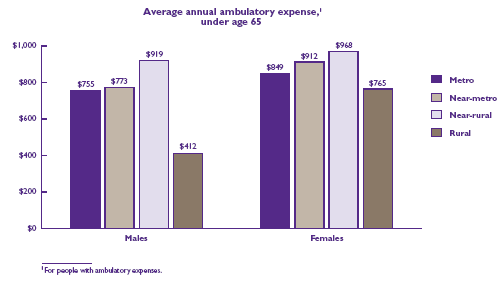
• Non-elderly males with ambulatory expenses who lived in rural counties had substantially lower average expenses ($412) than their counterparts in the other urban-rural categories (ranging from $755 to $919).
• Non-elderly females with ambulatory expenses showed less variation than males in average expenses across urban-rural categories. However, non-elderly females living in rural counties had lower ambulatory expenses than those in near-rural counties ($765 vs. $968).
• Average ambulatory expenses in rural counties were nearly twice as large for females as for males. There was a smaller gender difference in metro counties and no significant difference by gender in the other two categories.
• Similar comparisons for the elderly are not shown because of limited sample size for the rural group.
 |
Average annual ambulatory expense1
under age 65 |
| |
Males |
Females |
| Metro |
$755 |
$849 |
| Near-metro |
$773 |
$912 |
| Near-rural |
$919 |
$968 |
| Rural |
$412 |
$765 |
| 1For people with ambulatory expenses. |
|
Return To Table Of Contents
Prescription Medicines
Outpatient prescription medicines play an ever-increasing role in the health care system of the United States. The share of overall health spending in the U.S. community population that goes for prescription medicines has risen rapidly in recent years, from about 12 percent in 1996 to about 18 percent in 2001. Prescription medicines are a key health policy issue, as evidenced by concerns about the rising costs of prescriptions and the recent enactment of a Medicare drug benefit. Along with other health care provider shortages in rural places, there are fewer pharmacists per capita in rural places than in more populated settings. Additionally, there may be differences in prescribing patterns in the most rural places because there are fewer health care providers. This section provides data comparing prescription medicine use and expenses across urban-rural categories.
Return To Table Of Contents
Percent of elderly with prescription medicine expenses similar across areas
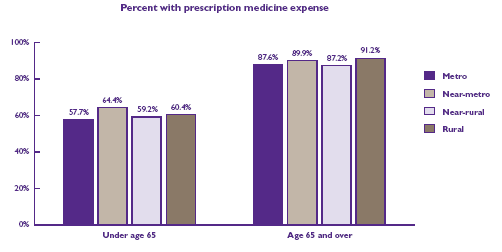
• In all of the urban-rural categories, approximately 9 in 10 elderly residents had expenses for prescribed medicines. Elderly residents of rural counties were slightly more likely to have prescription medicine expenses (91.2$) than the elderly in metro counties (87.6%).
• Non-elderly residents of near-metro counties were slightly more likely to have expenses for prescribed medicine (64.4%) than those living in metro counties (57.7%) or near-rural counties (59.2%). The percent for rural counties did not differ significantly from the other groups.
 |
| Percent with prescription medicine expense |
| |
Under Age 65 |
Age 65 and Over |
| Metro |
57.7% |
87.6% |
| Near-metro |
64.4% |
89.9% |
| Near-rural |
59.2% |
87.2% |
| Rural |
60.4% |
91.2% |
|
Return To Table Of Contents
Average prescription medicine expenses vary little across urban-rural continuum
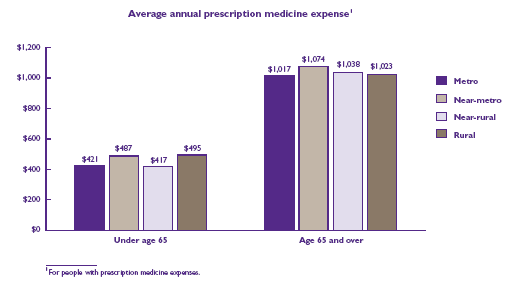
• Among the non-elderly with expenses for prescribed medicines, annual per-person expenses were slightly higher for near-metro residents ($487) than for metro residents ($421) or near-rural residents ($417). The average for rural residents ($495) was not significantly different from the average for the other types of counties.
• Among elderly people with prescription expenses, the average annual expense per person did not vary significantly across the urban-rural categories.
• For each urban-rural category, the average annual prescription medicine expense among those with such expenses was at least twice as high for elderly as non-elderly people.
 |
| Average annual prescription medicine expense1 |
| |
Under Age 65 |
Age 65 and Over |
| Metro |
$421 |
$1,017 |
| Near-metro |
$487 |
$1,074 |
| Near-rural |
$417 |
$1,038 |
| Rural |
$495 |
$1,023 |
| 1For people with prescription medicine expenses. |
|
Return To Table Of Contents
Dental Care
Access to and use of dental care has been consistently identified as an important factor in a person’s overall health. For example, periodontal disease has been identified as a potential risk factor associated with a number of health conditions, including cardiovascular disease, cerebrovascular disease, diabetes, and osteoporosis. Factors such as socioeconomic status, insurance coverage, transportation availability, number of dentists in the area, and presence of community dental care programs have been found to be associated with disparities in dental care use and oral health status. This section of the chartbook compares dental care use and expenses across the four urban-rural categories.
Return To Table Of Contents
Residents of rural counties less likely to have dental expenses
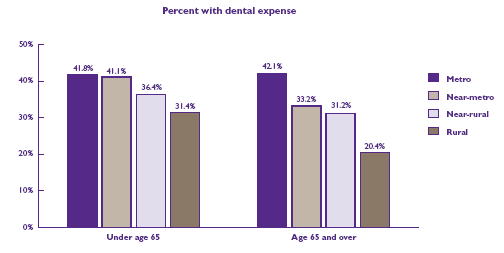
• Among the non-elderly, 31.4% of those in rural counties had dental expenses, a significantly lower proportion than for residents of metro or near-metro counties (approximately 41% each).
• Among individuals 65 and over, the likelihood of having dental expenses generally declined with increasing rurality, ranging from 42.1% in metro counties to 20.4% in rural counties.
 |
| Percent with dental expense |
| |
Under Age 65 |
Age 65 and Over |
| Metro |
41.8% |
42.1% |
| Near-metro |
41.1% |
33.2% |
| Near-rural |
36.4% |
31.2% |
| Rural |
31.4% |
20.4% |
|
Return To Table Of Contents
Frequency of dental visits lower for rural elderly
• Among the elderly with dental expenses, residents of rural counties had an average or one fewer dental visit per year than metro residents (1.9 vs. 2.9).
• The average annual number of dental visits for non-elderly people with expenses for dental care did not vary significantly among the urban-rural categories.
 |
| Average number of dental visits1 |
| |
Under Age 65 |
Age 65 and Over |
| Metro |
2.5 |
2.9 |
| Near-metro |
2.4 |
2.5 |
| Near-rural |
2.4 |
2.6 |
| Rural |
2.4 |
1.9 |
| 1For people with dental expenses. |
|
Return To Table Of Contents
Average expenses for dental care higher in metro counties
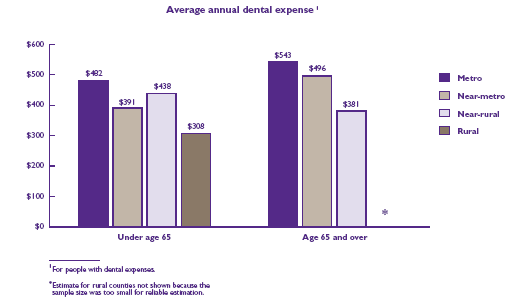
• Among the non-elderly with dental expenses, average annual expenses per person were higher for metro residents ($482) than for residents of near-metro areas ($391) or rural counties ($308).
• Average annual dental expenses for elderly metro residents with such expenses ($543) were substantially higher than expenses for elderly residents of near-rural counties ($381).
 |
| Average annual dental expense1 |
| |
Under Age 65 |
Age 65 and Over |
| Metro |
$482 |
$543 |
| Near-metro |
$391 |
$496 |
| Near-rural |
$438 |
$381 |
| Rural |
$308 |
* |
| 1For people with dental expenses. *Estimate for rural counties not shown because the sample size was too small for
reliable estimation.
|
|
Return To Table Of Contents
Eberhardt MS, Ingram DD, Makuc DM, et al. Urban and rural health chartbook: Health, United States, 2001. Hyattsville, MD: National Center for Health Statistics, 2001.
Ezzati-Rice TM, Kashihara D, Machlin SR. Health care expenses in the United States, 2000. Rockville (MD): Agency for Healthcare Research and Quality; 2004. MEPS Research Findings No. 21. AHRQ Pub. No. 04-0022.
Gamm LD, Hutchison LL, Dabney BJ, et al., eds. Rural Healthy People 2010: A companion document to Healthy People 2010. Vol. 2. College Station, TX: Texas A&M University System Health Science Center, School or Rural Public Health, Southwest Rural Health Research Center, 2003.
Larson SL, Fleishman JA. Rural-urban differences in usual source of care and ambulatory service use: Analyses of national data using Urban Influence Codes. Medical Care 2003; 41(7 Suppl):III65-III74.
Machlin SR, Cohen JW, Zuvekas SH, et al. Health care expenses in the community population, 1996. Rockville (MD): Agency for Healthcare Research and Quality; 2001. MEPS Chartbook No. 5. AHRQ Pub. No. 01-0027.
National Rural Health Association. What's different about rural health care? Web site: http://www.nrharural.org/about/sub/different.html. Accessed on Apr 28, 2004.
Reid RA, Smith HL. Experience of the Checkerboard Area Health System in planning for rural health care. Public Health Reports 1982 Mar-Apr; 97(2):156-64.
Ricketts TC, ed. Rural health in the Southwest Rural Health Research Center, 2003. United States. New York: Oxford University Press, 1999.
Please consult the MEPS Web site at http://www.meps.ahrq.gov/ for an updated publications list and other information from MEPS. For additional information, contact the MEPS Project Director at mepspd@ahrq.gov.
Return To Table Of Contents
Urban-Rural Categories
There is a lack of consensus in health services research about what constitutes a rural area. This chartbook examines urban-rural variations by four levels of urbanization: one for counties comprising metropolitan statistical areas (MSAs) and three for counties that are not classified as part of an MSA. An MSA is generally comprised of counties with a large urban center(s) along with other counties that are considered to have a high degree of geographic, economic, and/or social integration with the core urban center(s). The categories are described in Table A.
The four categories used in this report were derived from the Urban Influence Codes established by the U.S. Department of Agriculture. The main reason for creating these categories was to have a small number of categories to illustrate the relative continuum from most urban to most rural.
| Table A. Urban-rural categories used in this report |
| Chartbook category |
Urban Influence Code |
MSA status |
Characteristics/ proximity |
Population |
| Metro |
1 |
MSA |
Large (central and fringe counties) |
1 million or more |
| 2 |
MSA |
Small |
Less than 1 million |
| Near-metro |
3 |
Non-MSA |
Adjacent to large MSA |
City of population 10,000 or more |
| 4 |
Non-MSA |
Adjacent to large MSA |
No city of population 10,000 or more |
| 5 |
Non-MSA |
Adjacent to small MSA |
City of population 10,000 or more |
| 6 |
Non-MSA |
Adjacent to small MSA |
No city of population 10,000 or more |
| Near-rural |
7 |
Non-MSA |
Not adjacent to MSA |
City of population 10,000 or more |
| 8 |
Non-MSA |
Not adjacent to MSA |
City of population 2,500-9,999 |
| Rural |
9 |
Non-MSA |
Not adjacent to MSA |
No city
or city of population less than 2,500 |
| Note: MSA is metropolitan statistical area. Urban Influence Codes are established by the U.S. Department of Agriculture. |
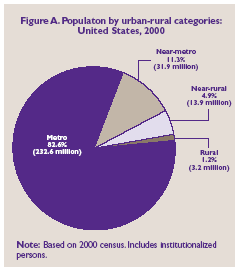 |
Figure A. Population by urban-rural categories:
United States, 2000 |
| Metro |
82.6% |
232.6 million |
| Near-metro |
11.3% |
31.9 million |
| Near-rural |
4.9% |
13.9 million |
| Rural |
1.2% |
3.2 million |
| Note: Based on 2000 census. Includes institutionalized persons. |
|
Figure A shows the distribution of the U.S. population in 2000 along this urban-rural continuum.
It is important to note that urban-rural classification schemes cannot fully describe the characteristics of individual counties. Locations within a county may vary significantly. For example, some metropolitan counties may be large and have residents who live far from health services.
Type-of-Service Categories
Health care services are categorized according to reports by survey respondents.
Ambulatory service expenses cover visits to medical providers seen in office-based settings or clinics, hospital outpatient departments, and clinics owned and operated by hospitals.
Prescription medicine expenses cover all prescribed medications that were initially purchased or refilled during 1998, 1999, or 2000, as well as diabetic supplies (some of which may have been purchased without a prescription).
Dental service expenses cover any type of dental care, including services provided by general dentists, dental hygienists, dental technicians, dental surgeons, orthodontists, endodontists, and periodontists.
Population Characteristics
In general, population characteristics were measured as of December 31st of the year of study (1998, 1999, or 2000), or the last date that the sample person was part of the civilian noninstitutionized population living in the United States prior to December 31st of that year.
Race/Ethnicity
Comparisons by race/ethnicity in this chartbook are based on the following two race/ethnicity groups: non-Hispanic white and all others. Sample size limitations prevented analysis using specific racial and ethnic groups.
Classification by race and ethnicity is based on information reported in MEPS for each family member. Respondents were asked if the race of the sample person was best described as American Indian, Alaska Native, Asian or Pacific Islander, black, white, or other. They were also asked if the sample person’s main national origin or ancestry was Puerto Rican; Cuban; Mexican, Mexican American, or Chicano; other Latin American; or other Spanish. All persons whose main national origin or ancestry was reported as one of these Hispanic groups, regardless of racial background, are classified as other.
Health Insurance Status
The health insurance categories in this chartbook are based on age and insurance coverage during the year of study (1998, 1999, or 2000).
Individuals under 65 were classified as follows:
Any private health insurance includes individuals with coverage for hospital and physician care (other than Medicare, Medicaid, or other public hospital/physician coverage) at any time during the year. Persons with Armed Forces-related coverage–TRICARE–are also included because the coverage is similar to private insurance. Individuals who have only single-service coverage for services such as dental and vision care are not included in this category.
Public coverage only includes individuals who met both of the following criteria:
• They were not covered by private insurance at any time during the year.
• They were covered by one of the following public programs at some point during the year: Medicare, Medicaid, or other public hospital/ physician coverage.
Uninsured includes individuals who were not covered by Medicare, TRICARE, Medicaid, other public hospital/physician coverage, or private hospital/physician coverage during the year of study. Individuals covered by only noncomprehensive State-specific programs (e.g., Maryland Kidney Disease Program, Colorado Child Health Plan) or private single-service plans (e.g., coverage for dental or vision care only, coverage for accidents or specific diseases) are considered to be uninsured.
Individuals age 65 and older were classified as follows:
Medicare only includes individuals who were covered by Medicare at any point during the year but did not have private insurance or any other public insurance.
Medicare and private insurance includes individuals who had supplemental private insurance in addition to Medicare at some time during the year.
Medicare and other public insurance includes individuals who had Medicaid or other public insurance in addition to Medicare but no private supplemental insurance at any time during the year.
Income Category
Each person was classified according to the total income of his or her family in the given year. Within a household, all individuals related by blood, marriage, or adoption were considered to be a family. Personal income from all family members was summed to create family income. Possible sources of income included annual earnings from wages, salaries, bonuses, tips, and commissions; business and farm gains and losses; unemployment and Workers’ Compensation; interest and dividends; alimony, child support, and other private cash transfers; private pension, IRA withdrawal, Social Security and veterans’ payments; Supplemental Security Income and cash welfare payments from public assistance, Aid to Families with Dependent Children, and Aid to Dependent Children; gains or losses from estates, trusts, partnerships, S corporations, rent, and royalties; and a small amount of other income.
Income category was determined by the ratio of family income to the Federal poverty threshold for the year of study, which varies by family size and age of head of family. The three income categories in the chartbook are defined as follows:
Poor and near poor includes persons in families with incomes less than or equal to 125% of the poverty line.
Low income includes persons in families with incomes greater than 125% and less than or equal to 200% of the poverty line.
Middle and high income includes persons in families with incomes over 200% of the poverty line.
Perceived Health Status
The MEPS respondent was asked to rate the health of each person in the family according to the following categories: excellent, very good, good, fair, and poor. For this report, the five health status categories were collapsed into the following two categories: excellent to good health and fair or poor health.
Activity Limitation Status
A series of questions regarding activity limitations was asked about each family member. Any family member who had one limitation that falls into any of following groups was classified as having a limitation: an ADL (activity of daily living) limitation such as needing help with bathing or dressing; an IADL (instrumental activity of daily living) limitation such as needing help with shopping or laundry; physical difficulty such as problems climbing stairs, walking, or lifting objects; vision or hearing impairment.
Return To Table Of Contents
| Suggested Citation: Chartbook #13: Health Care in Urban and Rural Areas, Combined Years 1998-2000. June 2004. Agency for Healthcare Research and Quality, Rockville, MD.
http://www.meps.ahrq.gov/data_files/publications/cb13/cb13.shtml |
|
