Chartbook #23: Medical Expenditure Panel Survey Insurance Component 2018 Chartbook
Acknowledgments
This chartbook was prepared by Jessica Vistnes, G. Edward Miller, Philip Cooper, Patricia Keenan, and Asako Moriya of the Center for Financing, Access, and Cost Trends (CFACT) in the Agency for Healthcare Research and Quality (AHRQ). Primary editing was performed by Jessica Vistnes and Edward Miller.
The authors appreciate the efforts of Eneli Coakley, Zhengyi Fang, and Bidong Liu of Social and Scientific Systems in preparing the exhibits in the chartbook, the data production work of Brandon Flanders of the U.S. Census Bureau, and the production assistance of Doreen Bonnett, Nicole Shulman, and Michelle Roberts of AHRQ.
Reviewers of this publication were Joel W. Cohen, Director of CFACT; Steve Machlin, Director, David Kashihara, Senior Health Statistician, and Pradip Muhuri, Survey Statistician (Division of Statistical Research and Methods in CFACT); Tom Selden, Director, Steve Hill, Senior Economist, and Sandy Decker, Yao Ding, Paul Jacobs, and Chandler McClellan (Service Fellows) (Division of Research and Modeling in CFACT).
Introduction
Background
Data Presentation
References
Executive Summary
Section 1: Health Insurance Offer Rates
Section 2: Employee Eligibility and Enrollment
Section 3: Health Insurance Premiums
Section 4: Employee and Employer Premium Contributions
Section 5: Employee Cost Sharing
The data used in this report are from the Insurance Component of the Medical Expenditure Panel Survey. Information about this survey, including sample design, data collection, sample sizes, and response rates, can be found
at https://meps.ahrq.gov/survey_comp/Insurance.jsp.
This product is in the public domain and may be used and reprinted without permission in the United States for noncommercial purposes, unless materials are clearly noted as copyrighted in the document. No one may reproduce copyrighted materials without the permission of the copyright holders. Users outside the United States must get permission from AHRQ to reprint or translate this product.
Anyone wanting to reproduce this product for sale must contact AHRQ for permission.
Agency for Healthcare Research and Quality
5600 Fishers Lane
Rockville, MD 20857
www.ahrq.gov
Suggested Citation
Medical Expenditure Panel Survey Insurance Component 2018 Chartbook.
Rockville, MD: Agency for Healthcare Research and Quality;
September 2019. AHRQ Publication No. 19-0077.
https://meps.ahrq.gov/mepsweb/data_files/publications/cb23/cb23.shtml.
The Medical Expenditure Panel Survey Insurance Component (MEPS-IC) is an annual survey of private employers and State and local governments. The MEPS-IC produces national and State-level estimates of employer-sponsored insurance, including offered plans, costs, employee eligibility, and number of enrollees. The MEPS-IC is sponsored by the Agency for Healthcare Research and Quality and is fielded by the U.S. Census Bureau.
This chartbook provides both single-year and multiyear trend analyses using private-sector MEPS-IC data from 2005 to 2018. To best convey key information from the MEPS-IC, the report is presented in five sections: Health Insurance Offer Rates; Employee Eligibility and Enrollment; Health Insurance Premiums; Employee and Employer Premium Contributions; and Employee Cost Sharing. Each section provides charts and discussion with links to MEPS-IC data tables that contain the estimates and standard errors for each exhibit.
Many of the estimates in this publication are categorized by firm sizes that are relevant to recent changes in national healthcare policy. The firm-size categories used in the charts and tables are based on actual employment counts rather than full-time equivalent (FTE) counts, because the MEPS-IC does not collect FTE employment figures.
Each section discusses the estimates to highlight trends and differences by employer and workforce characteristics. If a comparison of estimates is presented in the discussion, any differences are statistically significant at the 0.05 level, unless otherwise noted. In some cases, differences noted in the text, in estimates as well as statistical significance of comparisons, may vary slightly from calculations performed using data in the exhibits, MEPS-IC data available on the MEPS website, or MEPS-IC Statistical Briefs due to rounding. All dollar estimates are nominal (not adjusted for inflation).
Return to Table of Contents
The IC is one of three annual component surveys that make up MEPS. The other two components are the Household Component (HC) and the Medical Provider Component (MPC). The HC is a nationally representative survey of the U.S. civilian noninstitutionalized population that collects data at both the person and household levels. The MPC collects information from a sample of physicians, hospitals, home health agencies, and pharmacies that provided services to HC respondents.
The MEPS-IC uses two independent samples: the private sector and the public sector. The private-sector sample is composed of about 42,000 business establishments from more than 7 million establishments found on the Business Register at the U.S. Census Bureau, with 5.5 percent of the sample determined during the data collection process to be out of scope. In 2018, the response rate for the private sector was 67.8 percent of the remaining in-scope sample units.
An establishment is a single business entity or location. Firms (also often referred to as companies) can include one or more establishments. An example of a multi-establishment firm is a chain of grocery stores, where the establishments of the firm are the sites of the individual grocery stores. The charts and tables in this publication report characteristics within firm-based size categories.
The public-sector sample of the MEPS-IC selects almost 3,000 State and local government agencies. However, this report focuses only on the private sector.
Additional information on MEPS-IC sampling can be found in Sample Design of the 2014 Medical Expenditure Panel Survey Insurance Component (Davis, 2015; PDF).
There was no MEPS-IC survey to collect 2007 data due to the transition from retrospective to current-year data collection. This methodological change improved the accuracy and timeliness of the IC estimates. More information about this design change can be found in
Switching From Retrospective to Current-Year Data Collection in the Medical Expenditure Panel Survey – Insurance Component (Kearney & Sommers, 2007). References to changes in all years from 2005 to 2018 in the text refer to 1-year changes except for changes in 2008, which refer to the period from 2006 to 2008.
Return to Table of Contents
For purposes of the analyses presented in this chartbook, the District of Columbia is treated as a State.
In addition, exhibits are organized by category (e.g., premium type, firm size), so
references to exhibits in the text may not be in numeric order (e.g., Exhibits 3.1, 3.3, and 3.5 instead of 3.1, 3.2, and 3.3).
Return to Table of Contents
Davis K. Sample design of
the 2017 Medical Expenditure Panel Survey Insurance Component. Methodology
Report #31. Rockville, MD: Agency for Healthcare Research and Quality; July
2018. https://meps.ahrq.gov/data_files/publications/mr31/mr31.shtml.
Accessed August 23, 2019.
Kearney A, Sommers J. Switching from retrospective to current-year data collection in
the Medical Expenditure Panel Survey - Insurance Component. ICES-III: Third
International Conference on Establishment Surveys, Conference Proceedings, Montréal, Québec, Canada; June 2007.
Return to Table of Contents
Overview
Employer-sponsored insurance (ESI) is the primary source of health insurance coverage for individuals under age 65. This chartbook uses data for private-sector establishments in the Medical Expenditure Panel Survey-Insurance Component (MEPS-IC) to describe trends in employer coverage, premiums, and benefits from 2005 to 2018.
The MEPS-IC is an annual survey of private employers and State and local governments and is designed to be representative of all 50 States and the District of Columbia. The large sample size (about 42,000 private-sector establishments), combined with a response rate of 67.8 percent in 2018, permits analyses of variations in ESI by firm size and across States that are not readily available from other sources.
Examining trends by firm size and across States is important due to variation in insurance markets along these dimensions. Historically, insurance markets have differed by firm size due to smaller firms' more limited ability to pool risk and their higher administrative costs compared with larger firms. State variation in ESI markets may reflect differences in employment patterns, healthcare prices, and utilization, as well as differences in State approaches to regulating private insurance and administering Medicaid.
This chartbook describes trends and patterns in ESI overall, by firm size, and by State from 2005 to 2018. All differences noted are at the 0.05 significance level unless otherwise specified. All dollar estimates are nominal (not adjusted for inflation).
Summary of Findings
Employee Enrollment in Health Insurance
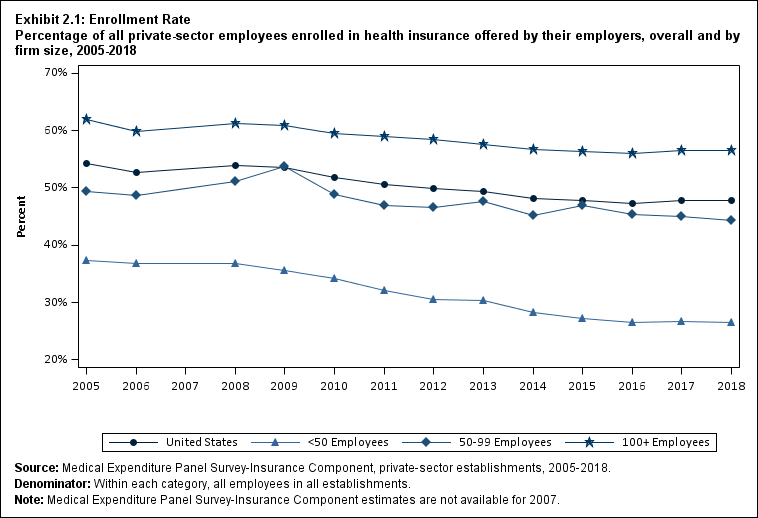
Between 2017 and 2018, there was no significant change in the overall percentage of private-sector employees (47.8 percent in 2018) enrolled in a health insurance plan offered by their employers ("enrollment rate"). There was also no significant change in the enrollment rate in any firm-size category.
The enrollment rate reflects the combination of employers' decisions about offering health insurance and employee eligibility for such coverage, as well as employees' decisions to take up coverage if eligible. Offer rates, eligibility rates, and take-up rates, as well as coverage rates among employees offered insurance, are described further below.
Availability of Coverage: Offer Rates
There was no significant change in the overall percentage of employees working at establishments where insurance was offered ("the offer rate") between 2017 (84.5 percent) and 2018 (84.6 percent) (Exhibit ES.1).
In 2018, almost all employees (99.0 percent) in firms with 100 or more employees worked at establishments that offered health insurance. In comparison, about half (47.3 percent) of employees at firms with fewer than 50 employees worked where health insurance was offered.
Return to Table of Contents
Exhibit ES.1 Percentage (standard error) of private-sector employees in establishments that offer health insurance, by firm size, 2005‑2018
| Number of Employees |
2005 |
2006 |
2008 |
2009 |
2010 |
2011 |
2012 |
2013 |
2014 |
2015 |
2016 |
2017 |
2018 |
| U.S. |
86.9% |
86.9% |
87.7% |
87.6% |
86.5% |
85.3% |
84.7% |
84.9% |
83.2% |
83.8% |
84.3% |
84.5% |
84.6% |
| (Standard Error) |
(0.5%) |
(0.2%) |
(0.3%) |
(0.2%) |
(0.2%) |
(0.2%) |
(0.3%) |
(0.3%) |
(0.3%) |
(0.2%) |
(0.2%) |
(0.2%) |
(0.2%) |
| <50 |
62.2% |
61.2% |
61.6% |
59.6% |
57.8% |
54.7% |
52.9% |
53.1% |
49.8% |
47.6% |
47.7% |
48.3% |
47.3% |
| (Standard Error) |
(0.6%) |
(0.4%) |
(0.5%) |
(0.5%) |
(0.5%) |
(0.4%) |
(0.6%) |
(0.7%) |
(0.6%) |
(0.6%) |
(0.6%) |
(0.6%) |
(0.6%) |
| 50-99 |
86.2% |
87.6% |
90.7% |
89.6% |
87.3% |
85.6% |
84.1% |
87.0% |
83.0% |
85.3% |
88.6% |
86.3% |
88.0% |
| (Standard Error) |
(1.7%) |
(1.2%) |
(0.9%) |
(1.3%) |
(0.9%) |
(1.0%) |
(1.4%) |
(1.0%) |
(1.3%) |
(1.2%) |
(1.0%) |
(1.2%) |
(1.1%) |
| 100+ |
97.5% |
97.7% |
98.2% |
98.8% |
98.5% |
98.1% |
98.2% |
98.0% |
97.3% |
98.8% |
98.9% |
98.9% |
99.0% |
| (Standard Error) |
(0.7%) |
(0.4%) |
(0.3%) |
(0.1%) |
(0.2%) |
(0.2%) |
(0.2%) |
(0.2%) |
(0.2%) |
(0.2%) |
(0.1%) |
(0.2%) |
(0.2%) |
|
Source: Medical Expenditure Panel Survey-Insurance Component, private-sector establishments, 2005‑2018.
Note: Medical Expenditure Panel Survey-Insurance Component estimates are not available for 2007.
|
There was no significant change in the offer rate at small employers (fewer than 50 employees) between 2017 (48.3 percent) and 2018 (47.3 percent) (Exhibit ES.1). There was also no significant year-to-year change in offer rates at medium employers (50 to 99 employees) or at large firms (100 or more employees).
Return to Table of Contents
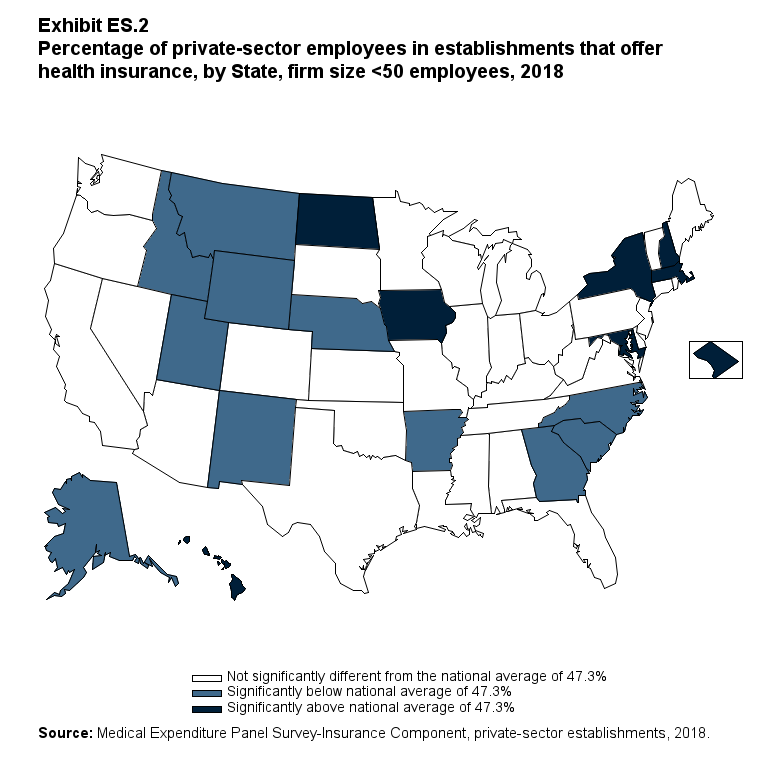
Since almost all large firms offer health insurance coverage, offer rates among small firms are an important factor contributing to overall State ESI offer rates, along with the distribution of employers by firm size in the State. Eight States had small-employer offer rates above the national average (47.3 percent): District of Columbia, Hawaii, Iowa, Maryland, Massachusetts, New Hampshire, New York, and North Dakota (Exhibit ES.2). Eleven States had small-employer offer rates below the national average: Alaska, Arkansas, Georgia, Idaho, Montana, Nebraska, New Mexico, North Carolina, South Carolina, Utah, and Wyoming (Exhibit ES.2).
Exhibit ES.2 Percentage (standard error) of private-sector employees in establishments that offer health insurance, by State, firm size <50 employees, 2018
| Alabama |
53.7% |
Kentucky |
50.7% |
North Dakota |
55.8%* |
| (Standard Error) |
(3.9%) |
(Standard Error) |
(3.9%) |
(Standard Error) |
(3.6%) |
| Alaska |
32.3%* |
Louisiana |
50.2% |
Ohio |
46.1% |
| (Standard Error) |
(3.8%) |
(Standard Error) |
(3.8%) |
(Standard Error) |
(3.5%) |
| Arizona |
50.0% |
Maine |
42.4% |
Oklahoma |
47.1% |
| (Standard Error) |
(3.9%) |
(Standard Error) |
(4.3%) |
(Standard Error) |
(3.9%) |
| Arkansas |
36.9%* |
Maryland |
58.4%* |
Oregon |
47.9% |
| (Standard Error) |
(3.7%) |
(Standard Error) |
(3.9%) |
(Standard Error) |
(3.5%) |
| California |
49.3% |
Massachusetts |
59.1%* |
Pennsylvania |
52.8% |
| (Standard Error) |
(2.0%) |
(Standard Error) |
(3.9%) |
(Standard Error) |
(2.9%) |
| Colorado |
43.4% |
Michigan |
48.9% |
Rhode Island |
53.8% |
| (Standard Error) |
(3.9%) |
(Standard Error) |
(3.8%) |
(Standard Error) |
(4.2%) |
| Connecticut |
53.8% |
Minnesota |
46.4% |
South Carolina |
33.3%* |
| (Standard Error) |
(3.9%) |
(Standard Error) |
(3.8%) |
(Standard Error) |
(3.4%) |
| Delaware |
45.6% |
Mississippi |
45.7% |
South Dakota |
47.2% |
| (Standard Error) |
(4.7%) |
(Standard Error) |
(4.2%) |
(Standard Error) |
(3.4%) |
| District of Columbia |
71.4%* |
Missouri |
47.7% |
Tennessee |
46.0% |
| (Standard Error) |
(4.1%) |
(Standard Error) |
(4.2%) |
(Standard Error) |
(4.1%) |
| Florida |
41.8% |
Montana |
28.9%* |
Texas |
43.1% |
| (Standard Error) |
(3.3%) |
(Standard Error) |
(3.1%) |
(Standard Error) |
(2.8%) |
| Georgia |
38.2%* |
Nebraska |
35.7%* |
Utah |
30.3%* |
| (Standard Error) |
(3.6%) |
(Standard Error) |
(3.7%) |
(Standard Error) |
(3.4%) |
| Hawaii |
87.8%* |
Nevada |
45.3% |
Vermont |
43.6% |
| (Standard Error) |
(2.7%) |
(Standard Error) |
(4.4%) |
(Standard Error) |
(3.5%) |
| Idaho |
35.4%* |
New Hampshire |
54.9%* |
Virginia |
49.4% |
| (Standard Error) |
(3.7%) |
(Standard Error) |
(3.6%) |
(Standard Error) |
(3.6%) |
| Illinois |
46.8% |
New Jersey |
49.1% |
Washington |
50.4% |
| (Standard Error) |
(4.0%) |
(Standard Error) |
(3.1%) |
(Standard Error) |
(3.8%) |
| Indiana |
45.4% |
New Mexico |
39.6%* |
West Virginia |
42.6% |
| (Standard Error) |
(3.6%) |
(Standard Error) |
(3.7%) |
(Standard Error) |
(4.0%) |
| Iowa |
56.3%* |
New York |
56.5%* |
Wisconsin |
41.7% |
| (Standard Error) |
(3.5%) |
(Standard Error) |
(3.0%) |
(Standard Error) |
(3.9%) |
| Kansas |
51.0% |
North Carolina |
32.3%* |
Wyoming |
35.3%* |
| (Standard Error) |
(3.7%) |
(Standard Error) |
(3.3%) |
(Standard Error) |
(3.1%) |
|
Source: Medical Expenditure Panel Survey-Insurance Component, private-sector establishments, 2018.
Note: * Statistically different from the national average of 47.3 percent at p < 0.05.
Note that the standard error on the national estimate of 47.3 percent is 0.62 percent.
|
Return to Table of Contents
Employee Coverage, Eligibility, and Take-Up Rates
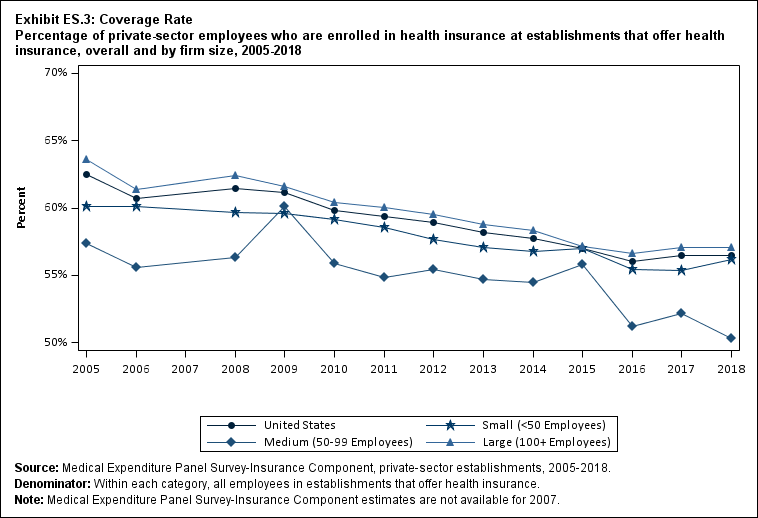
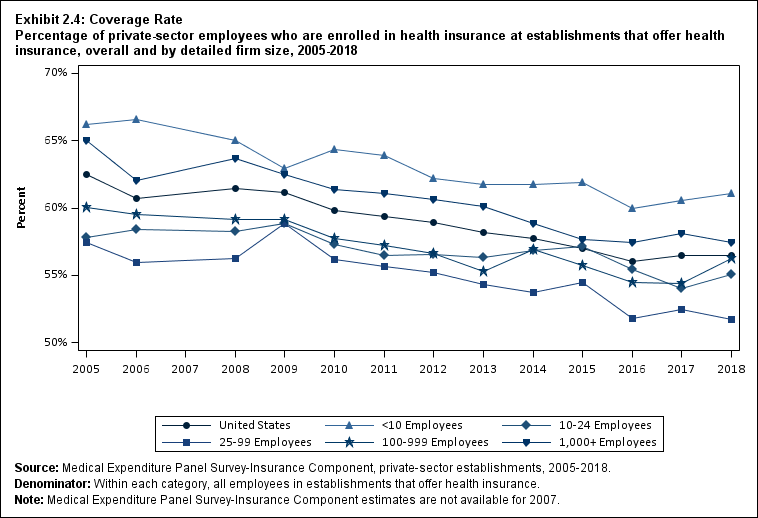
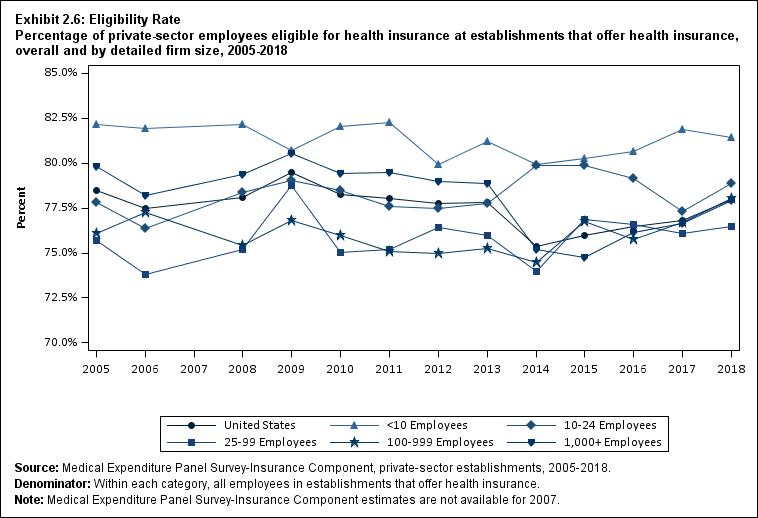
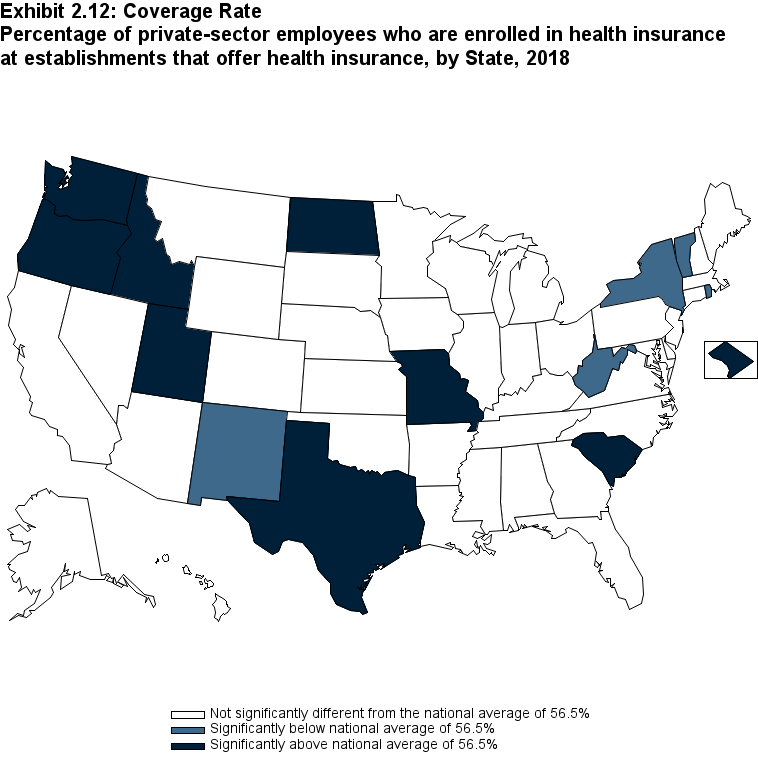
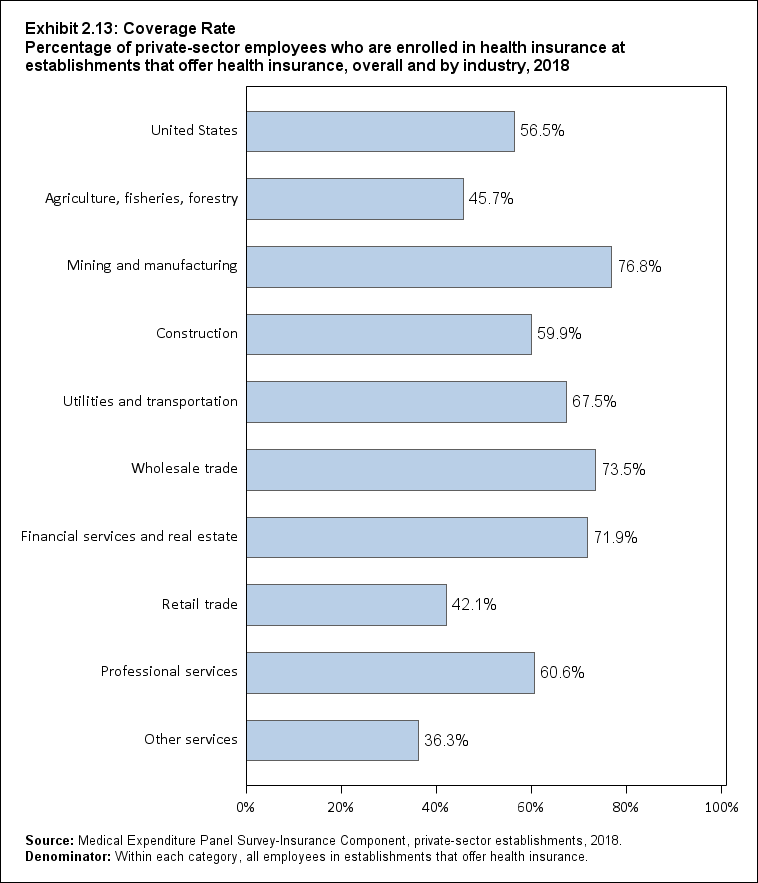
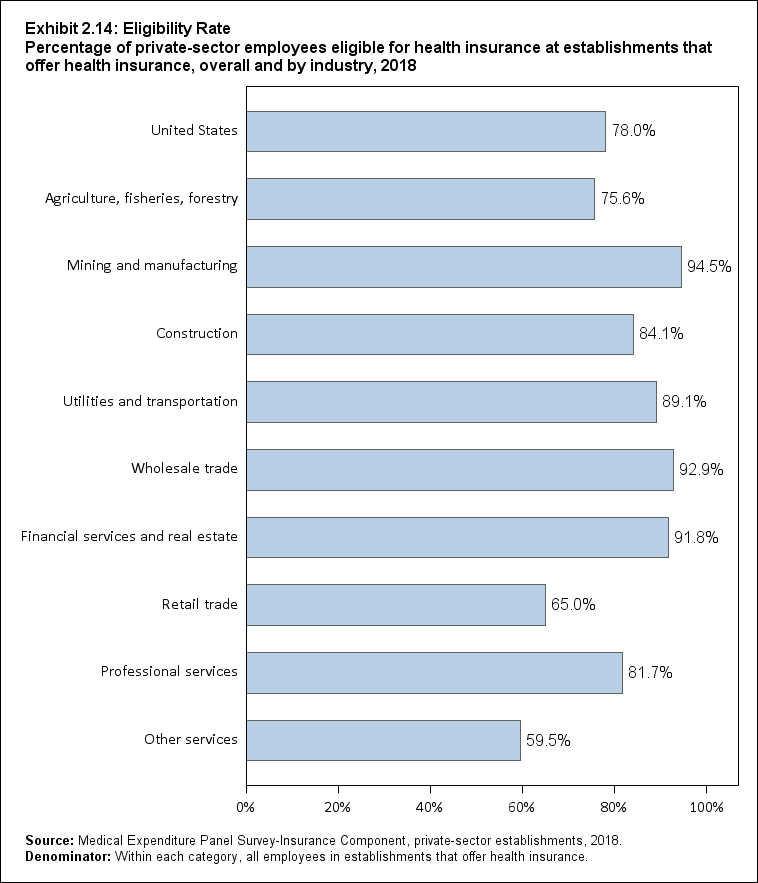
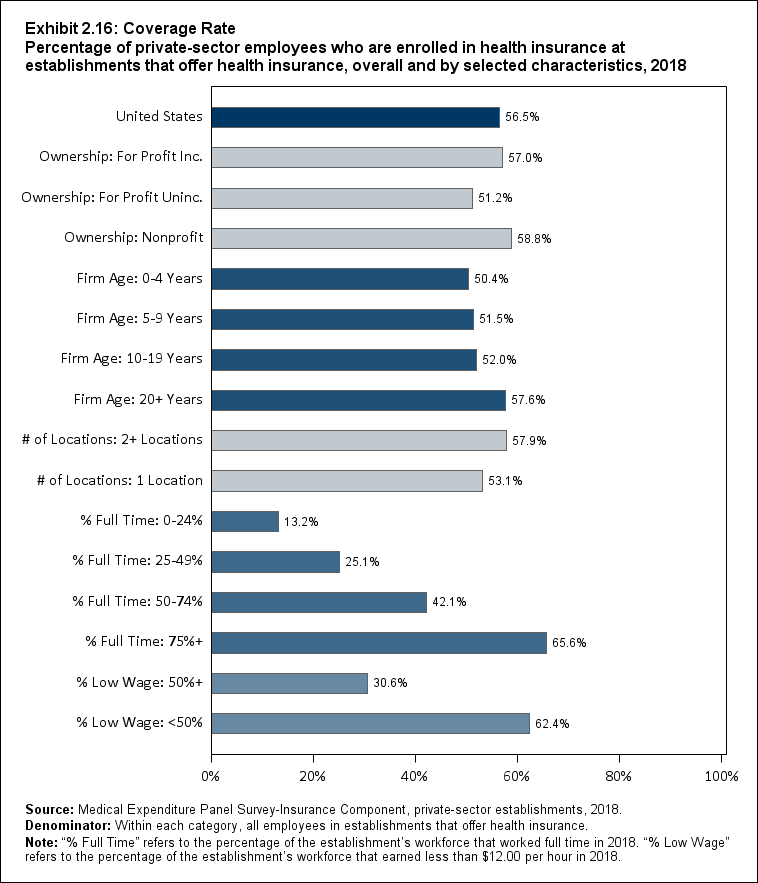
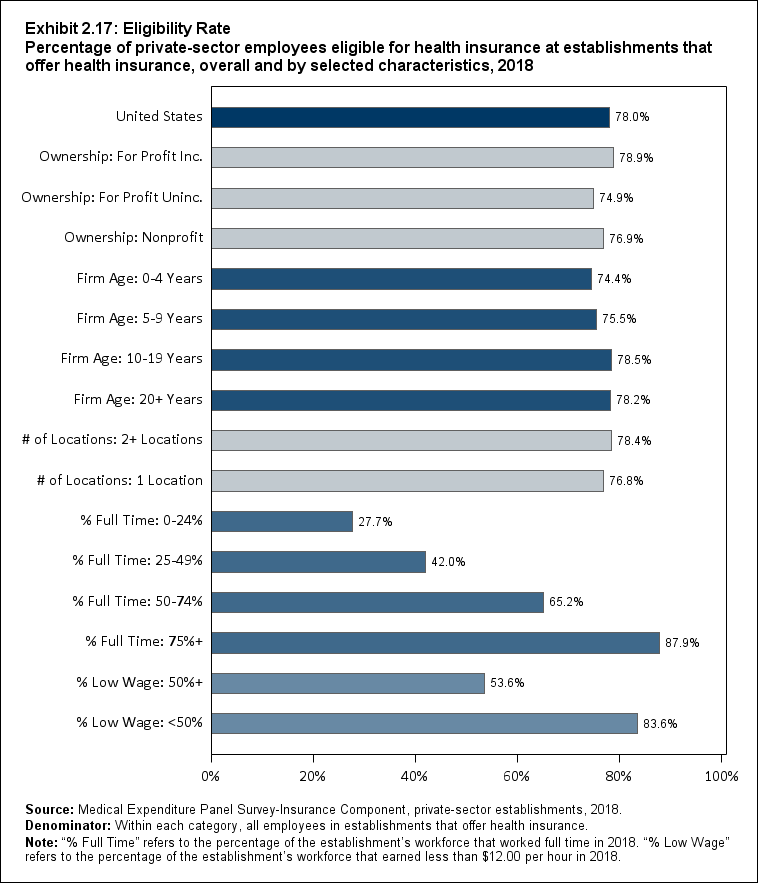
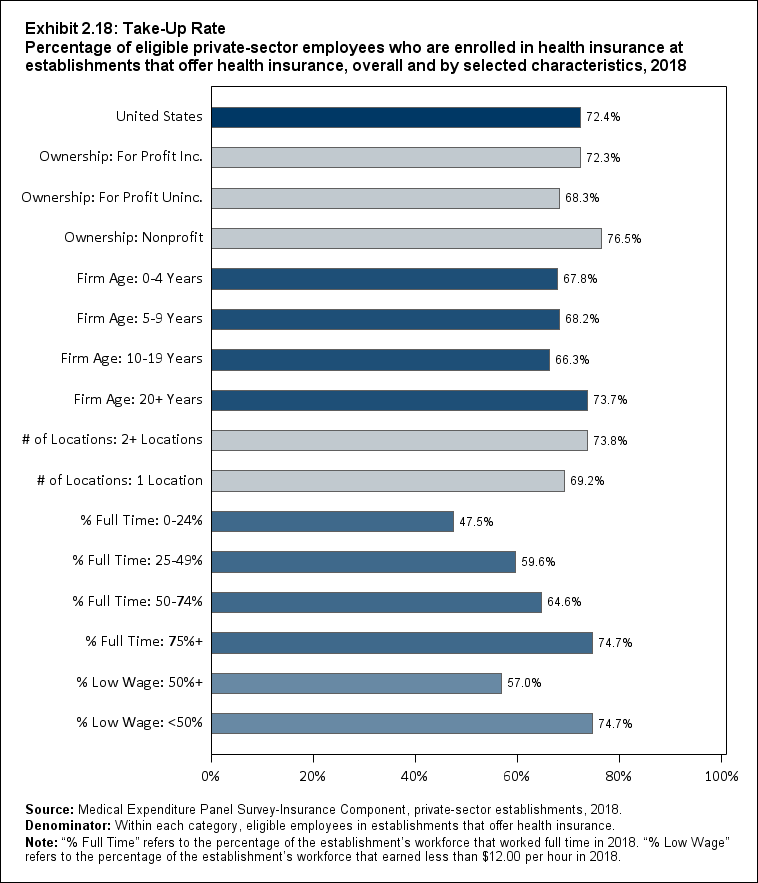
Among establishments that offered insurance, 56.5 percent of employees were enrolled in coverage through their employer (the "coverage rate") and 78.0 percent were eligible for health insurance (the "eligibility rate"). Among eligible employees, 72.4 percent were enrolled in their employer's health insurance (the "take-up rate") (Exhibits ES.3, ES.4, and ES.5).
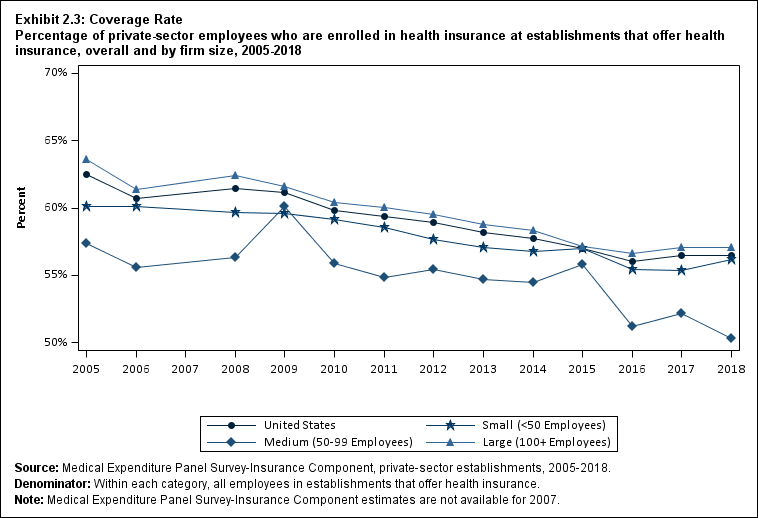
There was no significant change in the coverage rate between 2017 and 2018 overall or in any firm-size category (Exhibit ES.3).
Exhibit ES.3: Coverage Rate Percentage (standard error) of private-sector employees who are enrolled in health insurance at establishments that offer health insurance, overall and by firm size, 2005‑2018
| Number of Employees |
2005 |
2006 |
2008 |
2009 |
2010 |
2011 |
2012 |
2013 |
2014 |
2015 |
2016 |
2017 |
2018 |
| U.S. |
62.5% |
60.7% |
61.4% |
61.1% |
59.8% |
59.4% |
58.9% |
58.2% |
57.8% |
57.0% |
56.0% |
56.5% |
56.5% |
| (Standard Error) |
(0.4%) |
(0.3%) |
(0.4%) |
(0.4%) |
(0.5%) |
(0.2%) |
(0.4%) |
(0.3%) |
(0.4%) |
(0.4%) |
(0.4%) |
(0.4%) |
(0.4%) |
| <50 |
60.1% |
60.1% |
59.7% |
59.6% |
59.2% |
58.6% |
57.7% |
57.1% |
56.8% |
57.0% |
55.5% |
55.4% |
56.2% |
| (Standard Error) |
(0.5%) |
(0.6%) |
(0.2%) |
(0.4%) |
(0.6%) |
(0.5%) |
(0.5%) |
(0.5%) |
(0.6%) |
(0.6%) |
(0.6%) |
(0.6%) |
(0.6%) |
| 50-99 |
57.4% |
55.6% |
56.3% |
60.1% |
55.9% |
54.9% |
55.4% |
54.7% |
54.5% |
55.8% |
51.2% |
52.2% |
50.3% |
| (Standard Error) |
(1.5%) |
(1.6%) |
(1.0%) |
(1.0%) |
(0.8%) |
(1.0%) |
(1.2%) |
(0.8%) |
(1.3%) |
(1.2%) |
(1.2%) |
(1.2%) |
(1.2%) |
| 100+ |
63.6% |
61.4% |
62.4% |
61.6% |
60.4% |
60.0% |
59.5% |
58.8% |
58.3% |
57.1% |
56.6% |
57.1% |
57.1% |
| (Standard Error) |
(0.6%) |
(0.5%) |
(0.5%) |
(0.6%) |
(0.6%) |
(0.3%) |
(0.4%) |
(0.3%) |
(0.5%) |
(0.5%) |
(0.5%) |
(0.5%) |
(0.5%) |
|
Source: Medical Expenditure Panel Survey-Insurance Component, private-sector establishments, 2005‑2018.
Denominator: Within each category, all employees in establishments that offer health insurance.
Note: Medical Expenditure Panel Survey-Insurance Component estimates are not available for 2007.
|
Return to Table of Contents
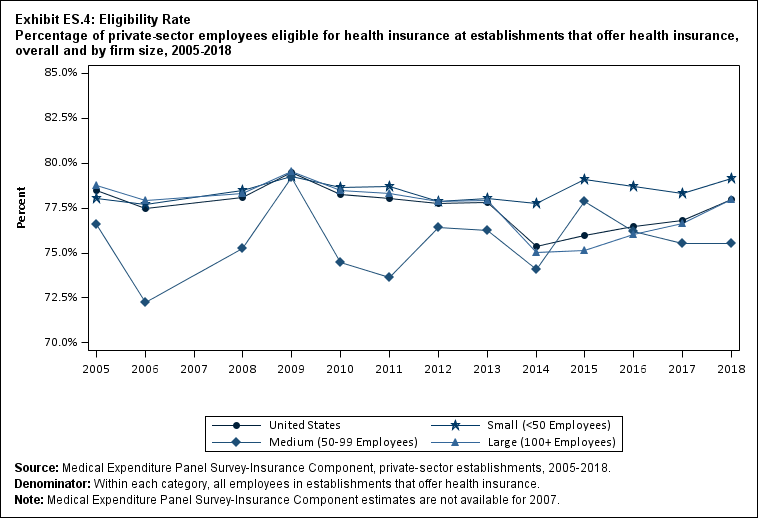
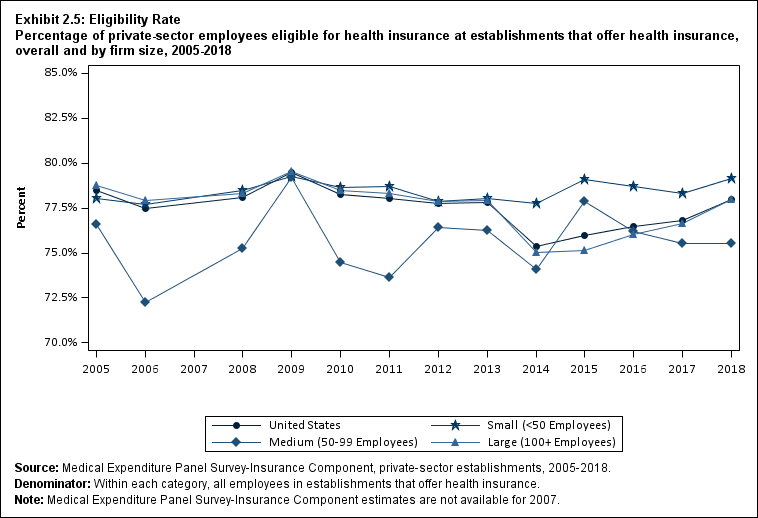
Among employees in establishments that offered health insurance, the eligibility rate increased from 76.8 percent in 2017 to 78.0 percent in 2018 (Exhibit ES.4). The rate in 2018 was higher than eligibility rates observed from 2014 to 2017.
Exhibit ES.4: Eligibility Rate Percentage (standard error) of private-sector employees eligible for health insurance at establishments that offer health insurance, overall and by firm size, 2005‑2018
| Number of Employees |
2005 |
2006 |
2008 |
2009 |
2010 |
2011 |
2012 |
2013 |
2014 |
2015 |
2016 |
2017 |
2018 |
| U.S. |
78.5% |
77.5% |
78.1% |
79.5% |
78.2% |
78.0% |
77.8% |
77.8% |
75.4% |
76.0% |
76.5% |
76.8% |
78.0% |
| (Standard Error) |
(0.5%) |
(0.4%) |
(0.4%) |
(0.3%) |
(0.5%) |
(0.4%) |
(0.3%) |
(0.2%) |
(0.4%) |
(0.4%) |
(0.4%) |
(0.4%) |
(0.4%) |
| <50 |
78.0% |
77.7% |
78.5% |
79.3% |
78.6% |
78.7% |
77.9% |
78.0% |
77.7% |
79.1% |
78.7% |
78.3% |
79.1% |
| (Standard Error) |
(0.7%) |
(0.6%) |
(0.4%) |
(0.5%) |
(0.5%) |
(0.6%) |
(0.5%) |
(0.4%) |
(0.6%) |
(0.6%) |
(0.6%) |
(0.6%) |
(0.6%) |
| 50-99 |
76.6% |
72.3% |
75.3% |
79.2% |
74.5% |
73.6% |
76.4% |
76.2% |
74.1% |
77.8% |
76.2% |
75.5% |
75.6% |
| (Standard Error) |
(1.4%) |
(1.5%) |
(1.3%) |
(0.8%) |
(0.6%) |
(1.0%) |
(1.2%) |
(0.8%) |
(1.4%) |
(1.2%) |
(1.2%) |
(1.2%) |
(1.2%) |
| 100+ |
78.8% |
77.9% |
78.3% |
79.6% |
78.5% |
78.3% |
77.9% |
77.9% |
75.0% |
75.2% |
76.0% |
76.6% |
78.0% |
| (Standard Error) |
(0.6%) |
(0.6%) |
(0.4%) |
(0.5%) |
(0.6%) |
(0.4%) |
(0.3%) |
(0.3%) |
(0.5%) |
(0.5%) |
(0.4%) |
(0.5%) |
(0.5%) |
|
Source: Medical Expenditure Panel Survey-Insurance Component, private-sector establishments, 2005‑2018.
Denominator: Within each category, all employees in establishments that offer health insurance.
Note: Medical Expenditure Panel Survey-Insurance Component estimates are not available for 2007.
|
Return to Table of Contents
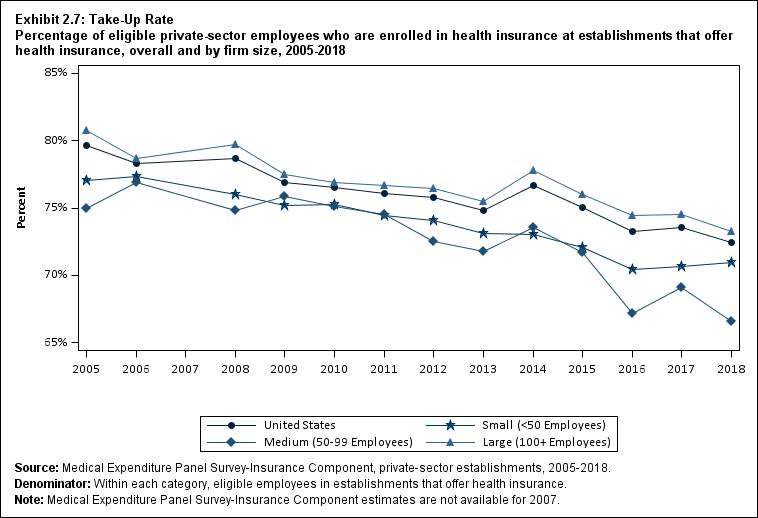
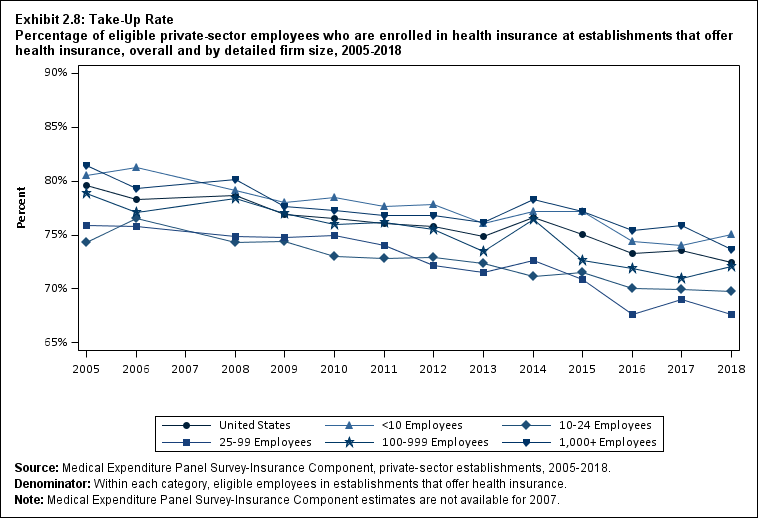
The take-up rate declined from 73.5 percent to 72.4 percent between 2017 and 2018 (Exhibit ES.5). The rate in 2018 was significantly lower than take-up rates in almost all years in the 2005 to 2017 period.
Exhibit ES.5: Take-Up Rate Percentage (standard error) of eligible private-sector employees who are enrolled in health insurance at establishments that offer health insurance, overall and by firm size, 2005‑2018
| Number of Employees |
2005 |
2006 |
2008 |
2009 |
2010 |
2011 |
2012 |
2013 |
2014 |
2015 |
2016 |
2017 |
2018 |
| U.S. |
79.6% |
78.3% |
78.7% |
76.9% |
76.5% |
76.1% |
75.8% |
74.8% |
76.7% |
75.0% |
73.3% |
73.5% |
72.4% |
| (Standard Error) |
(0.3%) |
(0.3%) |
(0.3%) |
(0.3%) |
(0.2%) |
(0.3%) |
(0.3%) |
(0.2%) |
(0.3%) |
(0.3%) |
(0.3%) |
(0.3%) |
(0.4%) |
| <50 |
77.0% |
77.4% |
76.0% |
75.2% |
75.3% |
74.4% |
74.1% |
73.1% |
73.0% |
72.1% |
70.4% |
70.7% |
71.0% |
| (Standard Error) |
(0.6%) |
(0.7%) |
(0.3%) |
(0.3%) |
(0.6%) |
(0.4%) |
(0.4%) |
(0.6%) |
(0.5%) |
(0.5%) |
(0.5%) |
(0.6%) |
(0.6%) |
| 50-99 |
74.9% |
76.9% |
74.9% |
75.9% |
75.1% |
74.5% |
72.5% |
71.8% |
73.5% |
71.7% |
67.2% |
69.1% |
66.6% |
| (Standard Error) |
(1.2%) |
(1.3%) |
(0.5%) |
(0.9%) |
(0.7%) |
(0.6%) |
(0.8%) |
(1.0%) |
(1.0%) |
(1.1%) |
(1.2%) |
(1.1%) |
(1.1%) |
| 100+ |
80.7% |
78.7% |
79.7% |
77.5% |
76.9% |
76.7% |
76.4% |
75.5% |
77.8% |
76.0% |
74.4% |
74.5% |
73.3% |
| (Standard Error) |
(0.5%) |
(0.4%) |
(0.4%) |
(0.5%) |
(0.3%) |
(0.3%) |
(0.4%) |
(0.3%) |
(0.3%) |
(0.3%) |
(0.4%) |
(0.4%) |
(0.4%) |
|
Source: Medical Expenditure Panel Survey-Insurance Component, private-sector establishments, 2005‑2018.
Denominator: Within each category, eligible employees in establishments that offer health insurance.
Note: Medical Expenditure Panel Survey-Insurance Component estimates are not available for 2007.
|
Return to Table of Contents
Choice of Plans
The percentage of employees with a choice of plans increased between 2017 and 2018, from 72.4 percent in 2017 to 75.7 percent in 2018. The availability of plan choice was significantly higher in 2018 than in 2005 for small employers (37.8 percent vs. 18.2 percent),
medium employers (56.4 percent vs. 32.1 percent), and large employers (84.7 percent vs. 69.0 percent) (Exhibit ES.6).
Exhibit ES.6 Percentage (standard error) of private-sector employees working in establishments that offer two or more health insurance plans, overall and by firm size, 2005‑2018
| Number of Employees |
2005 |
2006 |
2008 |
2009 |
2010 |
2011 |
2012 |
2013 |
2014 |
2015 |
2016 |
2017 |
2018 |
| U.S. |
56.3% |
61.4% |
64.8% |
66.5% |
65.6% |
65.5% |
65.3% |
66.0% |
67.0% |
70.2% |
71.7% |
72.4% |
75.7% |
| (Standard Error) |
(0.8%) |
(0.7%) |
(0.6%) |
(0.7%) |
(0.8%) |
(0.5%) |
(0.7%) |
(0.6%) |
(0.6%) |
(0.5%) |
(0.5%) |
(0.5%) |
(0.5%) |
| <50 |
18.2% |
21.5% |
26.8% |
27.3% |
26.7% |
27.2% |
29.3% |
28.4% |
29.6% |
33.6% |
34.2% |
34.9% |
37.8% |
| (Standard Error) |
(1.1%) |
(1.1%) |
(0.7%) |
(0.9%) |
(0.8%) |
(0.9%) |
(0.8%) |
(1.0%) |
(0.9%) |
(1.1%) |
(1.0%) |
(1.0%) |
(1.0%) |
| 50-99 |
32.1% |
36.0% |
42.5% |
42.8% |
44.1% |
46.8% |
43.7% |
46.6% |
46.8% |
50.2% |
56.2% |
59.3% |
56.4% |
| (Standard Error) |
(2.5%) |
(2.4%) |
(1.7%) |
(2.0%) |
(1.9%) |
(2.2%) |
(1.7%) |
(2.2%) |
(2.1%) |
(2.2%) |
(2.0%) |
(1.9%) |
(1.9%) |
| 100+ |
69.0% |
74.3% |
76.9% |
78.5% |
77.3% |
76.3% |
75.7% |
76.5% |
77.0% |
79.7% |
80.7% |
81.0% |
84.7% |
| (Standard Error) |
(0.9%) |
(0.6%) |
(0.7%) |
(0.7%) |
(1.0%) |
(0.7%) |
(0.7%) |
(0.7%) |
(0.6%) |
(0.6%) |
(0.6%) |
(0.6%) |
(0.5%) |
|
Source: Medical Expenditure Panel Survey-Insurance Component, private-sector establishments, 2005‑2018.
Denominator: Within each category, all employees in establishments that offer health insurance.
Note: Medical Expenditure Panel Survey-Insurance Component estimates are not available for 2007.
|
Return to Table of Contents
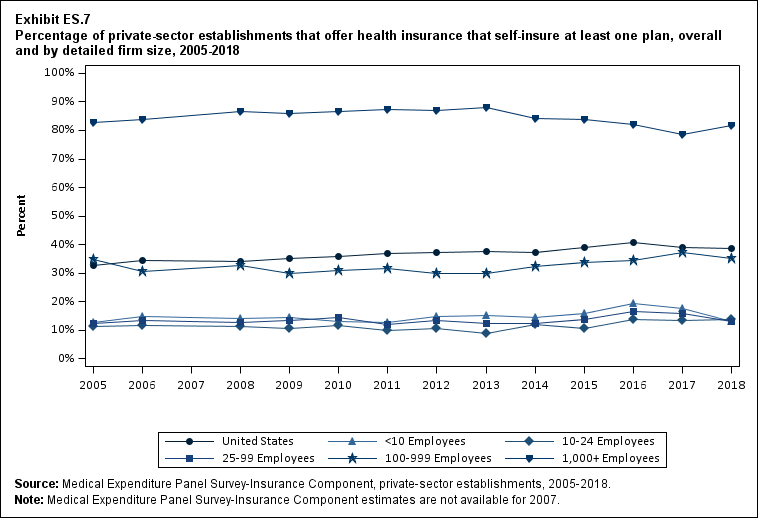
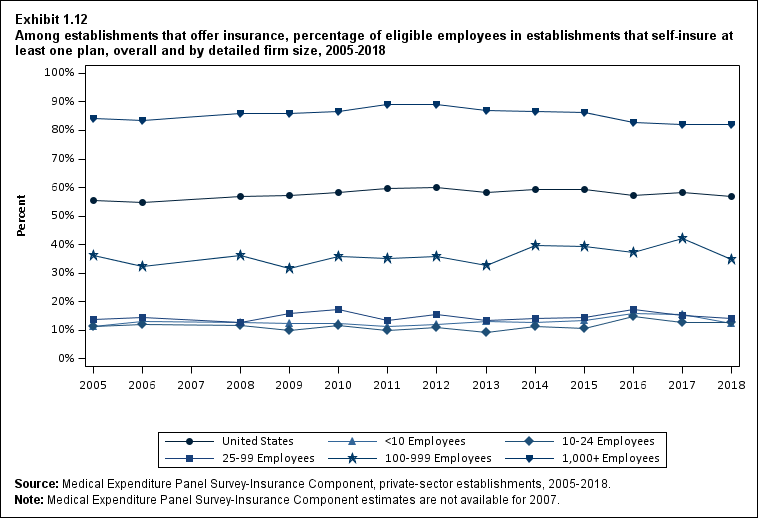
Self-Insured Plans
Between 2017 and 2018, there was no significant change in the percentage of offering establishments that self-insured at least one plan overall. However, this percentage declined at establishments in firms with fewer than 10 employees (from 17.7 percent to 13.1 percent) and with 25 to 99 employees (from 16.0 percent to 12.9 percent) and increased at
establishments in firms with 1,000 or more employees (from 78.6 percent to 81.6 percent) (Exhibit ES.7).
Exhibit ES.7 Percentage (standard error) of private-sector establishments that offer health insurance that self-insure at least one plan, overall and by detailed firm size, 2005‑2018
| Number of Employees |
2005 |
2006 |
2008 |
2009 |
2010 |
2011 |
2012 |
2013 |
2014 |
2015 |
2016 |
2017 |
2018 |
| U.S. |
32.7% |
34.4% |
34.2% |
35.1% |
35.8% |
36.9% |
37.2% |
37.6% |
37.2% |
39.0% |
40.7% |
39.2% |
38.7% |
| (Standard Error) |
(0.5%) |
(0.5%) |
(0.4%) |
(0.4%) |
(0.5%) |
(0.5%) |
(0.5%) |
(0.5%) |
(0.5%) |
(0.5%) |
(0.6%) |
(0.6%) |
(0.6%) |
| <10 |
12.7% |
14.9% |
14.0% |
14.6% |
13.1% |
12.6% |
14.9% |
15.2% |
14.4% |
15.8% |
19.3% |
17.7% |
13.1% |
| (Standard Error) |
(0.8%) |
(0.9%) |
(0.8%) |
(0.7%) |
(0.5%) |
(0.8%) |
(0.9%) |
(0.4%) |
(0.8%) |
(1.0%) |
(1.4%) |
(1.4%) |
(1.1%) |
| 10-24 |
11.2% |
11.6% |
11.1% |
10.4% |
11.6% |
9.9% |
10.7% |
9.0% |
12.0% |
10.6% |
13.6% |
13.3% |
13.8% |
| (Standard Error) |
(0.5%) |
(0.6%) |
(0.9%) |
(0.4%) |
(0.8%) |
(0.7%) |
(0.7%) |
(0.7%) |
(1.0%) |
(1.0%) |
(1.1%) |
(1.2%) |
(1.2%) |
| 25-99 |
12.2% |
13.5% |
12.6% |
13.4% |
14.3% |
12.2% |
13.5% |
12.4% |
12.2% |
13.7% |
16.6% |
16.0% |
12.9% |
| (Standard Error) |
(0.9%) |
(0.7%) |
(0.8%) |
(0.7%) |
(0.7%) |
(0.7%) |
(0.7%) |
(0.7%) |
(0.8%) |
(0.9%) |
(0.9%) |
(0.9%) |
(0.8%) |
| 100-999 |
34.9% |
30.6% |
32.7% |
29.9% |
30.9% |
31.7% |
30.1% |
30.1% |
32.5% |
33.7% |
34.4% |
37.2% |
35.1% |
| (Standard Error) |
(1.4%) |
(0.9%) |
(1.3%) |
(0.7%) |
(0.9%) |
(1.1%) |
(0.8%) |
(1.0%) |
(1.2%) |
(1.2%) |
(1.2%) |
(1.3%) |
(1.2%) |
| 1,000+ |
82.7% |
83.8% |
86.5% |
85.8% |
86.6% |
87.5% |
87.1% |
88.0% |
84.2% |
83.8% |
81.9% |
78.6% |
81.6% |
| (Standard Error) |
(0.5%) |
(0.7%) |
(0.5%) |
(0.4%) |
(0.6%) |
(0.5%) |
(0.7%) |
(0.5%) |
(0.8%) |
(0.8%) |
(0.8%) |
(0.8%) |
(0.8%) |
|
Source: Medical Expenditure Panel Survey-Insurance Component, private-sector establishments, 2005‑2018.
Note: Medical Expenditure Panel Survey-Insurance Component estimates are not available for 2007.
|
Return to Table of Contents
Premiums
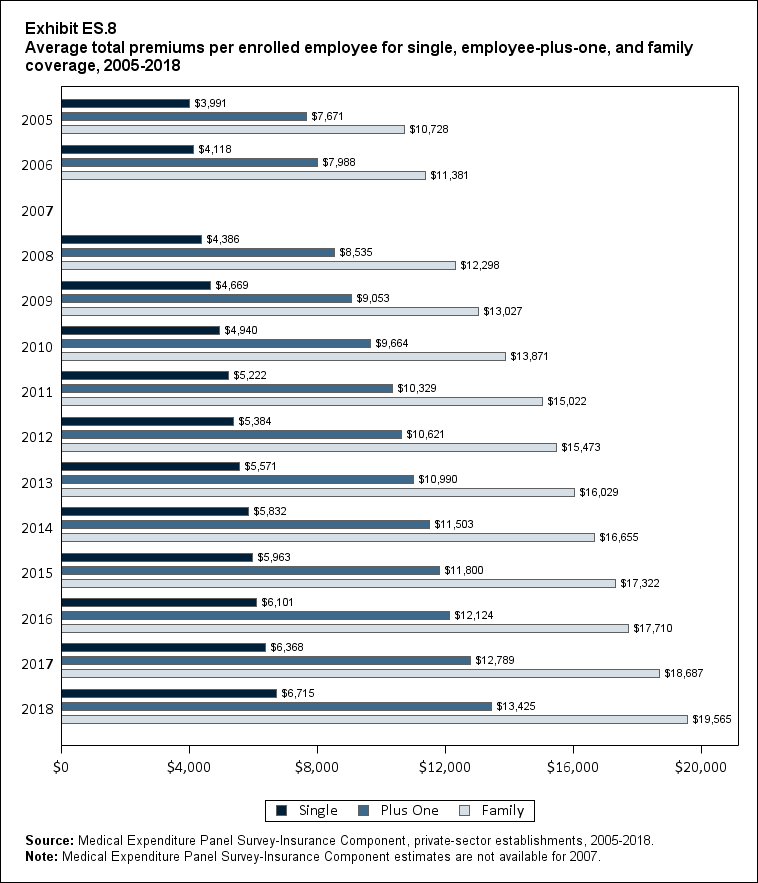
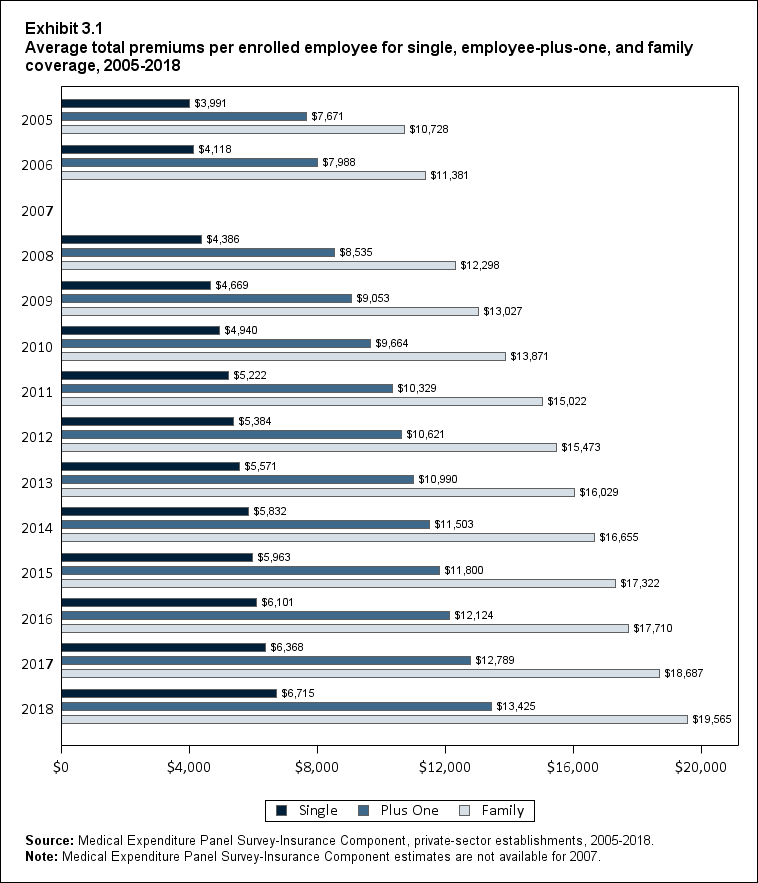
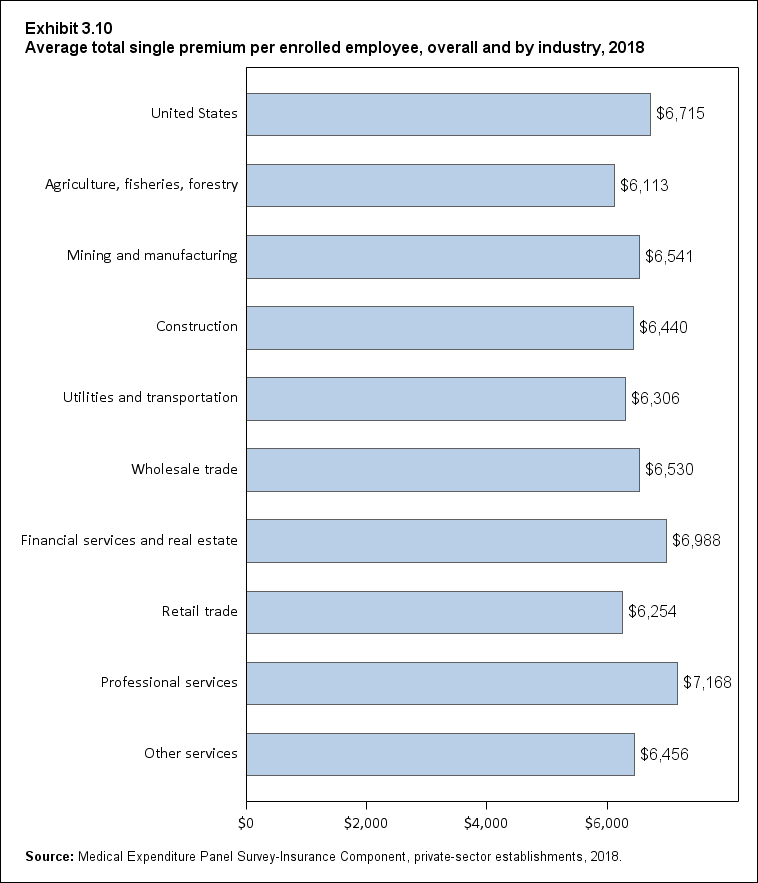
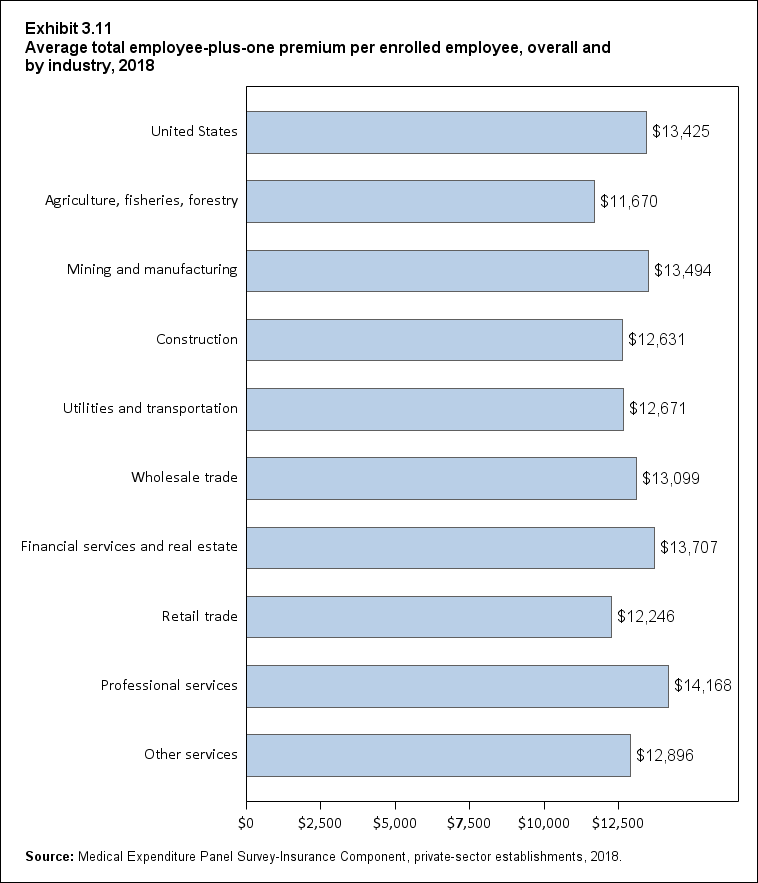
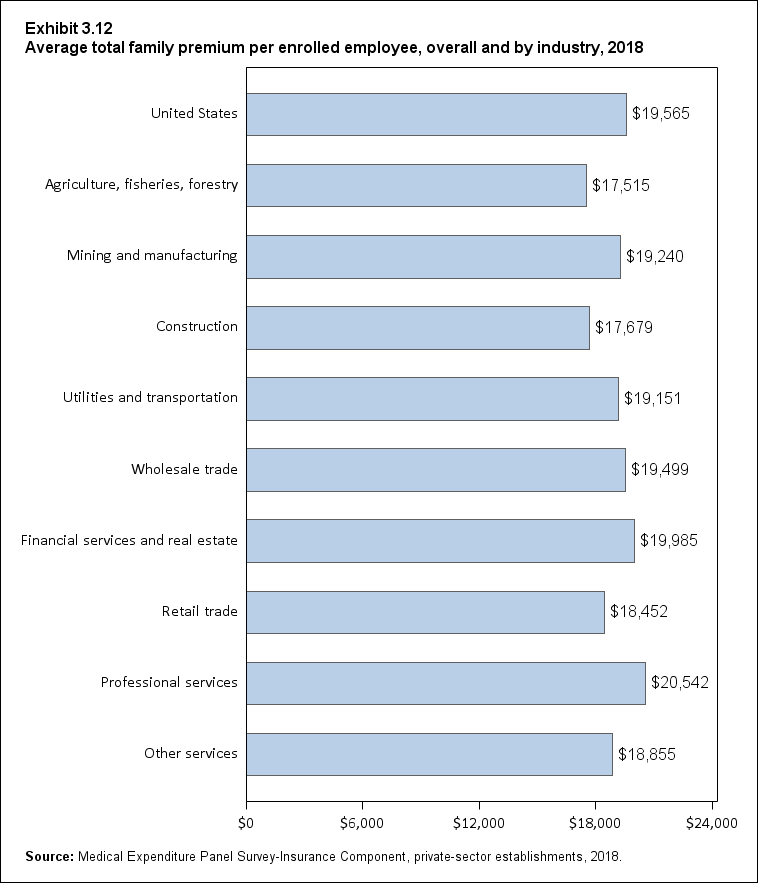
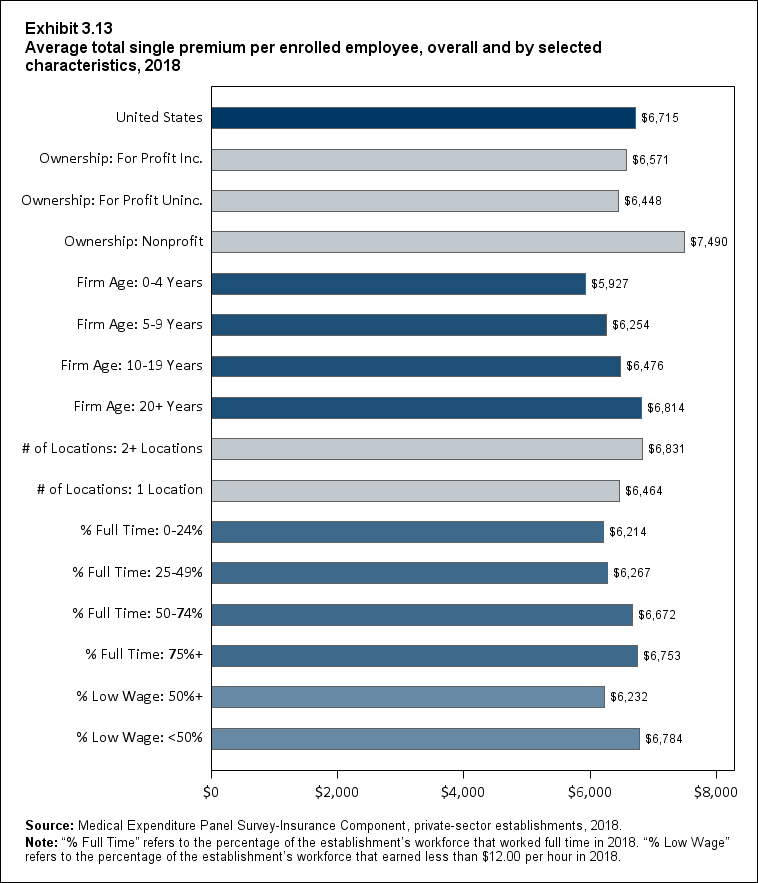
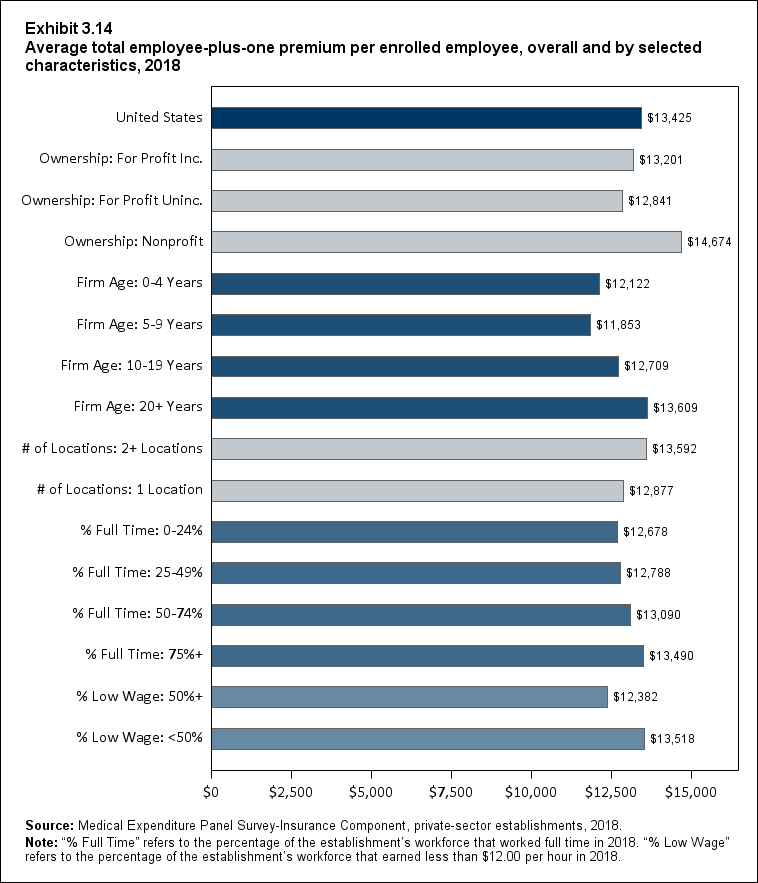
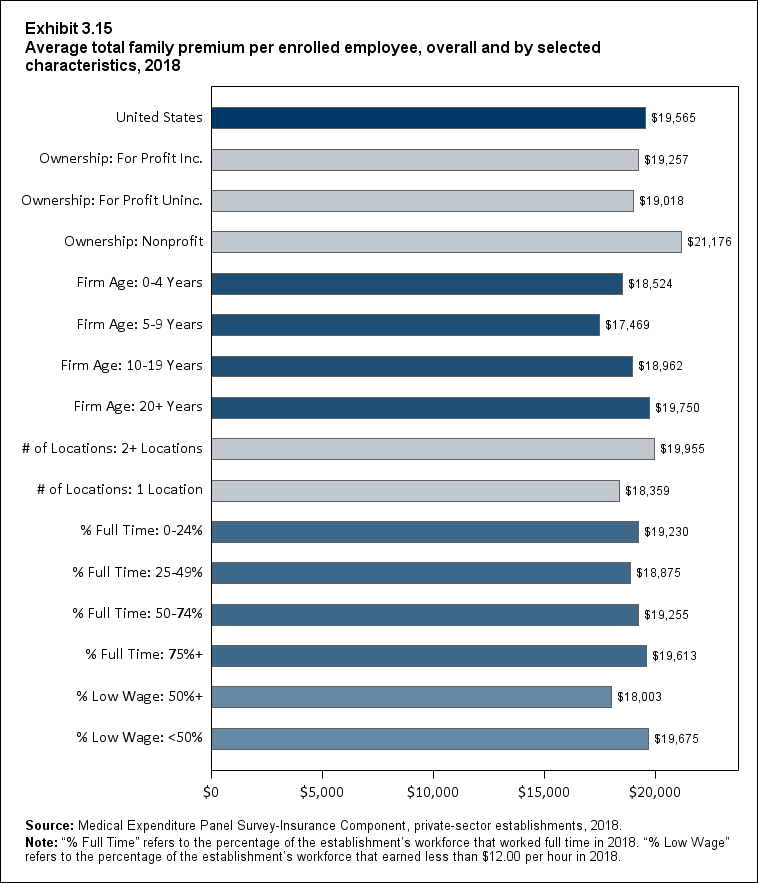
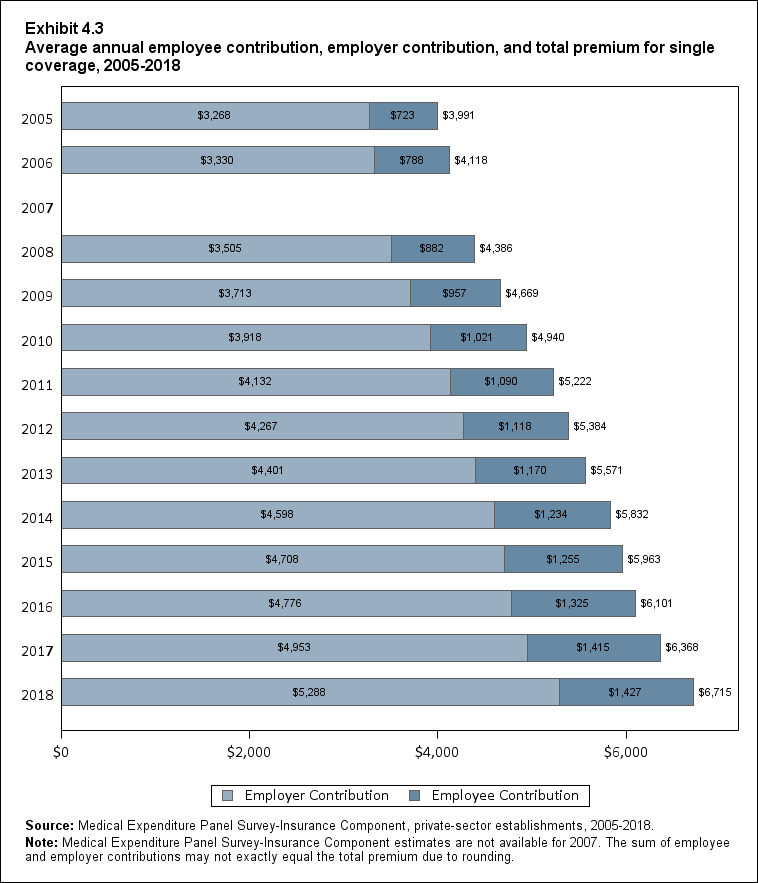
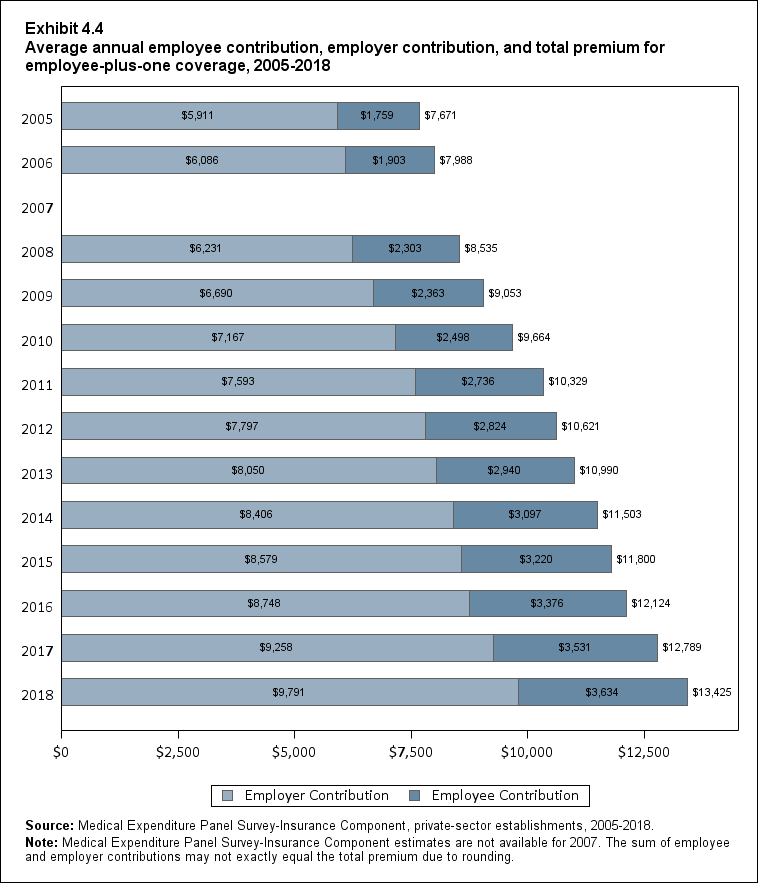
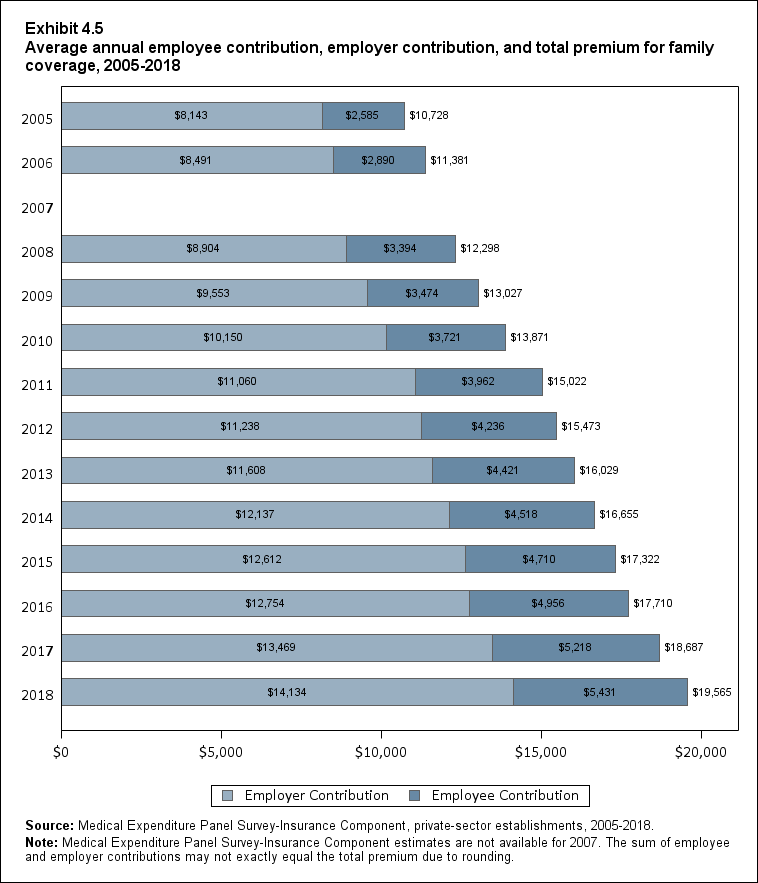
In 2018, average annual health insurance premiums per enrolled employee with private-sector employer coverage were $6,715 for single coverage, $13,425 for employee-plus-one coverage, and $19,565 for family coverage. These amounts represent increases of 5.4 percent for single coverage, 5.0 percent for employee-plus-one coverage, and 4.7 percent for family coverage over 2017 levels (Exhibit ES.8). Between 2005 and 2018, premiums for the three types of coverage grew by
between 68.3 percent and 82.4 percent, with average annual growth rates between 4.1 percent and 4.7 percent (data not shown).
Exhibit ES.8 Average total premiums (standard error) per enrolled employee for single, employee-plus-one and family coverage, 2005‑2018
| Coverage |
2005 |
2006 |
2008 |
2009 |
2010 |
2011 |
2012 |
2013 |
2014 |
2015 |
2016 |
2017 |
2018 |
| Single |
$3,991 |
$4,118 |
$4,386 |
$4,669 |
$4,940 |
$5,222 |
$5,384 |
$5,571 |
$5,832 |
$5,963 |
$6,101 |
$6,368 |
$6,715 |
| (Standard Error) |
($24) |
($25) |
($15) |
($21) |
($22) |
($26) |
($28) |
($23) |
($25) |
($26) |
($27) |
($28) |
($31) |
| Plus One |
$7,671 |
$7,988 |
$8,535 |
$9,053 |
$9,664 |
$10,329 |
$10,621 |
$10,990 |
$11,503 |
$11,800 |
$12,124 |
$12,789 |
$13,425 |
| (Standard Error) |
($44) |
($48) |
($43) |
($34) |
($60) |
($105) |
($56) |
($54) |
($60) |
($58) |
($60) |
($70) |
($70) |
| Family |
$10,728 |
$11,381 |
$12,298 |
$13,027 |
$13,871 |
$15,022 |
$15,473 |
$16,029 |
$16,655 |
$17,322 |
$17,710 |
$18,687 |
$19,565 |
| (Standard Error) |
($41) |
($32) |
($81) |
($25) |
($75) |
($98) |
($95) |
($61) |
($79) |
($95) |
($84) |
($105) |
($104) |
|
Source: Medical Expenditure Panel Survey-Insurance Component, private-sector establishments, 2005‑2018.
Note: Medical Expenditure Panel Survey-Insurance Component estimates are not available for 2007.
|
Return to Table of Contents
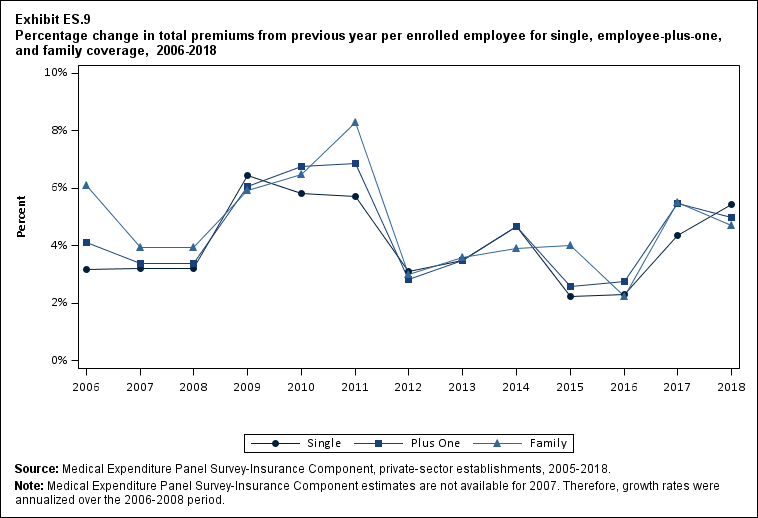
There were no significant differences between the 2017 to 2018 and the 2016 to 2017 premium growth rates for single coverage (5.4 percent vs. 4.4 percent), employee-plus-one coverage (5.0 percent vs. 5.5 percent), or family coverage (4.7 percent vs. 5.5 percent). In the 13 years from 2005 to 2018, annual premium growth rates ranged from 2.2 percent to 8.3 percent for family coverage, from 2.6 percent to 6.9 percent for employee-plus-one coverage, and from 2.2 percent to 6.5 percent for single coverage (Exhibit ES.9).
Exhibit ES.9 Percentage change (standard error) in total premiums from previous year per enrolled employee for single, employee-plus-one, and family coverage, 2006‑2018
| Year |
Single |
Employee-Plus-One |
Family |
| 2006 |
3.2% |
4.1% |
6.1% |
| (Standard Error) |
(0.9%) |
(0.9%) |
(0.5%) |
| 2007 |
3.2% |
3.4% |
4.0% |
| (Standard Error) |
(0.8%) |
(0.8%) |
(0.8%) |
| 2008 |
3.2% |
3.4% |
4.0% |
| (Standard Error) |
(0.8%) |
(0.8%) |
(0.8%) |
| 2009 |
6.5% |
6.1% |
5.9% |
| (Standard Error) |
(0.6%) |
(0.7%) |
(0.7%) |
| 2010 |
5.8% |
6.7% |
6.5% |
| (Standard Error) |
(0.7%) |
(0.8%) |
(0.6%) |
| 2011 |
5.7% |
6.9% |
8.3% |
| (Standard Error) |
(0.7%) |
(1.3%) |
(0.9%) |
| 2012 |
3.1% |
2.8% |
3.0% |
| (Standard Error) |
(0.7%) |
(1.2%) |
(0.9%) |
| 2013 |
3.5% |
3.5% |
3.6% |
| (Standard Error) |
(0.7%) |
(0.7%) |
(0.7%) |
| 2014 |
4.7% |
4.7% |
3.9% |
| (Standard Error) |
(0.6%) |
(0.7%) |
(0.6%) |
| 2015 |
2.2% |
2.6% |
4.0% |
| (Standard Error) |
(0.6%) |
(0.7%) |
(0.8%) |
| 2016 |
2.3% |
2.7% |
2.2% |
| (Standard Error) |
(0.6%) |
(0.7%) |
(0.7%) |
| 2017 |
4.4% |
5.5% |
5.5% |
| (Standard Error) |
(0.7%) |
(0.8%) |
(0.8%) |
| 2018 |
5.4% |
5.0% |
4.7% |
| (Standard Error) |
(0.7%) |
(0.8%) |
(0.8%) |
|
Source: Medical Expenditure Panel Survey-Insurance Component, private-sector establishments, 2005‑2018.
Note: Medical Expenditure Panel Survey-Insurance Component estimates are not available for 2007.
Therefore, growth rates were annualized over the 2006‑2008 period.
|
Return to Table of Contents
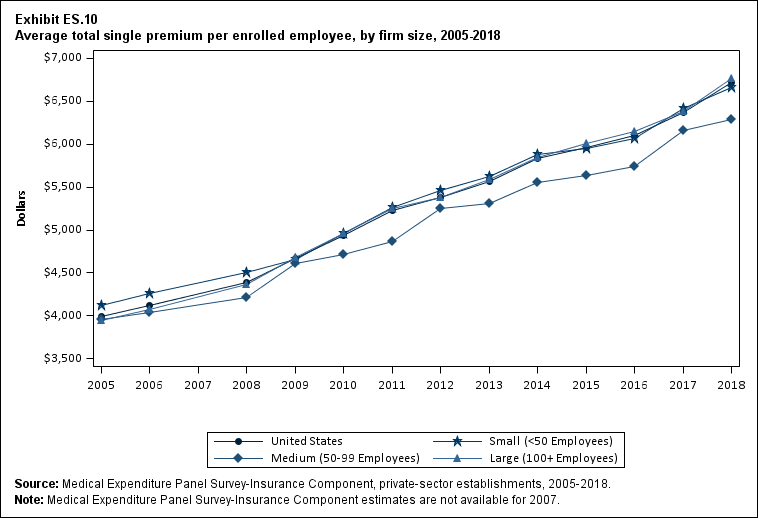
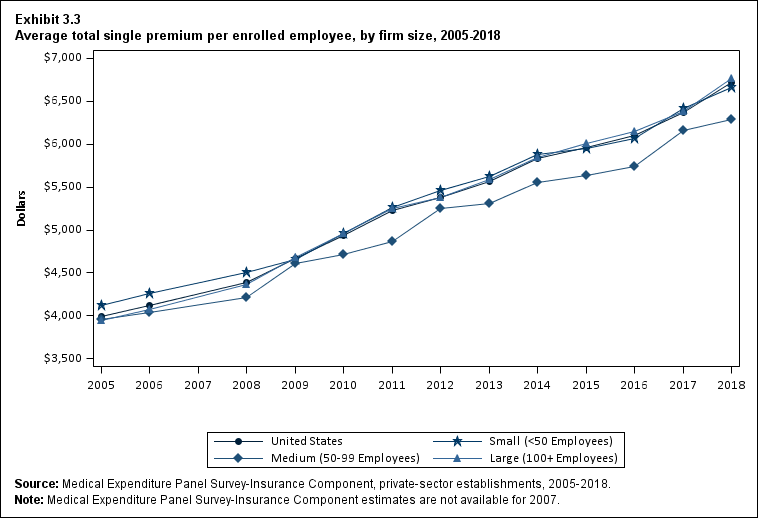
In 2018, average single premiums were lower in medium firms ($6,287) than in small ($6,667) or large firms ($6,770) (Exhibit ES.10).
Exhibit ES.10 Average total single premium (standard error) per enrolled employee, by firm size, 2005‑2018
| Number of Employees |
2005 |
2006 |
2008 |
2009 |
2010 |
2011 |
2012 |
2013 |
2014 |
2015 |
2016 |
2017 |
2018 |
| U.S. |
$3,991 |
$4,118 |
$4,386 |
$4,669 |
$4,940 |
$5,222 |
$5,384 |
$5,571 |
$5,832 |
$5,963 |
$6,101 |
$6,368 |
$6,715 |
| (Standard Error) |
($24) |
($25) |
($15) |
($21) |
($22) |
($26) |
($28) |
($23) |
($25) |
($26) |
($27) |
($28) |
($31) |
| <50 |
$4,121 |
$4,260 |
$4,501 |
$4,652 |
$4,956 |
$5,258 |
$5,460 |
$5,628 |
$5,886 |
$5,947 |
$6,070 |
$6,421 |
$6,667 |
| (Standard Error) |
($45) |
($34) |
($31) |
($31) |
($34) |
($39) |
($60) |
($39) |
($55) |
($55) |
($53) |
($61) |
($63) |
| 50-99 |
$3,962 |
$4,045 |
$4,215 |
$4,614 |
$4,713 |
$4,861 |
$5,246 |
$5,314 |
$5,549 |
$5,642 |
$5,743 |
$6,163 |
$6,287 |
| (Standard Error) |
($70) |
($66) |
($37) |
($82) |
($52) |
($75) |
($39) |
($73) |
($82) |
($104) |
($96) |
($121) |
($111) |
| 100+ |
$3,950 |
$4,080 |
$4,370 |
$4,681 |
$4,959 |
$5,252 |
$5,378 |
$5,584 |
$5,851 |
$6,006 |
$6,146 |
$6,377 |
$6,770 |
| (Standard Error) |
($32) |
($32) |
($26) |
($38) |
($23) |
($31) |
($28) |
($29) |
($30) |
($31) |
($32) |
($33) |
($37) |
|
Source: Medical Expenditure Panel Survey-Insurance Component, private-sector establishments, 2005‑2018.
Note: Medical Expenditure Panel Survey-Insurance Component estimates are not available for 2007.
|
Return to Table of Contents
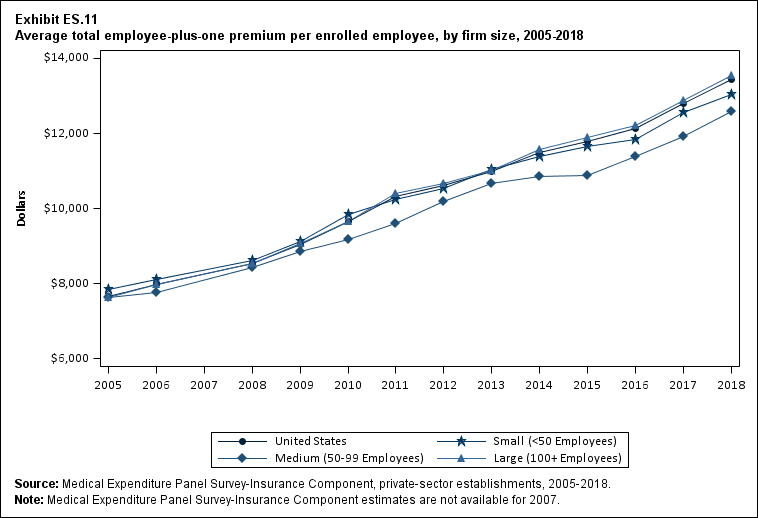
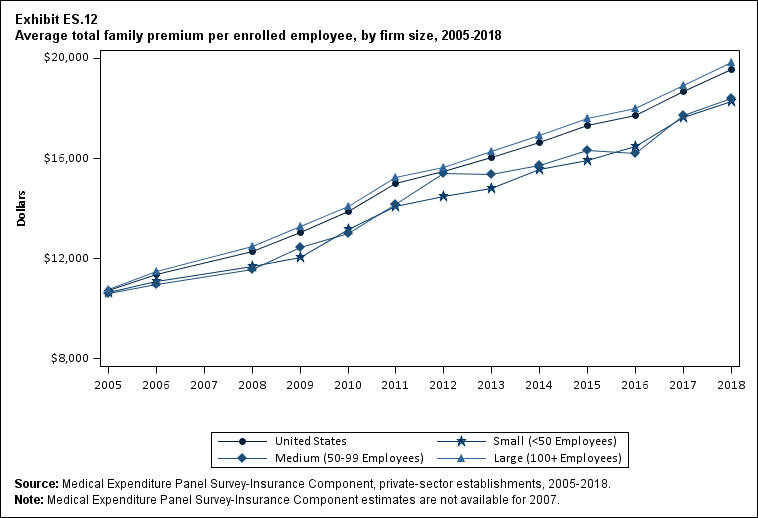
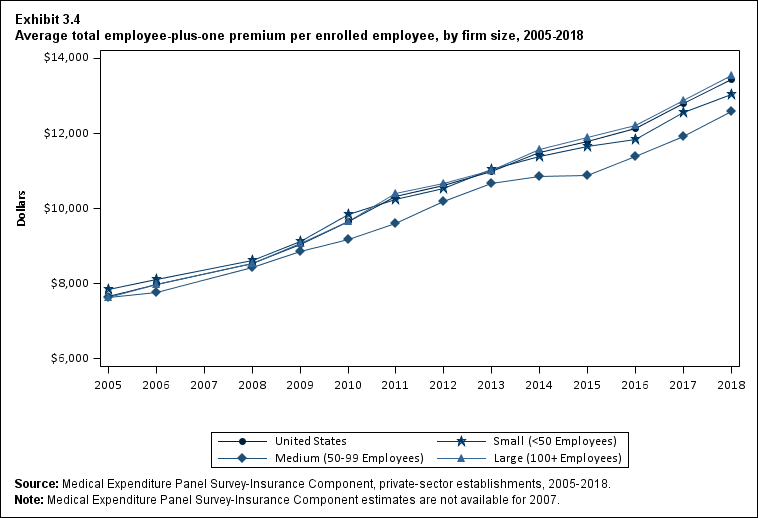
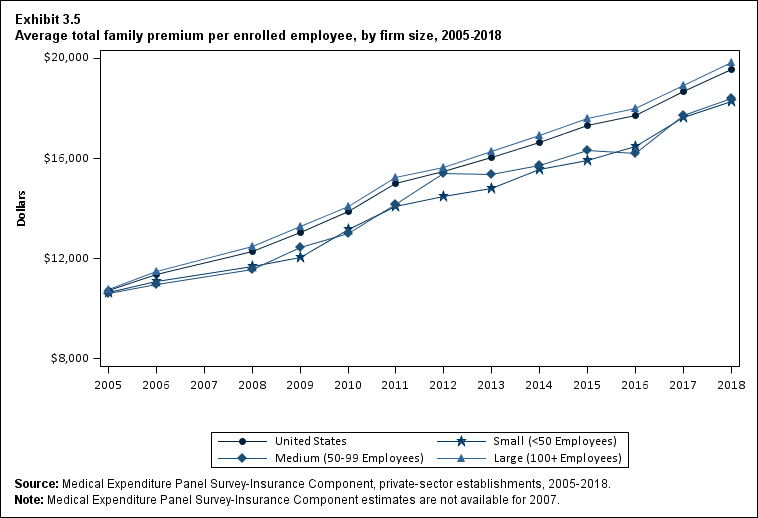
Premiums for dependent coverage were highest in large firms in 2018. Specifically, premiums were higher in large firms than in medium and small firms for employee-plus-one coverage ($13,537 vs. $12,593 and $13,044, respectively) and family coverage ($19,824 vs. $18,386 and $18,296, respectively) (Exhibits ES.11 and ES.12).
Exhibit ES.11 Average total employee-plus-one premium (standard error) per enrolled employee, by firm size, 2005‑2018
| Number of Employees |
2005 |
2006 |
2008 |
2009 |
2010 |
2011 |
2012 |
2013 |
2014 |
2015 |
2016 |
2017 |
2018 |
| U.S. |
$7,671 |
$7,988 |
$8,535 |
$9,053 |
$9,664 |
$10,329 |
$10,621 |
$10,990 |
$11,503 |
$11,800 |
$12,124 |
$12,789 |
$13,425 |
| (Standard Error) |
($44) |
($48) |
($43) |
($34) |
($60) |
($105) |
($56) |
($54) |
($60) |
($58) |
($60) |
($70) |
($70) |
| <50 |
$7,841 |
$8,105 |
$8,631 |
$9,124 |
$9,850 |
$10,253 |
$10,524 |
$11,050 |
$11,386 |
$11,666 |
$11,833 |
$12,558 |
$13,044 |
| (Standard Error) |
($115) |
($113) |
($110) |
($119) |
($80) |
($104) |
($121) |
($92) |
($163) |
($158) |
($156) |
($170) |
($176) |
| 50-99 |
$7,645 |
$7,774 |
$8,421 |
$8,852 |
$9,166 |
$9,615 |
$10,178 |
$10,673 |
$10,845 |
$10,885 |
$11,389 |
$11,931 |
$12,593 |
| (Standard Error) |
($138) |
($167) |
($88) |
($148) |
($124) |
($192) |
($185) |
($330) |
($187) |
($198) |
($227) |
($232) |
($236) |
| 100+ |
$7,640 |
$7,981 |
$8,527 |
$9,058 |
$9,669 |
$10,394 |
$10,672 |
$11,006 |
$11,571 |
$11,892 |
$12,225 |
$12,878 |
$13,537 |
| (Standard Error) |
($60) |
($61) |
($60) |
($34) |
($62) |
($113) |
($70) |
($59) |
($68) |
($66) |
($68) |
($79) |
($79) |
|
Source: Medical Expenditure Panel Survey-Insurance Component, private-sector establishments, 2005‑2018.
Note: Medical Expenditure Panel Survey-Insurance Component estimates are not available for 2007.
|
Return to Table of Contents
Exhibit ES.12 Average total family premium (standard error) per enrolled employee, by firm size, 2005‑2018
| Number of Employees |
2005 |
2006 |
2008 |
2009 |
2010 |
2011 |
2012 |
2013 |
2014 |
2015 |
2016 |
2017 |
2018 |
| U.S. |
$10,728 |
$11,381 |
$12,298 |
$13,027 |
$13,871 |
$15,022 |
$15,473 |
$16,029 |
$16,655 |
$17,322 |
$17,710 |
$18,687 |
$19,565 |
| (Standard Error) |
($41) |
($32) |
($81) |
($25) |
($75) |
($98) |
($95) |
($61) |
($79) |
($95) |
($84) |
($105) |
($104) |
| <50 |
$10,632 |
$11,095 |
$11,679 |
$12,041 |
$13,170 |
$14,086 |
$14,496 |
$14,787 |
$15,575 |
$15,919 |
$16,471 |
$17,649 |
$18,296 |
| (Standard Error) |
($106) |
($116) |
($182) |
($129) |
($111) |
($145) |
($181) |
($89) |
($177) |
($212) |
($207) |
($192) |
($231) |
| 50-99 |
$10,619 |
$10,954 |
$11,578 |
$12,431 |
$13,019 |
$14,151 |
$15,421 |
$15,376 |
$15,732 |
$16,336 |
$16,214 |
$17,735 |
$18,386 |
| (Standard Error) |
($208) |
($301) |
($128) |
($229) |
($153) |
($168) |
($273) |
($268) |
($274) |
($335) |
($348) |
($327) |
($473) |
| 100+ |
$10,754 |
$11,471 |
$12,468 |
$13,271 |
$14,074 |
$15,245 |
$15,641 |
$16,284 |
$16,903 |
$17,612 |
$18,000 |
$18,911 |
$19,824 |
| (Standard Error) |
($55) |
($51) |
($95) |
($33) |
($85) |
($117) |
($114) |
($82) |
($91) |
($110) |
($95) |
($122) |
($118) |
|
Source: Medical Expenditure Panel Survey-Insurance Component, private-sector establishments, 2005‑2018.
Note: Medical Expenditure Panel Survey-Insurance Component estimates are not available for 2007.
|
Return to Table of Contents
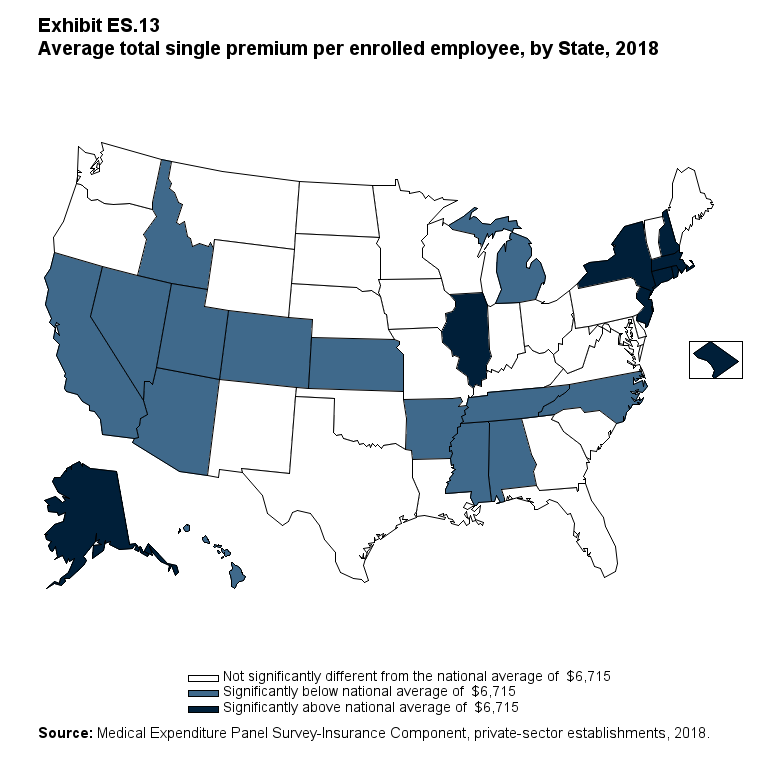
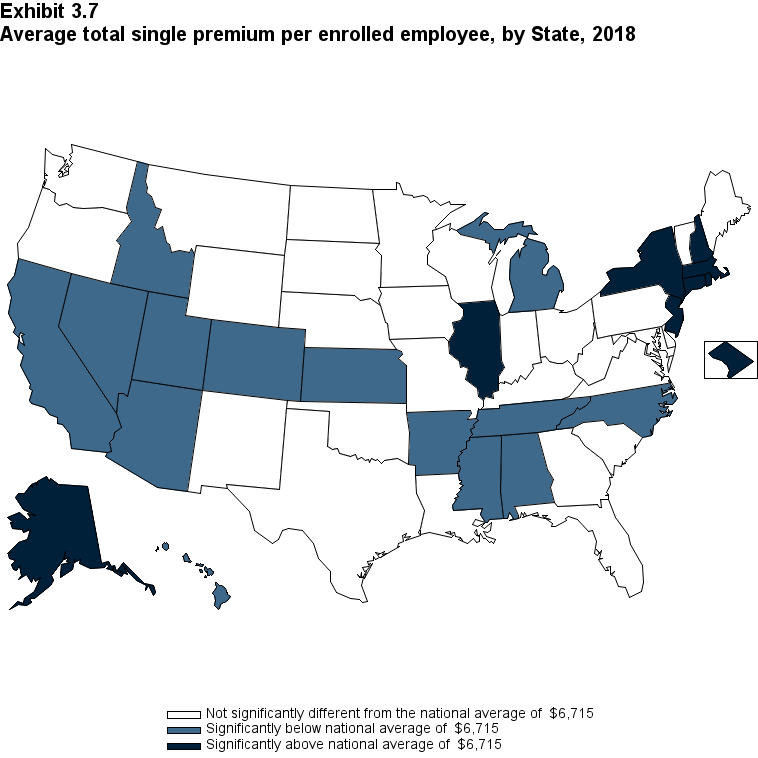
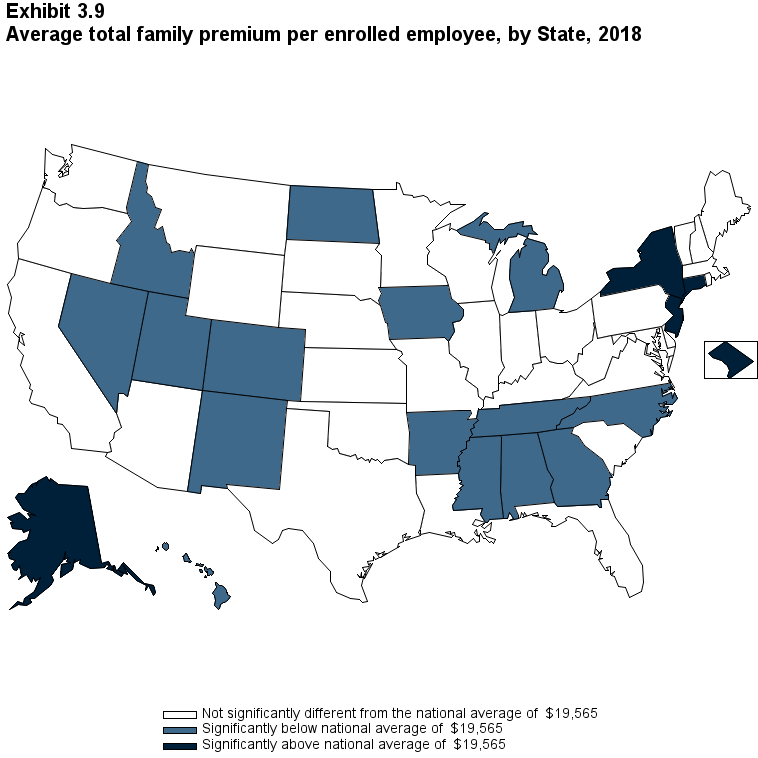
In total, 14 States had average annual premiums for single coverage that were significantly lower than the national average of $6,715: Alabama, Arizona, Arkansas, California, Colorado, Hawaii, Idaho, Kansas, Michigan, Mississippi, Nevada, North Carolina, Tennessee and Utah. Nine States had average annual single premiums that were significantly higher than the national average: Alaska, Connecticut, District of Columbia, Illinois, Massachusetts, New Hampshire, New Jersey, New York, and Rhode Island (Exhibit ES.13).
Exhibit ES.13 Average total single premium (standard error) per enrolled employee, by State, 2018
| Alabama |
$6,089* |
Kentucky |
$6,690 |
North Dakota |
$6,643 |
| (Standard Error) |
($138) |
(Standard Error) |
($221) |
(Standard Error) |
($132) |
| Alaska |
$8,432* |
Louisiana |
$6,537 |
Ohio |
$6,804 |
| (Standard Error) |
($199) |
(Standard Error) |
($197) |
(Standard Error) |
($129) |
| Arizona |
$6,229* |
Maine |
$6,866 |
Oklahoma |
$6,630 |
| (Standard Error) |
($140) |
(Standard Error) |
($144) |
(Standard Error) |
($156) |
| Arkansas |
$5,974* |
Maryland |
$6,695 |
Oregon |
$6,441 |
| (Standard Error) |
($167) |
(Standard Error) |
($194) |
(Standard Error) |
($160) |
| California |
$6,542* |
Massachusetts |
$7,443* |
Pennsylvania |
$6,769 |
| (Standard Error) |
($82) |
(Standard Error) |
($254) |
(Standard Error) |
($145) |
| Colorado |
$6,255* |
Michigan |
$6,322* |
Rhode Island |
$7,018* |
| (Standard Error) |
($121) |
(Standard Error) |
($147) |
(Standard Error) |
($143) |
| Connecticut |
$7,264* |
Minnesota |
$6,781 |
South Carolina |
$6,708 |
| (Standard Error) |
($149) |
(Standard Error) |
($157) |
(Standard Error) |
($145) |
| Delaware |
$6,848 |
Mississippi |
$5,993* |
South Dakota |
$6,931 |
| (Standard Error) |
($157) |
(Standard Error) |
($124) |
(Standard Error) |
($146) |
| District of Columbia |
$7,230* |
Missouri |
$6,664 |
Tennessee |
$5,971* |
| (Standard Error) |
($147) |
(Standard Error) |
($157) |
(Standard Error) |
($100) |
| Florida |
$6,674 |
Montana |
$6,862 |
Texas |
$6,589 |
| (Standard Error) |
($189) |
(Standard Error) |
($161) |
(Standard Error) |
($134) |
| Georgia |
$6,799 |
Nebraska |
$6,851 |
Utah |
$6,125* |
| (Standard Error) |
($163) |
(Standard Error) |
($219) |
(Standard Error) |
($162) |
| Hawaii |
$6,475* |
Nevada |
$6,032* |
Vermont |
$6,919 |
| (Standard Error) |
($114) |
(Standard Error) |
($166) |
(Standard Error) |
($148) |
| Idaho |
$6,175* |
New Hampshire |
$7,405* |
Virginia |
$6,635 |
| (Standard Error) |
($162) |
(Standard Error) |
($301) |
(Standard Error) |
($155) |
| Illinois |
$7,123* |
New Jersey |
$7,507* |
Washington |
$6,646 |
| (Standard Error) |
($166) |
(Standard Error) |
($126) |
(Standard Error) |
($154) |
| Indiana |
$6,778 |
New Mexico |
$6,624 |
West Virginia |
$6,898 |
| (Standard Error) |
($200) |
(Standard Error) |
($238) |
(Standard Error) |
($272) |
| Iowa |
$6,796 |
New York |
$7,741* |
Wisconsin |
$6,816 |
| (Standard Error) |
($160) |
(Standard Error) |
($211) |
(Standard Error) |
($142) |
| Kansas |
$6,262* |
North Carolina |
$6,339* |
Wyoming |
$6,779 |
| (Standard Error) |
($151) |
(Standard Error) |
($129) |
(Standard Error) |
($183) |
|
Source: Medical Expenditure Panel Survey-Insurance Component, private-sector establishments, 2018.
Note: * Statistically different from national average of $6,715 at p < 0.05. Note that the standard error on the national estimate of $6,715 is $31.18.
|
Return to Table of Contents
Employee Premium Contributions
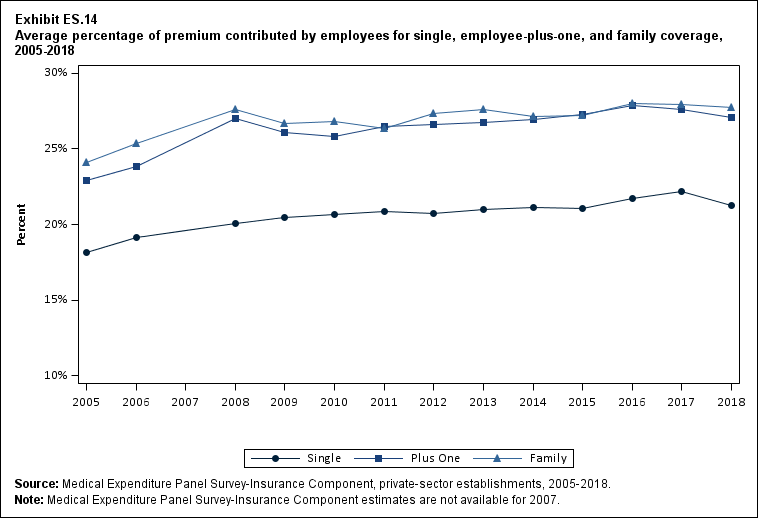
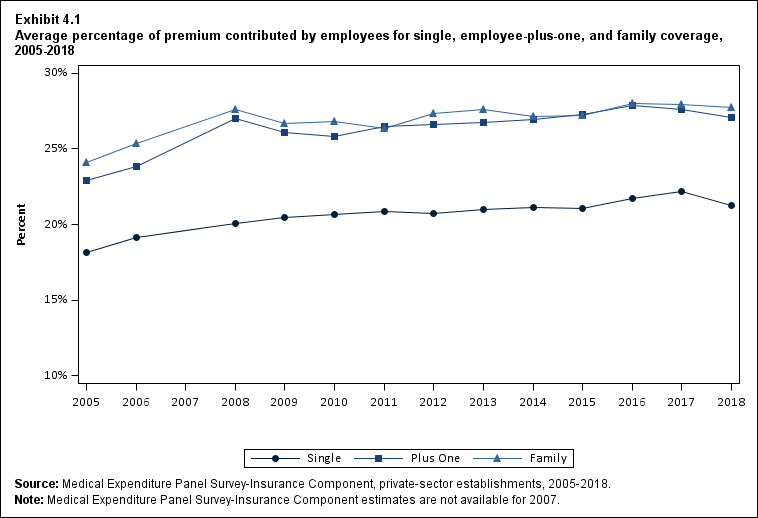
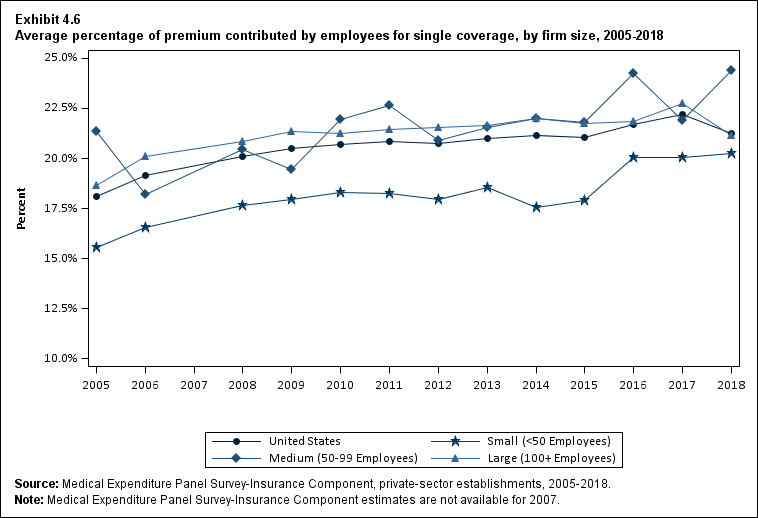
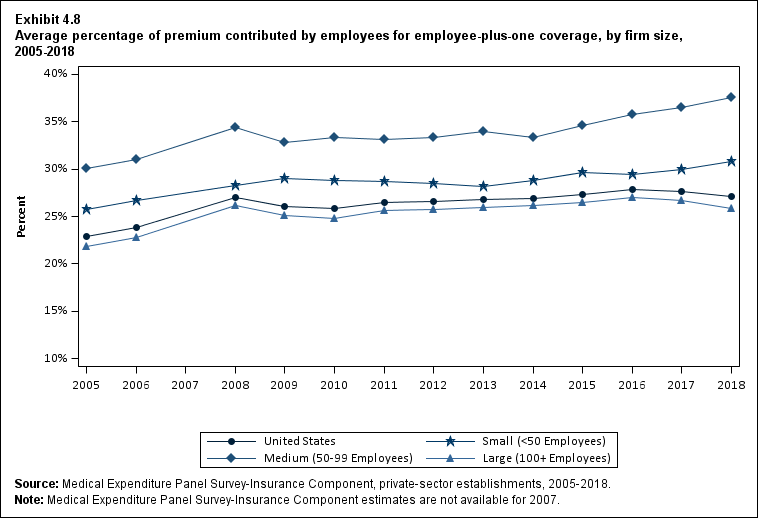
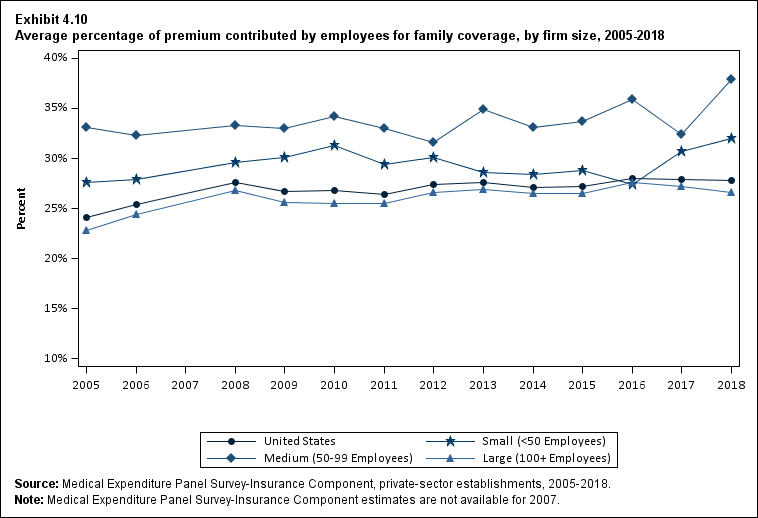
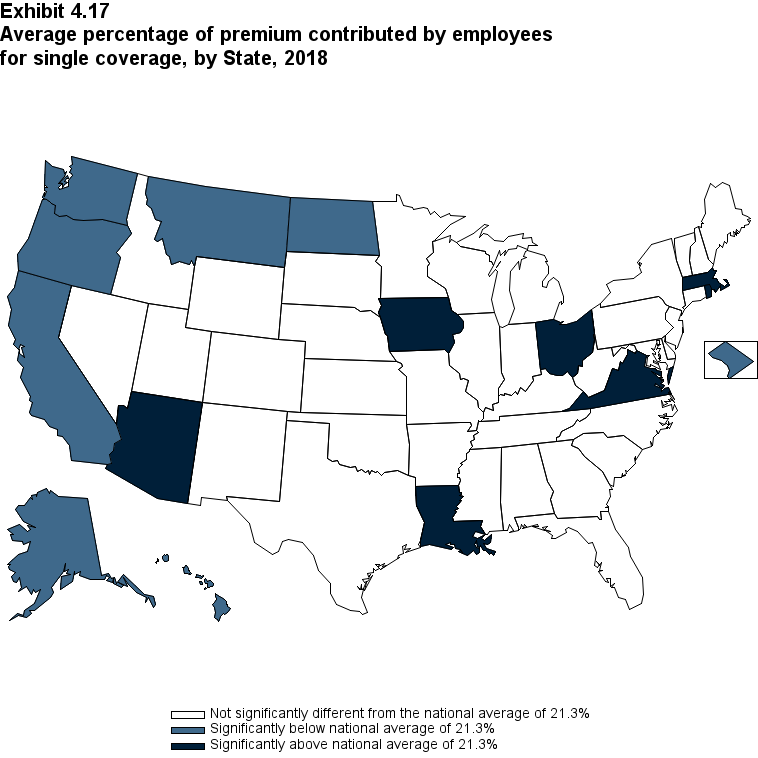
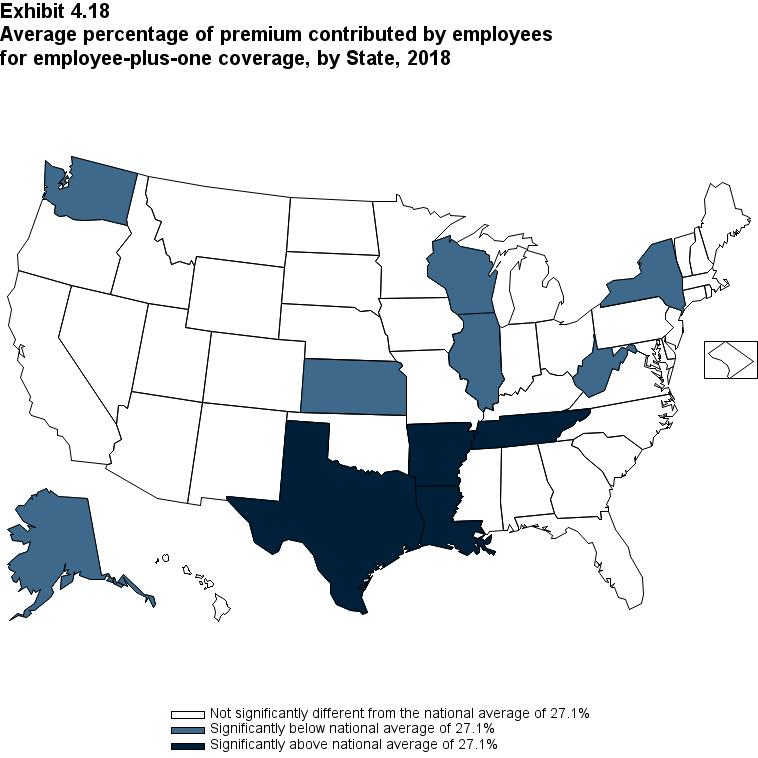
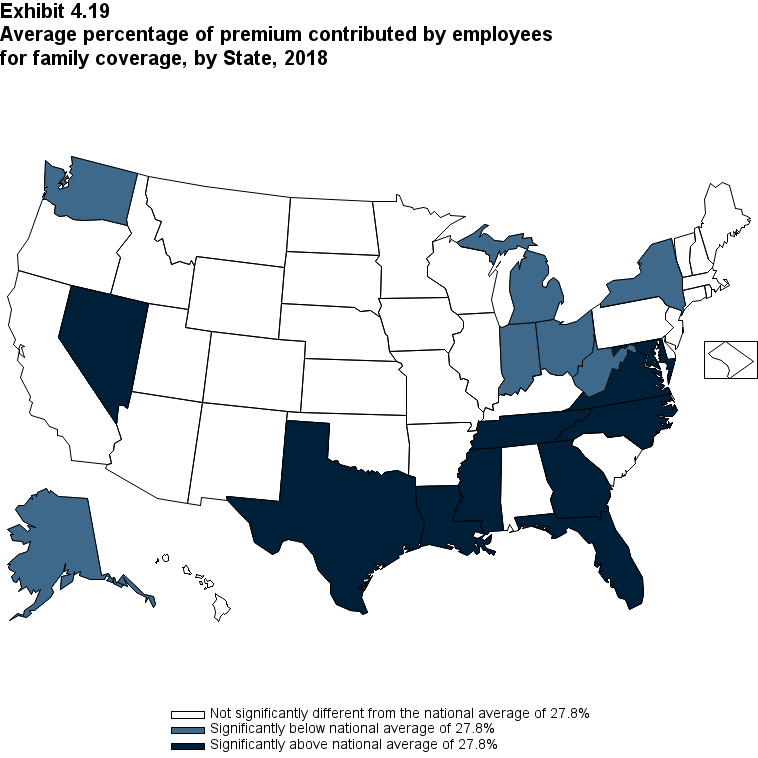
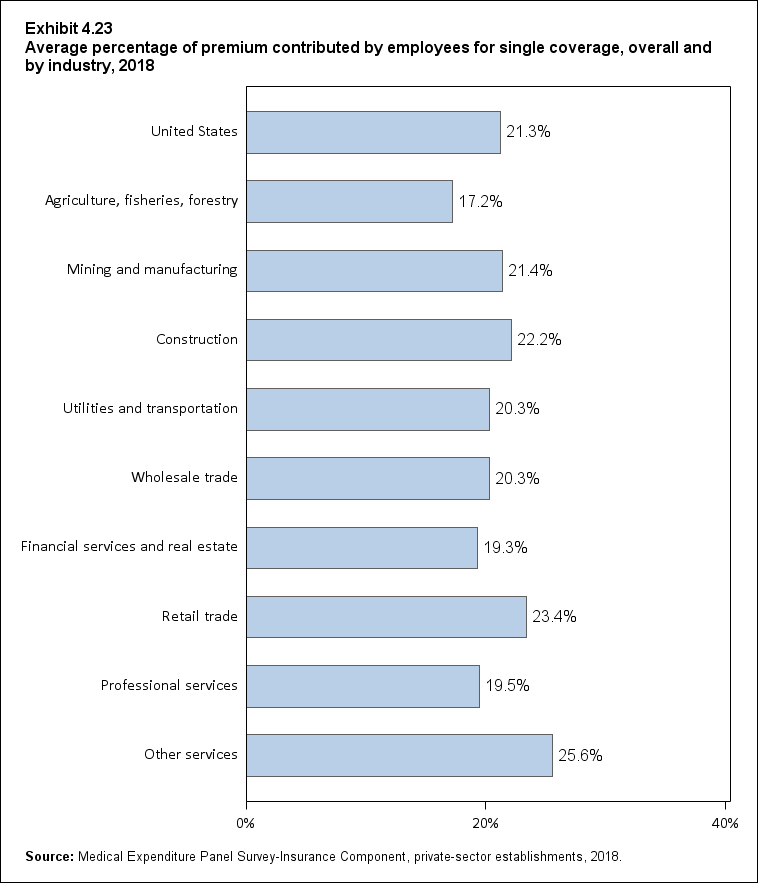
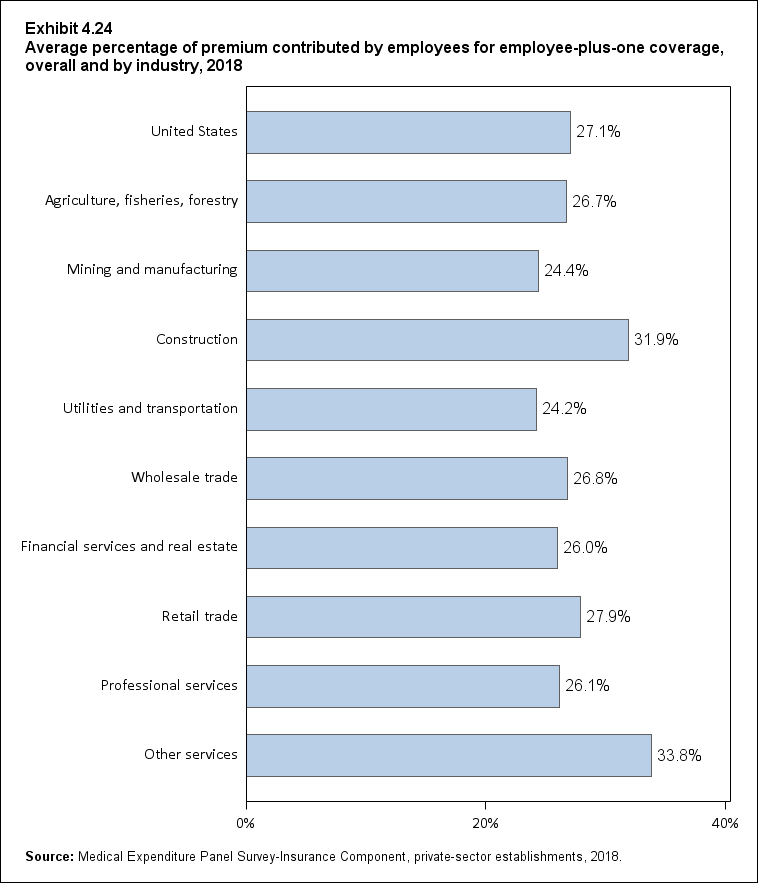
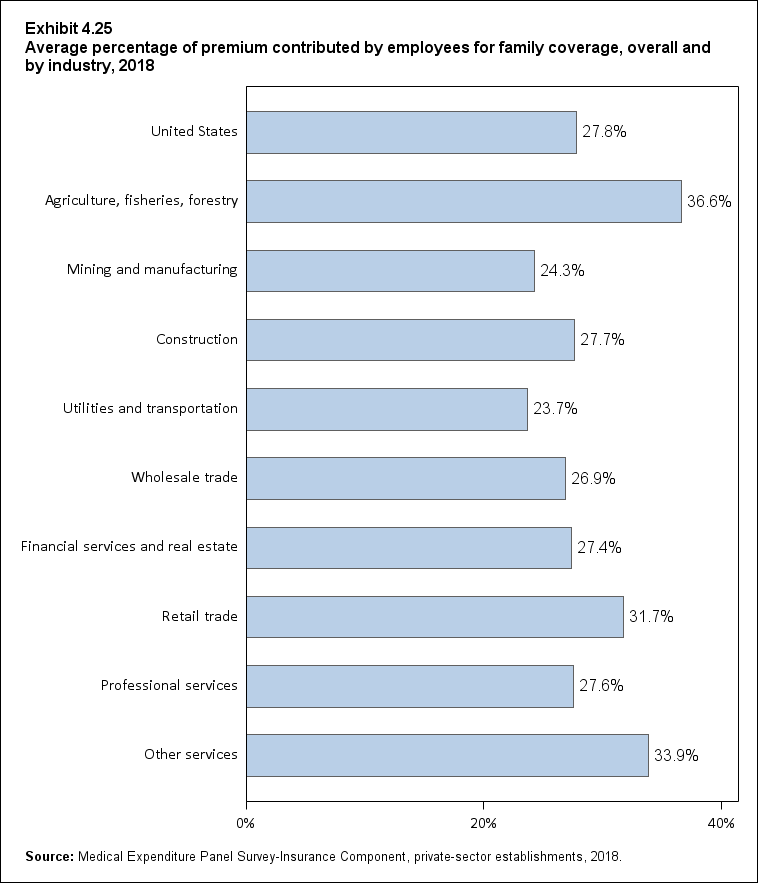
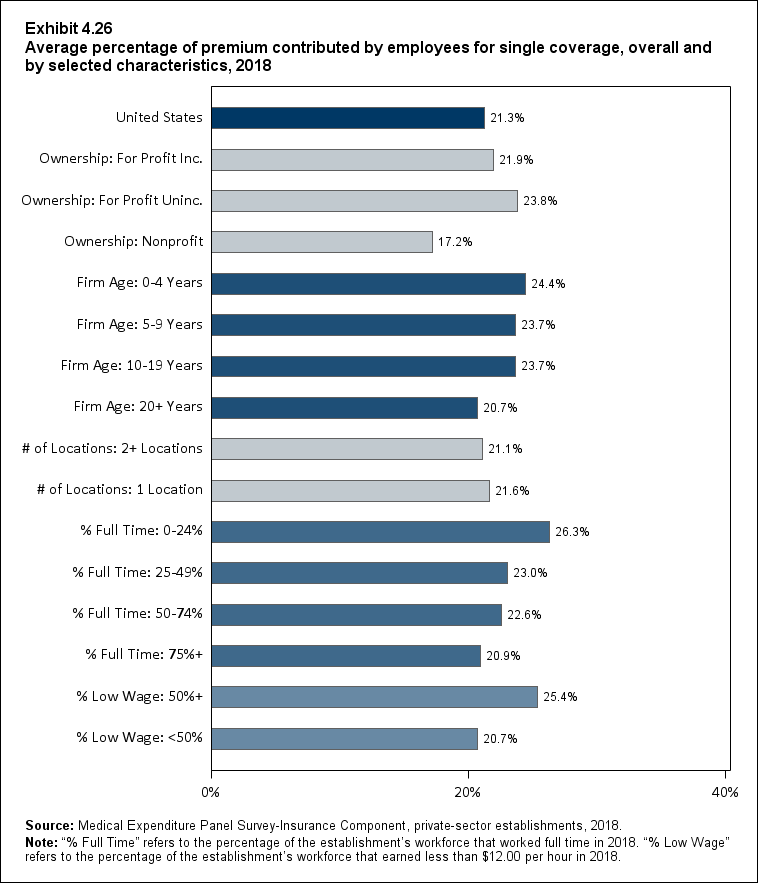
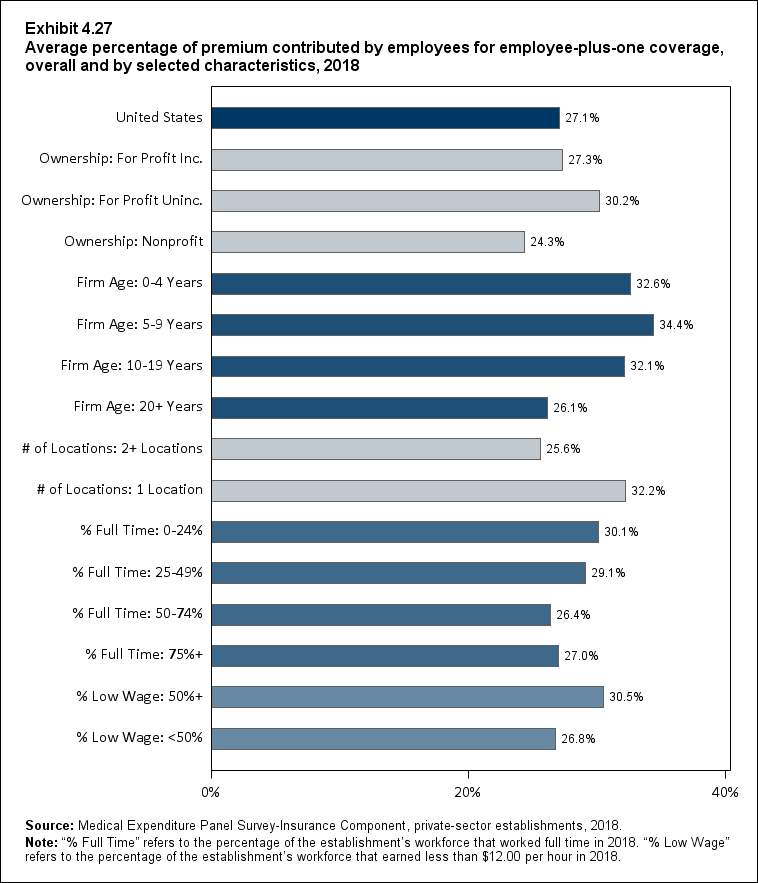
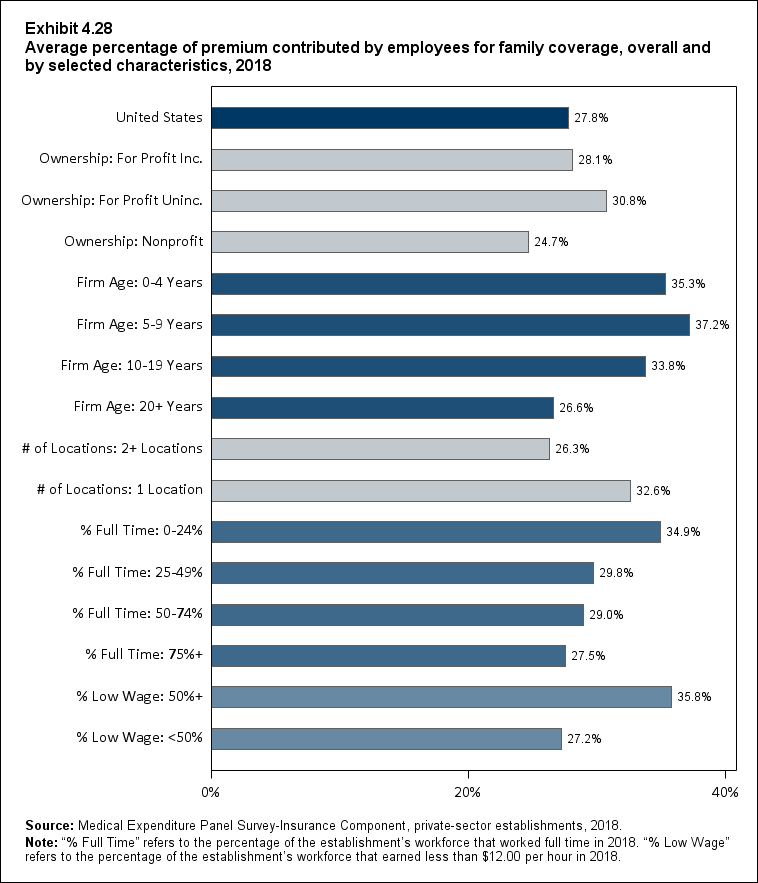
In 2018, enrolled employees paid 21.3 percent of total premiums for single coverage, 27.1 percent for employee-plus-one coverage, and 27.8 percent for family coverage (Exhibit ES.14). The employee share of total premiums in 2018 for single coverage decreased by 0.9 percentage points from its 2017 level, while the employee shares for the other two coverage types were not significantly different from their 2017 levels.
Exhibit ES.14 Average percentage (standard error) of premium contributed by employees for single, employee-plus-one, and family coverage, 2005‑2018
| Coverage |
2005 |
2006 |
2008 |
2009 |
2010 |
2011 |
2012 |
2013 |
2014 |
2015 |
2016 |
2017 |
2018 |
| Single |
18.1% |
19.1% |
20.1% |
20.5% |
20.7% |
20.9% |
20.8% |
21.0% |
21.2% |
21.1% |
21.7% |
22.2% |
21.3% |
| (Standard Error) |
(0.4%) |
(0.4%) |
(0.2%) |
(0.3%) |
(0.2%) |
(0.2%) |
(0.3%) |
(0.3%) |
(0.2%) |
(0.2%) |
(0.2%) |
(0.2%) |
(0.2%) |
| Plus One |
22.9% |
23.8% |
27.0% |
26.1% |
25.8% |
26.5% |
26.6% |
26.7% |
26.9% |
27.3% |
27.8% |
27.6% |
27.1% |
| (Standard Error) |
(0.4%) |
(0.4%) |
(0.3%) |
(0.3%) |
(0.3%) |
(0.3%) |
(0.4%) |
(0.2%) |
(0.3%) |
(0.3%) |
(0.3%) |
(0.3%) |
(0.3%) |
| Family |
24.1% |
25.4% |
27.6% |
26.7% |
26.8% |
26.4% |
27.4% |
27.6% |
27.1% |
27.2% |
28.0% |
27.9% |
27.8% |
| (Standard Error) |
(0.4%) |
(0.3%) |
(0.4%) |
(0.3%) |
(0.4%) |
(0.3%) |
(0.4%) |
(0.3%) |
(0.3%) |
(0.3%) |
(0.3%) |
(0.4%) |
(0.3%) |
|
Source: Medical Expenditure Panel Survey-Insurance Component, private-sector establishments, 2005‑2018.
Note: Medical Expenditure Panel Survey-Insurance Component estimates are not available for 2007.
|
From 2005 to 2018, the percentage of premiums contributed by employees increased by 3.2 percentage points, 4.2 percentage points, and 3.7 percentage points for single, employee-plus-one, and family coverage, respectively (Exhibit ES.14). These increases occurred because employee contributions increased more rapidly than employer contributions over the entire period for each type of coverage (Section 4, Exhibits 4.1, 4.3, 4.4, and 4.5).
Return to Table of Contents
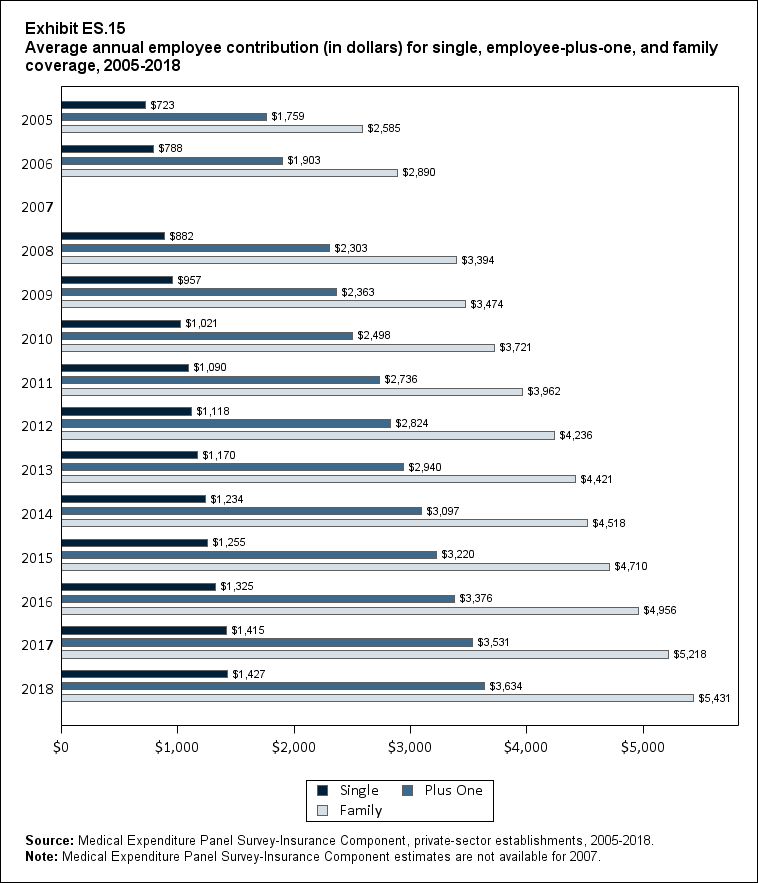
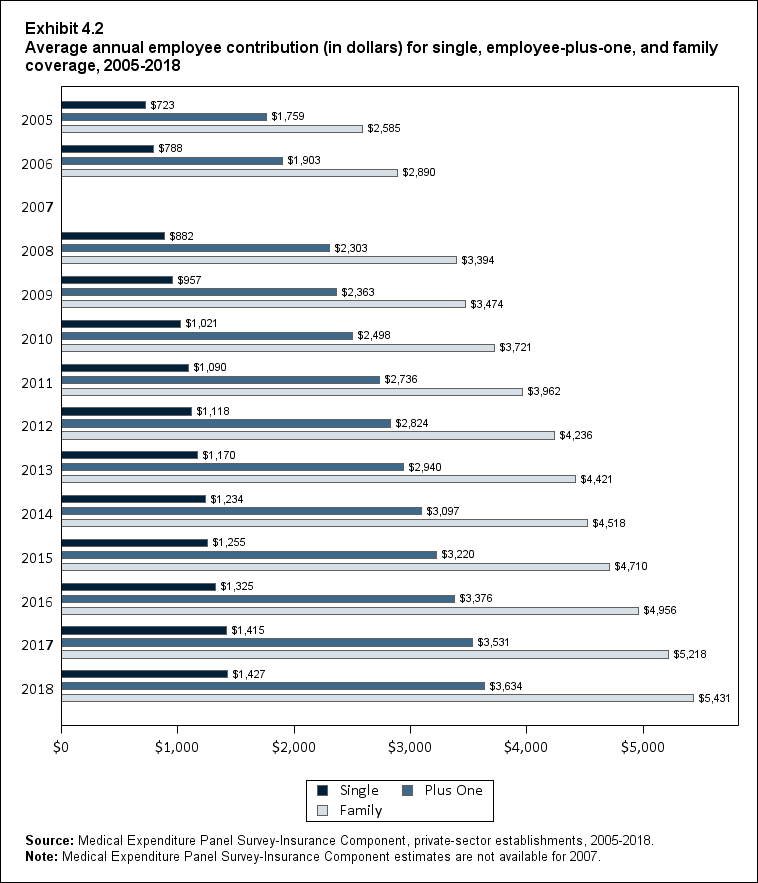
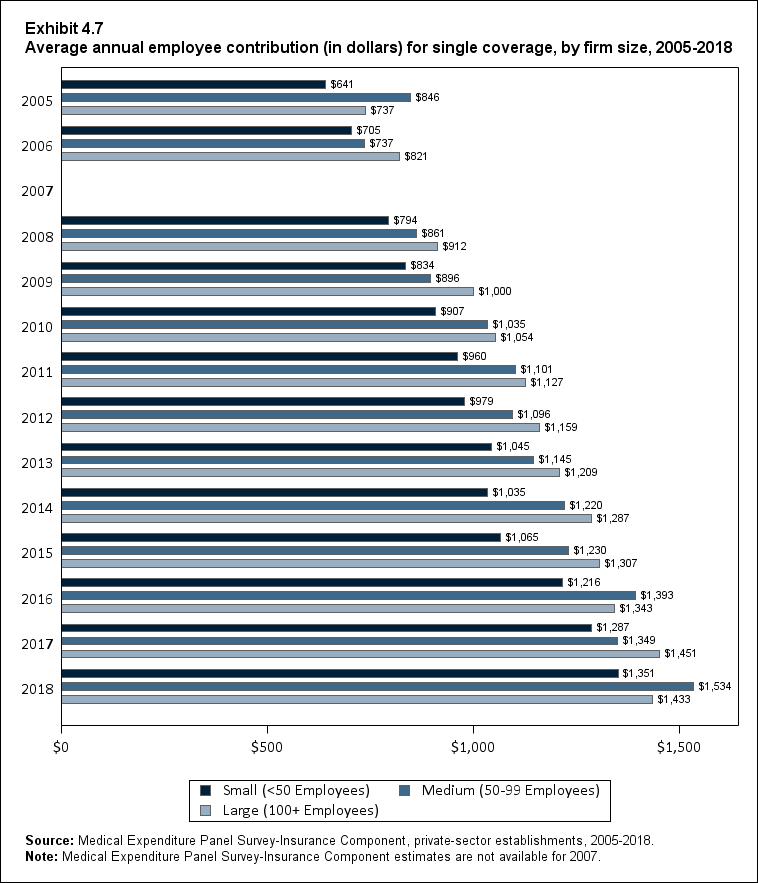
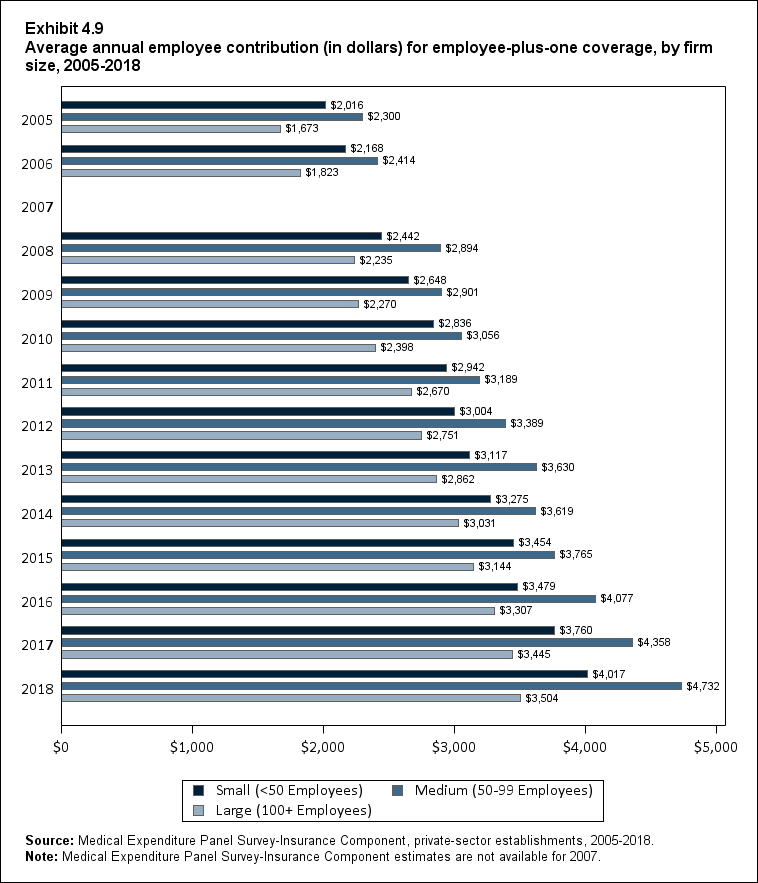
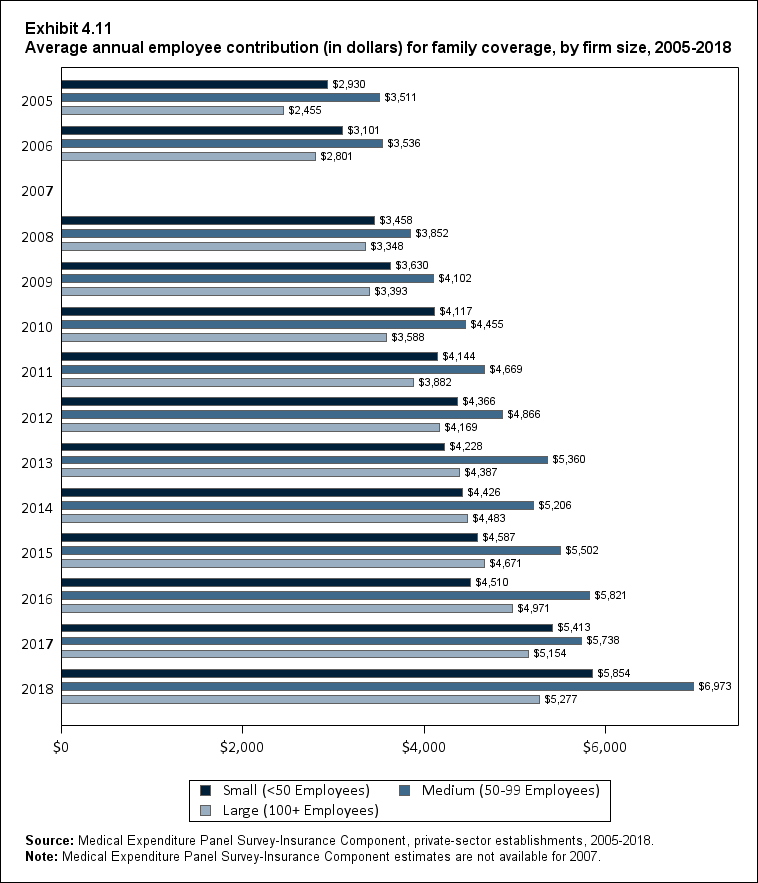
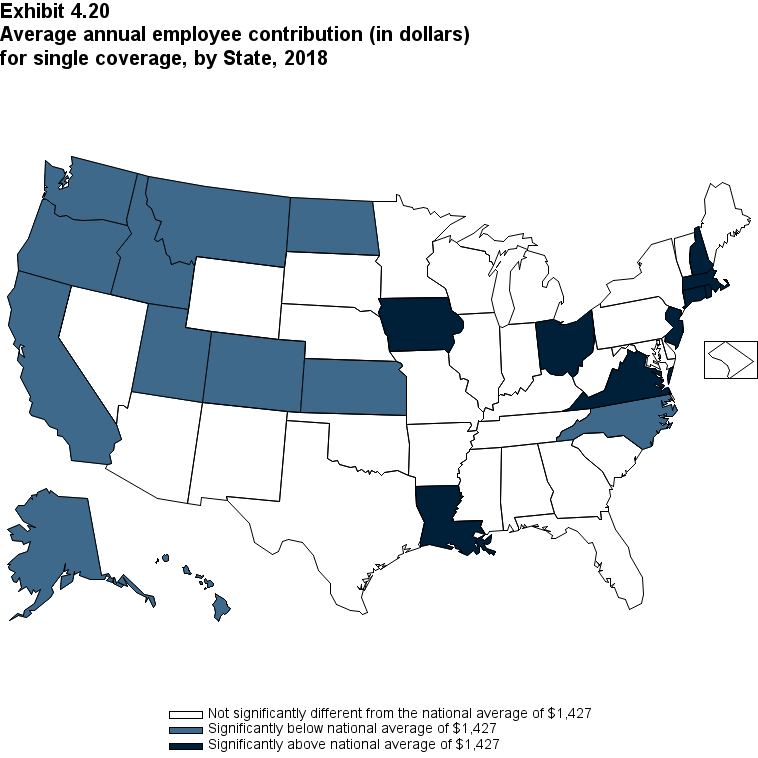
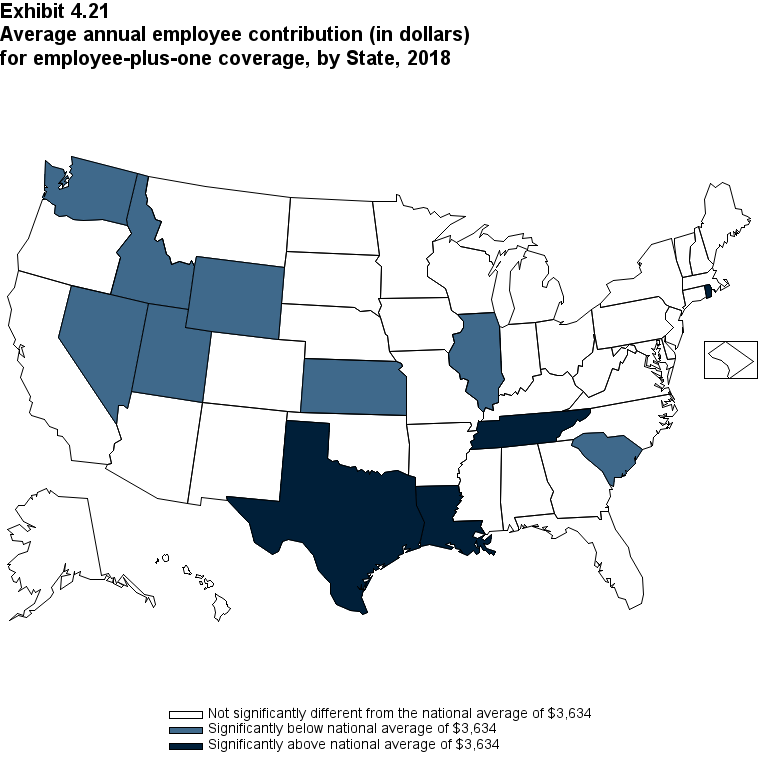
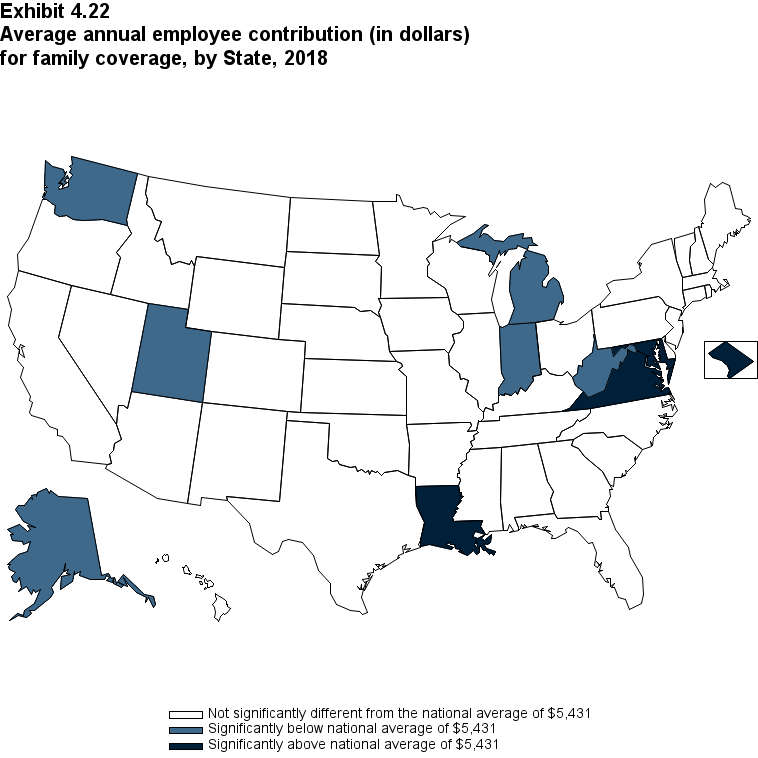
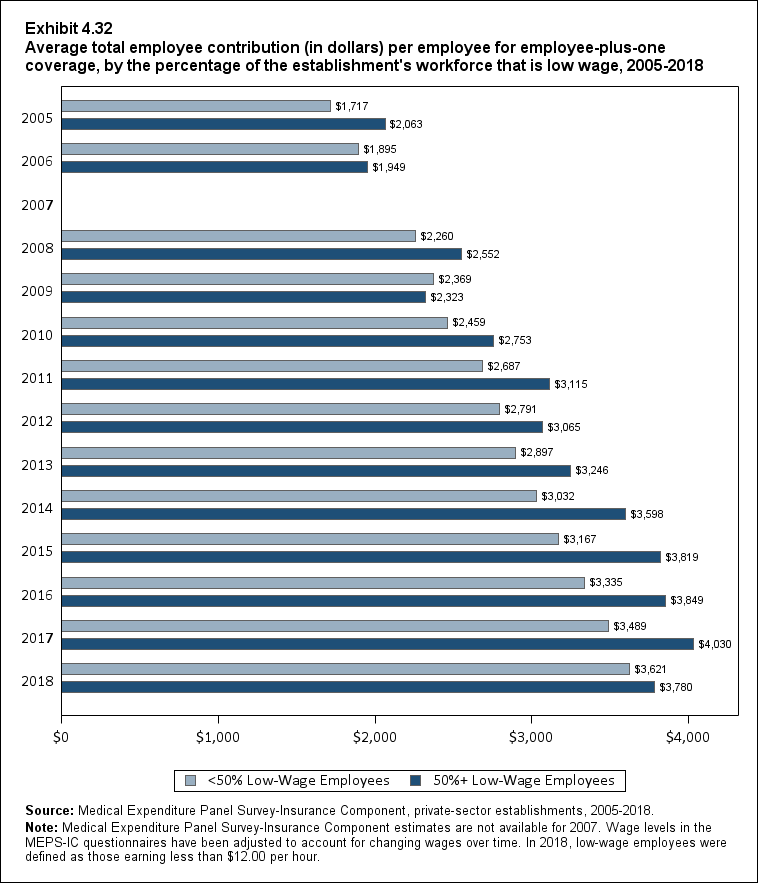
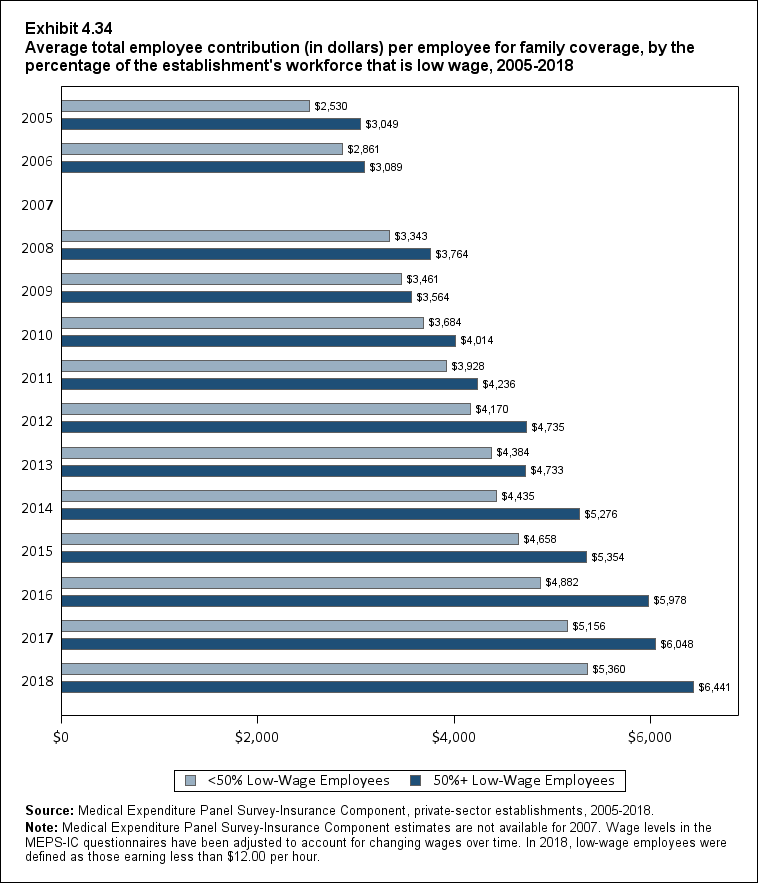
Average employee contributions in 2018 were $3,634 for employee-plus-one coverage and $5,431 for family coverage, representing increases of 2.9 percent and 4.1 percent, respectively, over 2017 levels (p <0.10 for employee-plus-one coverage). Employee contributions for single coverage in 2018 ($1,427) were not significantly different from average contributions in 2017 (Exhibit ES.15).
Exhibit ES.15 Average annual employee contribution (in dollars) (standard error) for single, employee-plus-one, and family coverage, 2005‑2018
| Coverage |
2005 |
2006 |
2008 |
2009 |
2010 |
2011 |
2012 |
2013 |
2014 |
2015 |
2016 |
2017 |
2018 |
| Single |
$723 |
$788 |
$882 |
$957 |
$1,021 |
$1,090 |
$1,118 |
$1,170 |
$1,234 |
$1,255 |
$1,325 |
$1,415 |
$1,427 |
| (Standard Error) |
($14) |
($16) |
($6) |
($13) |
($14) |
($9) |
($14) |
($16) |
($13) |
($14) |
($13) |
($15) |
($14) |
| Plus One |
$1,759 |
$1,903 |
$2,303 |
$2,363 |
$2,498 |
$2,736 |
$2,824 |
$2,940 |
$3,097 |
$3,220 |
$3,376 |
$3,531 |
$3,634 |
| (Standard Error) |
($29) |
($24) |
($22) |
($27) |
($42) |
($36) |
($46) |
($23) |
($40) |
($35) |
($36) |
($39) |
($39) |
| Family |
$2,585 |
$2,890 |
$3,394 |
$3,474 |
$3,721 |
$3,962 |
$4,236 |
$4,421 |
$4,518 |
$4,710 |
$4,956 |
$5,218 |
$5,431 |
| (Standard Error) |
($38) |
($34) |
($54) |
($44) |
($53) |
($42) |
($69) |
($50) |
($48) |
($56) |
($56) |
($64) |
($63) |
|
Source: Medical Expenditure Panel Survey-Insurance Component, private-sector establishments, 2005‑2018.
Note: Medical Expenditure Panel Survey-Insurance Component estimates are not available for 2007.
|
Return to Table of Contents
Plan Benefits: Deductibles
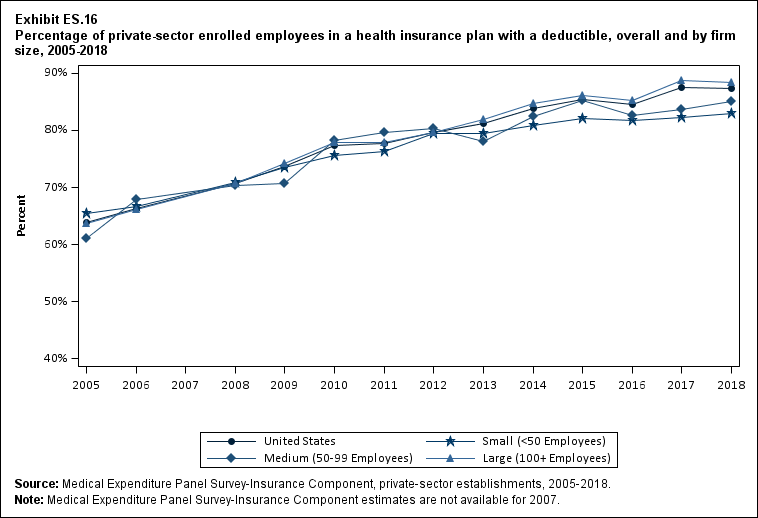
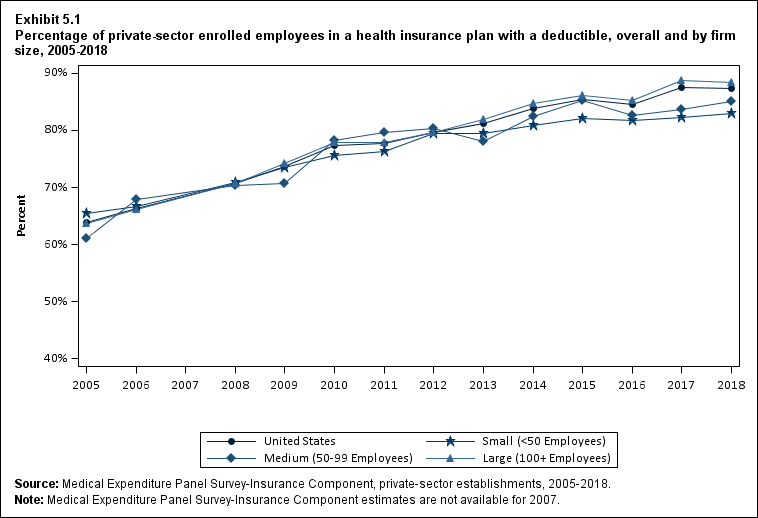
There was no significant change in the percentage of enrolled employees in a health insurance plan with a deductible from 2017 (87.5 percent) to 2018 (87.3 percent) (Exhibit ES.16). From 2005 to 2018, the percentage of enrollees in plans with deductibles increased from 63.9 percent to 87.3 percent.
Exhibit ES.16 Percentage (standard error) of private-sector enrolled employees in a health insurance plan with a deductible, overall and by firm size, 2005‑2018
| Number of Employees |
2005 |
2006 |
2008 |
2009 |
2010 |
2011 |
2012 |
2013 |
2014 |
2015 |
2016 |
2017 |
2018 |
| U.S. |
63.9% |
66.4% |
70.7% |
73.8% |
77.5% |
77.8% |
79.6% |
81.3% |
83.9% |
85.4% |
84.5% |
87.5% |
87.3% |
| (Standard Error) |
(0.9%) |
(0.6%) |
(0.5%) |
(0.5%) |
(0.3%) |
(0.7%) |
(0.6%) |
(0.7%) |
(0.5%) |
(0.5%) |
(0.5%) |
(0.4%) |
(0.4%) |
| <50 |
65.5% |
66.6% |
70.9% |
73.5% |
75.7% |
76.3% |
79.5% |
79.5% |
80.8% |
82.1% |
81.7% |
82.3% |
83.0% |
| (Standard Error) |
(1.0%) |
(0.7%) |
(0.7%) |
(0.7%) |
(0.7%) |
(0.4%) |
(1.0%) |
(0.8%) |
(0.8%) |
(0.8%) |
(0.8%) |
(0.8%) |
(0.8%) |
| 50-99 |
61.1% |
67.9% |
70.3% |
70.6% |
78.2% |
79.6% |
80.3% |
78.0% |
82.4% |
85.3% |
82.5% |
83.7% |
85.1% |
| (Standard Error) |
(2.6%) |
(2.6%) |
(1.4%) |
(1.9%) |
(1.5%) |
(1.7%) |
(1.4%) |
(1.1%) |
(1.5%) |
(1.5%) |
(1.5%) |
(1.6%) |
(1.4%) |
| 100+ |
63.8% |
66.2% |
70.7% |
74.2% |
77.8% |
77.9% |
79.6% |
81.9% |
84.6% |
86.1% |
85.2% |
88.8% |
88.3% |
| (Standard Error) |
(1.0%) |
(0.8%) |
(0.6%) |
(0.6%) |
(0.3%) |
(1.0%) |
(0.7%) |
(0.7%) |
(0.6%) |
(0.6%) |
(0.6%) |
(0.4%) |
(0.5%) |
|
Source: Medical Expenditure Panel Survey-Insurance Component, private-sector establishments, 2005‑2018.
Note: Medical Expenditure Panel Survey-Insurance Component estimates are not available for 2007.
|
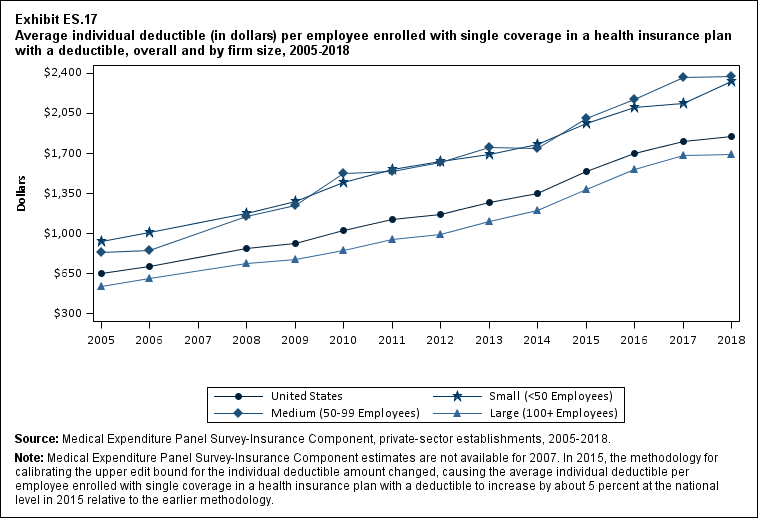
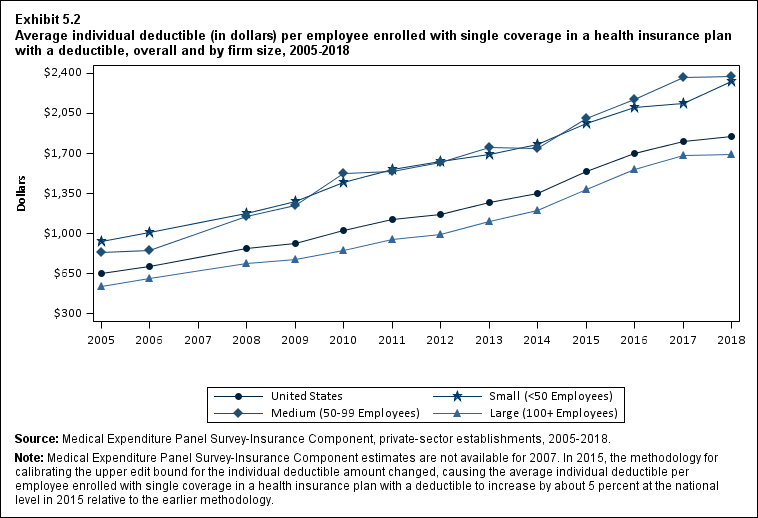
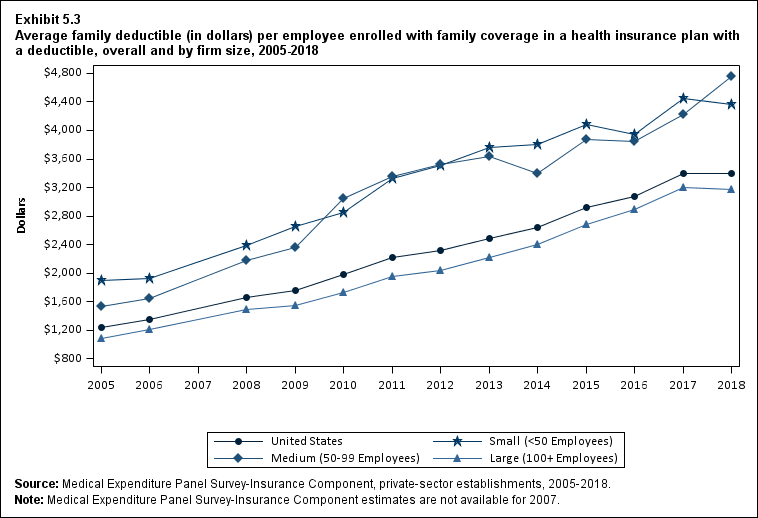
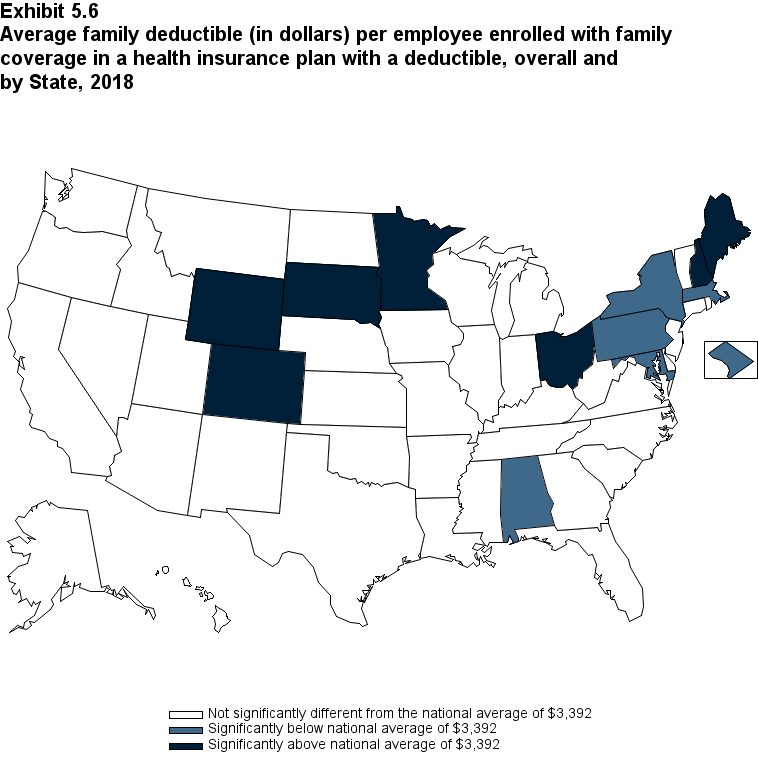
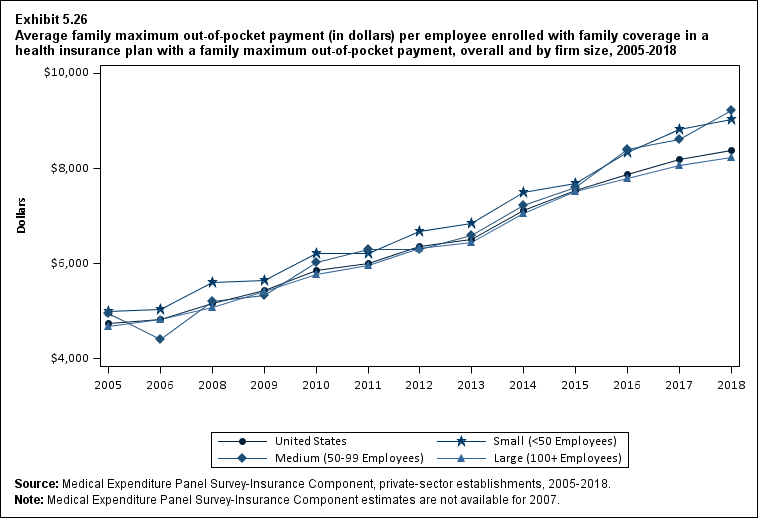
There was also no significant change in average deductible levels among single- and family-coverage enrollees in a plan with a deductible from 2017 to 2018, making 2018 the first year without a significant increase in the 2005 to 2018 period (Figure ES.17). Among enrollees with deductibles, average individual deductibles in 2018 were higher in small ($2,327) and medium ($2,369) firms than in large firms ($1,692) (Figure ES.17). Family deductibles in 2018 were higher in medium firms ($4,755) than in small firms ($4,364) and both were higher than in large firms ($3,179) (Section 5, Exhibit 5.3).
Return to Table of Contents
Exhibit ES.17 Average individual deductible (in dollars) (standard error) per employee enrolled with single coverage in a health insurance plan with a deductible, overall and by firm size, 2005‑2018
| Number of Employees |
2005 |
2006 |
2008 |
2009 |
2010 |
2011 |
2012 |
2013 |
2014 |
2015 |
2016 |
2017 |
2018 |
| U.S. |
$652 |
$714 |
$869 |
$917 |
$1,025 |
$1,123 |
$1,167 |
$1,273 |
$1,353 |
$1,541 |
$1,696 |
$1,808 |
$1,846 |
| (Standard Error) |
($11) |
($9) |
($7) |
($9) |
($18) |
($12) |
($8) |
($20) |
($13) |
($16) |
($16) |
($17) |
($17) |
| <50 |
$929 |
$1,007 |
$1,177 |
$1,283 |
$1,447 |
$1,561 |
$1,628 |
$1,695 |
$1,777 |
$1,964 |
$2,105 |
$2,136 |
$2,327 |
| (Standard Error) |
($20) |
($20) |
($13) |
($24) |
($21) |
($26) |
($25) |
($24) |
($28) |
($35) |
($34) |
($35) |
($36) |
| 50-99 |
$836 |
$855 |
$1,149 |
$1,249 |
$1,522 |
$1,543 |
$1,622 |
$1,755 |
$1,744 |
$2,008 |
$2,173 |
$2,361 |
$2,369 |
| (Standard Error) |
($67) |
($71) |
($62) |
($46) |
($57) |
($49) |
($64) |
($49) |
($59) |
($62) |
($64) |
($85) |
($65) |
| 100+ |
$539 |
$605 |
$740 |
$774 |
$852 |
$951 |
$989 |
$1,106 |
$1,205 |
$1,383 |
$1,558 |
$1,681 |
$1,692 |
| (Standard Error) |
($9) |
($12) |
($8) |
($7) |
($20) |
($14) |
($10) |
($19) |
($14) |
($18) |
($18) |
($20) |
($19) |
|
Source: Medical Expenditure Panel Survey-Insurance Component, private-sector establishments, 2005‑2018.
Note: Medical Expenditure Panel Survey-Insurance Component estimates are not available for 2007. In 2015, the methodology for calibrating the upper edit bound for the individual deductible amount changed,
causing the average individual deductible per employee enrolled with single coverage in a health insurance plan with a deductible to increase by about 5 percent at the national level in 2015 relative to the earlier methodology.
|
Conclusion
AHRQ produces this chartbook to make MEPS-IC data more readily usable by providing trends nationally and by firm size, by presenting national and State-level estimates in one document, and by providing additional firm-size cuts relevant to recent policy changes.
More information is available at meps.ahrq.gov.
AHRQ welcomes feedback on additional ways to make the data more usable to the public.
Return to Table of Contents
Availability of Coverage to Active Employees and Retirees
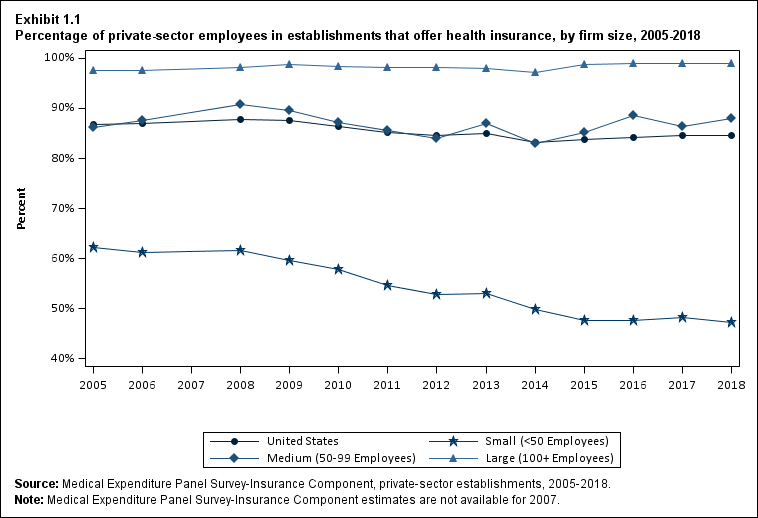
In 2018, almost all private-sector employees (99.0 percent) in firms with 100 or more employees worked at establishments that offered health insurance. In comparison, about half (47.3 percent) of employees at firms with fewer than 50 employees worked where health insurance was offered (Exhibit 1.1).
Historically, smaller employers have been less likely to offer health insurance coverage than larger employers for a number of reasons, including:
- Smaller risk pools, which result in higher premium costs (holding benefits constant),
- Higher administrative costs, and
- Lack of dedicated staff to select and administer health benefits.
This section presents estimates of the percentage of employees who work where coverage is offered (the "offer rate"). It also provides information on the characteristics of offered coverage, including the availability of dependent coverage, choice of plans, and retiree coverage. In addition, this section presents estimates of the percentage of offering establishments that self-insure at least one plan.
Offer Rates Overall and by Firm Size
- There was no significant change in the overall percentage of employees working at establishments where insurance was offered ("the offer rate") between 2017 (84.5 percent) and 2018 (84.6 percent) (Exhibit 1.1).
- There was no significant change in the offer rate at small employers (fewer than 50 employees) between 2017 (48.3 percent) and 2018 (47.3 percent). There was also no significant year-to-year change in offer rates at medium employers (50 to 99 employees) or at large firms (100 or more employees) (Exhibit 1.1).
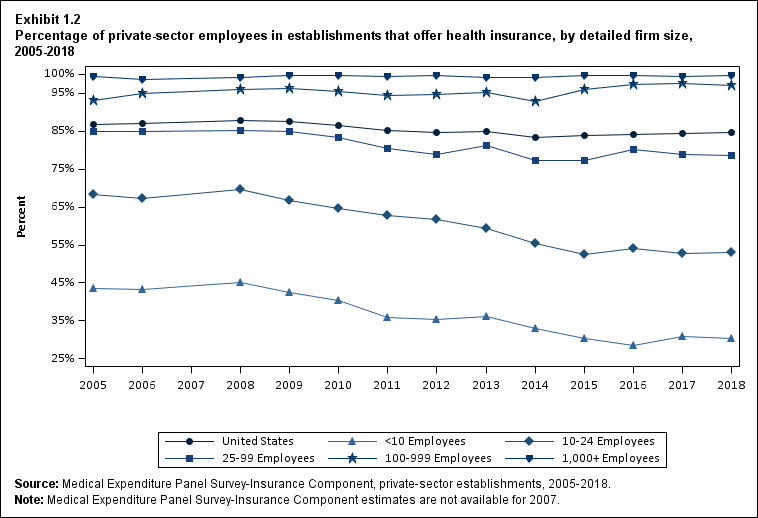
- The only significant change in offer rates by detailed firm size categories was for firms with 1,000 or more employees. For employees of such firms, the offer rate increased from 99.5 percent in 2017 to 99.8 percent in 2018 (Exhibit 1.2).
Offer Rates by State
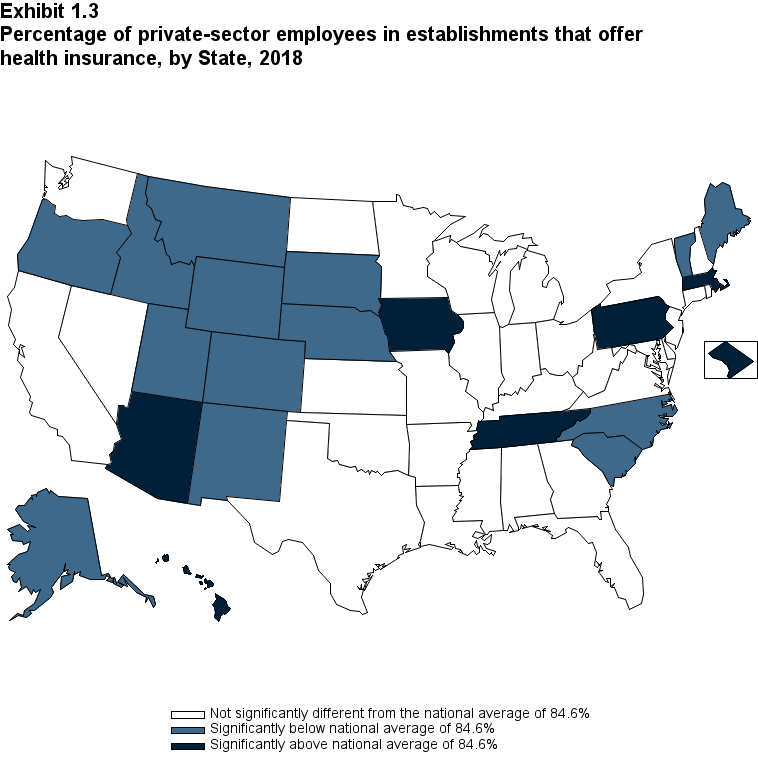
- Nationwide, 84.6 percent of all private-sector employees worked at establishments that offered insurance in 2018. The availability of workplace coverage varied substantially across the country (Exhibit 1.3). This variation was driven in part by differences in the distribution of workers by employer size across States (data not shown) and by differences across States in offer rates at smaller employers (Exhibit 1.4).
- States with offer rates exceeding the national average were Arizona, District of Columbia, Hawaii, Iowa, Massachusetts, Pennsylvania, and Tennessee (Exhibit 1.3).
- States with offer rates below the national average in 2018 were Alaska, Colorado, Idaho, Maine, Montana, Nebraska, New Mexico, North Carolina, Oregon, South Carolina, South Dakota, Utah, Vermont, and Wyoming (Exhibit 1.3).
Offer Rates at Small Employers, by State
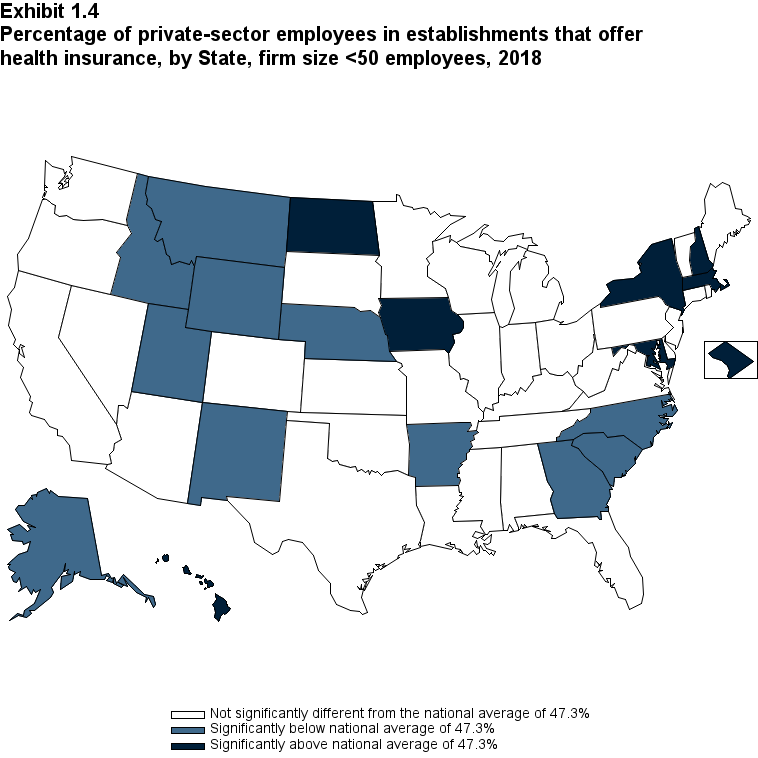
- Nationwide, less than half (47.3 percent) of employees of small firms (fewer than 50 employees) worked at establishments that offered insurance in 2018. However, the availability of workplace coverage at small firms varied substantially across the country (Exhibit 1.4).
- States with small-employer offer rates exceeding the national average were the District of Columbia, Hawaii, Iowa, Maryland, Massachusetts, New Hampshire, New York, and North Dakota (Exhibit 1.4).
- States with small-employer offer rates below the national average were Alaska, Arkansas, Georgia, Idaho, Montana, Nebraska, New Mexico, North Carolina, South Carolina, Utah, and Wyoming (Exhibit 1.4).
Offer Rates at Employers That Are Predominantly Low Wage vs. Higher Wage Establishments, by Firm Size
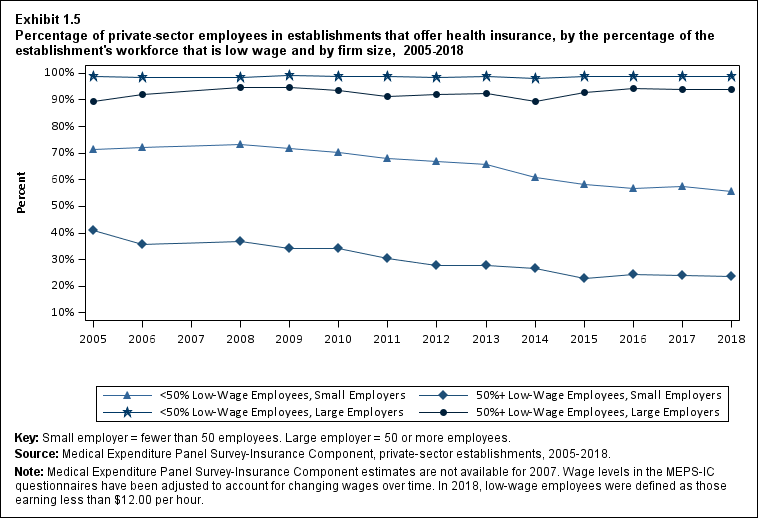
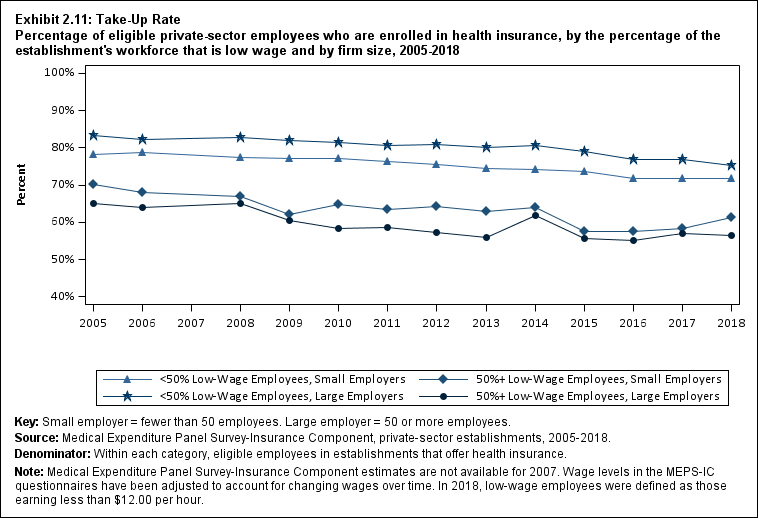
- In 2018, workers at predominantly low-wage small employers (fewer than 50 employees) faced offer rates that were less than half the rate at small employers with higher wages (23.6 percent vs. 55.5 percent) (Exhibit 1.5). (Predominantly low-wage establishments are defined as those where 50 percent or more of an establishment's workforce were low wage. Wage levels used in the question about the wage distribution in the MEPS-IC questionnaire have been adjusted to account for changing wages over time. In 2018, low-wage employees were defined as those earning less than $12.00 per hour.)
- Among the four subgroups of establishments jointly defined by firm size and wage level, the only significant change in offer rates occurred at small employers with higher wages (establishments that were not predominantly low wage). The offer rate at such employers declined from 57.6 percent in 2017 to 55.5 percent in 2018 (Exhibit 1.5).
Offer Rates by Industry
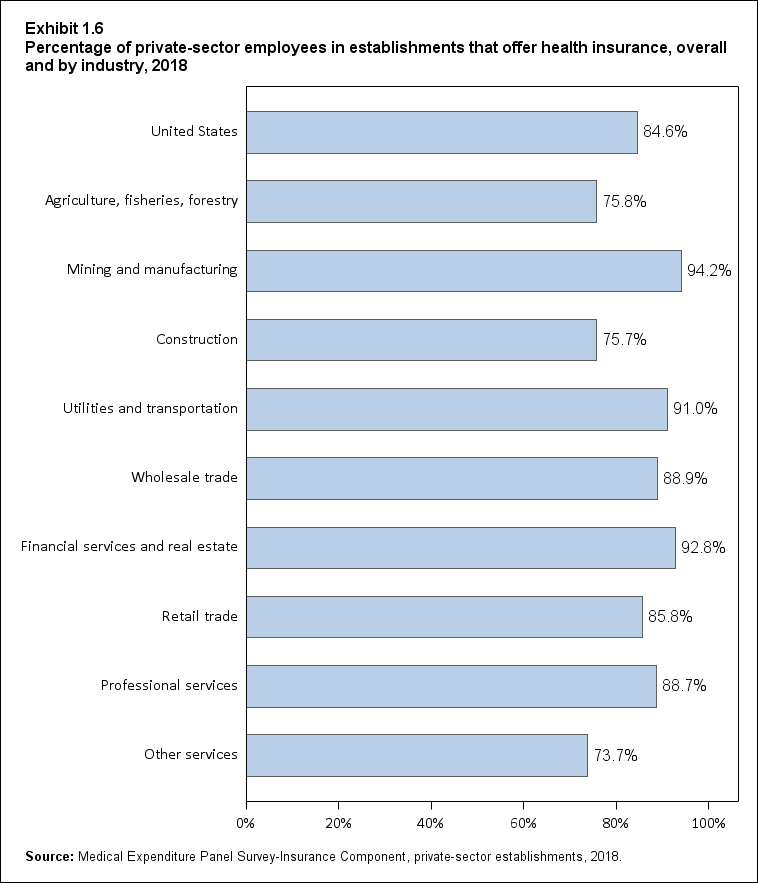
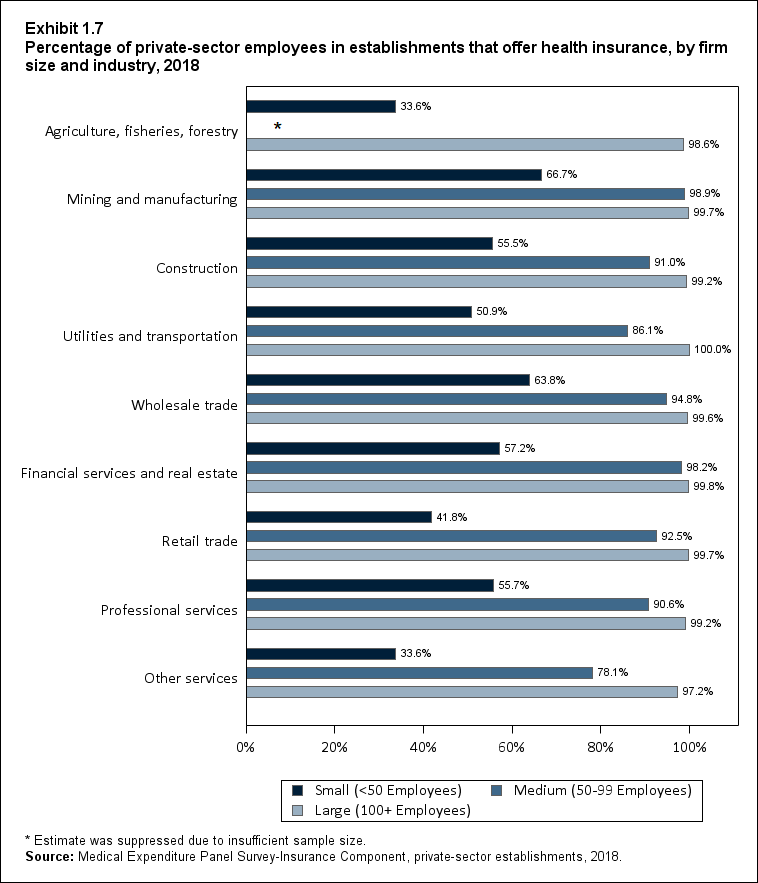
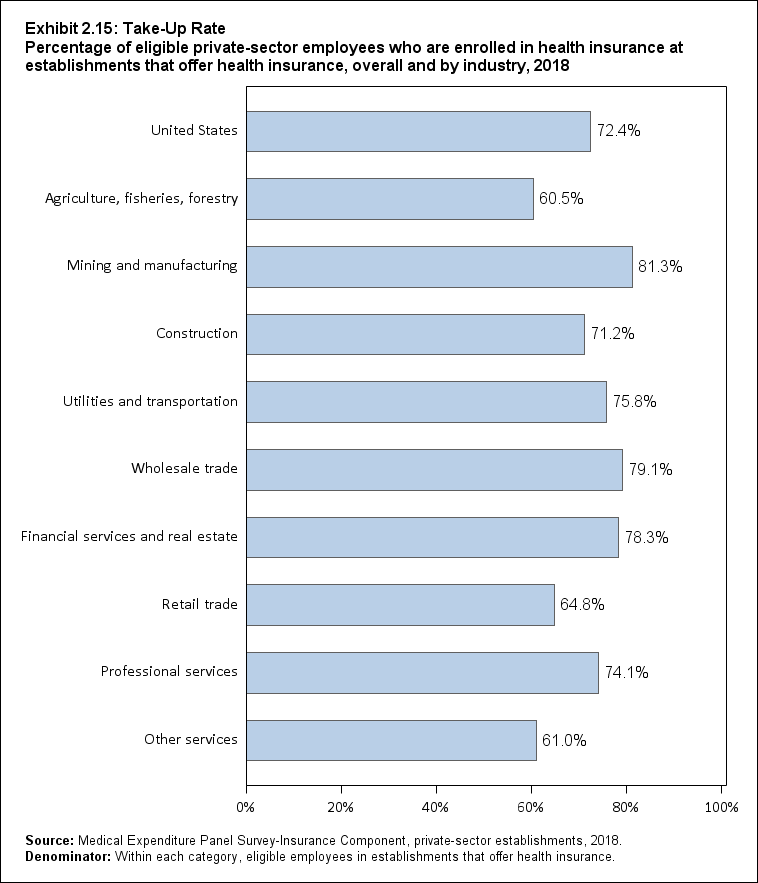
- In 2018, workers in mining and manufacturing had the highest likelihood of working where health insurance was offered (94.2 percent) while workers in the agriculture, fisheries, and forestry sector (75.8 percent), construction (75.7 percent), and other services (73.7 percent) had the lowest offer rates among all industry sectors (Exhibit 1.6).
- Among workers at small firms (fewer than 50 employees), those employed in mining and manufacturing (66.7 percent) or wholesale trade (63.8 percent) had the highest likelihood of working where health insurance was offered (p <0.10 for the difference between wholesale trade and the financial services and real estate sector). Those employed in the agriculture, fisheries, and forestry sector and in other services had the lowest likelihood (33.6 percent), although there was no significant difference between the agriculture, fisheries, and forestry sector and the retail trade sector (Exhibit 1.7).
Offer Rates by Selected Employer Characteristics
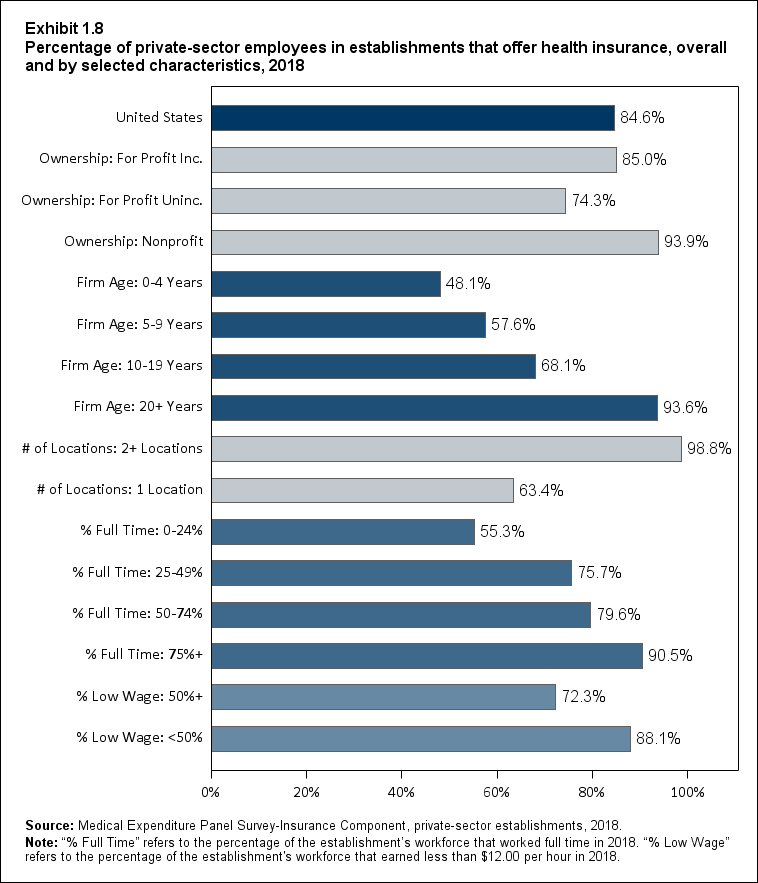
- Workers at nonprofit employers were more likely to work where health insurance was offered (93.9 percent) than workers at for-profit employers. Among for-profit employers, the offer rate was higher at incorporated employers (85.0 percent) than at unincorporated employers (74.3 percent) (Exhibit 1.8).
- Offer rates increased with the firm's age, from 48.1 percent at firms 0 to 4 years old to 57.6 percent, 68.1 percent, and 93.6 percent for firms ages 5-9 years, 10-19 years, and 20 or more years, respectively (Exhibit 1.8).
- Workers at establishments that were part of firms with two or more locations had higher offer rates than those with only one location (98.8 percent vs. 63.4 percent) (Exhibit 1.8).
- Offer rates increased with the percentage of workers at the establishment who worked full time. Workers at establishments where 75 percent or more of the employees worked full time had an offer rate of 90.5 percent, compared with 79.6 percent, 75.7 percent, and 55.3 percent for workers at establishments with 50 to 74 percent, 25 to 49 percent, and 0 to 24 percent full-time employees, respectively (Exhibit 1.8).
- Employees in higher wage establishments were more likely to work where health insurance was offered than those in predominantly low-wage establishments (88.1 percent vs. 72.3 percent) (Exhibit 1.8).
Offer Rates by Selected Employer Characteristics and Firm Size
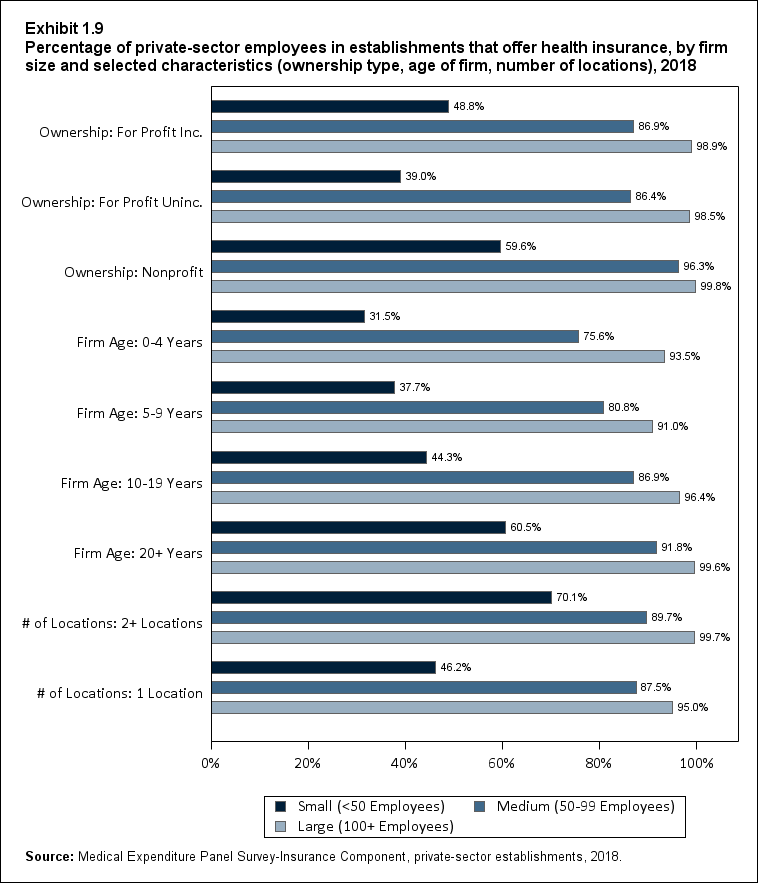
- Among large firms (100 or more employees), employees who worked at an employer that had been in business fewer than 20 years were less likely to be offered health insurance than employees at older firms. Offer rates ranged from 91.0 percent to 96.4 percent at employers in business fewer than 20 years versus 99.6 percent for employers in business 20 years or more (Exhibit 1.9).
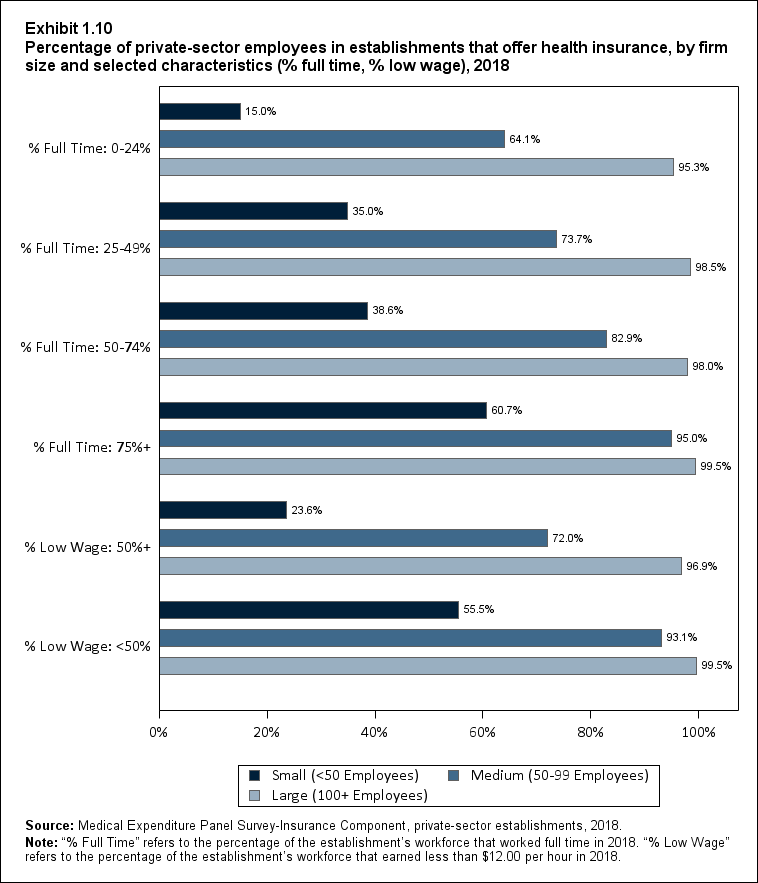
- Also among large firms, the offer rate was lower for employers with 0 to 24 percent full-time workers (95.3 percent) compared with those with a higher percentage of full-time workers (ranging from 98.0 percent to 99.5 percent at employers with 25 percent or more full-time workers) (Exhibit 1.10).
- Overall, 47.3 percent of workers in establishments that were part of firms with fewer than 50 workers were offered coverage in 2018 (Exhibit 1.1). However, there was substantial variation by establishment characteristics. Compared with other categories (e.g., for profit, only one location), offer rates were notably higher for small employers that:
- Were nonprofit (59.6 percent).
- Were in business for 20 or more years (60.5 percent).
- Had more than one location (70.1 percent).
- Had workforces with 75 percent or more of employees working full time (60.7 percent).
- Had workforces that were not predominantly low wage (55.5 percent) (Exhibits 1.9 and 1.10).
- Offer rates were lower for workers in predominantly low-wage establishments than in higher wage establishments, regardless of whether they worked at a firm with fewer than 50 workers (23.6 percent vs. 55.5 percent), 50 to 99 workers (72.0 percent vs. 93.1 percent), or 100 or more workers (96.9 percent vs. 99.5 percent) (Exhibit 1.10).
Availability of Self-Insured Plans
- Among employers that offered insurance, 12.9 percent to 13.8 percent of establishments in the three firm size categories with fewer than 100 workers self-insured at least one plan in 2018. By contrast, 35.1 percent and 81.6 percent of offering establishments in firms with 100 to 999 and 1,000 or more employees, respectively, self-insured at least one plan. There were similar differences by firm size in the percentage of eligible employees who worked for an employer that self-insured at least one plan (Exhibits 1.11 and 1.12).
- Between 2017 and 2018, there was no significant change in the overall percentage of offering establishments that self-insured at least one plan, but this percentage declined at establishments in firms with fewer than 10 employees (from 17.7 percent to 13.1 percent) and with 25 to 99 employees (from 16.0 percent to 12.9 percent). The percentage increased at establishments in firms with 1,000 or more employees (from 78.6 percent to 81.6 percent) (Exhibit 1.11).
- Among employers who offered insurance, there was no significant change from 2017 to 2018 in the overall percentage of eligible employees who worked for an employer that self-insured at least one plan (56.8 percent in 2018). However, employers with fewer than 10 workers and those with 100 to 999 workers both experienced a decrease in this measure from 2017 to 2018 (p <0.10 for employers with fewer than 10 workers) (Exhibit 1.12).
Availability of Dependent Coverage
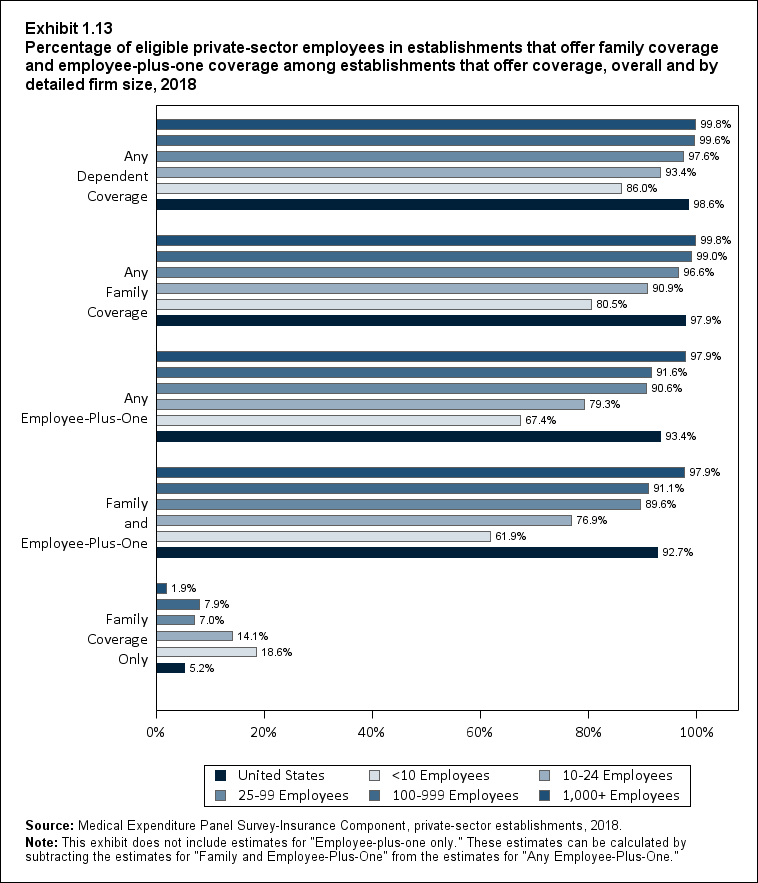
- In 2018, 98.6 percent of all workers who were eligible for single coverage were also offered coverage for their dependents (Exhibit 1.13). The likelihood of a dependent coverage offer increased with firm size, except that rates were similar for the two largest firm size groups. In 2018, the percentage of eligible employees who were offered coverage for their dependents was:
- 86.0 percent in firms with fewer than 10 employees,
- 93.4 percent in firms with 10 to 24 employees
- 97.6 percent in firms with 25 to 99 employees,
- 99.6 percent in firms with 100 to 999 employees, and
- 99.8 percent in firms with 1,000 or more employees.
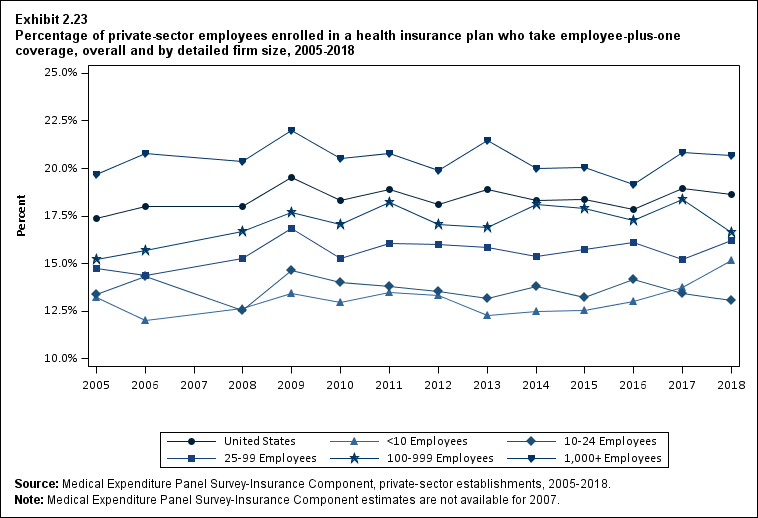
- In 2018, 93.4 percent of all eligible workers were offered employee-plus-one coverage as an option in addition to an offer of single coverage (Exhibit 1.13). The likelihood of employee-plus-one coverage as an option increased with firm size (except that rates were similar for firms with 25 to 99 and 100 to 999 employees). In 2018, the percentage of eligible workers with an offer of employee-plus-one coverage was:
- 67.4 percent in firms with fewer than 10 employees,
- 79.3 percent in firms with 10 to 24 employees,
- 90.6 percent in firms with 25 to 99 employees,
- 91.6 percent in firms with 100 to 999 employees, and
- 97.9 percent in firms with 1,000 or more employees.
Availability of a Choice of Plans at Employers That Offer Health Insurance, by Firm Size
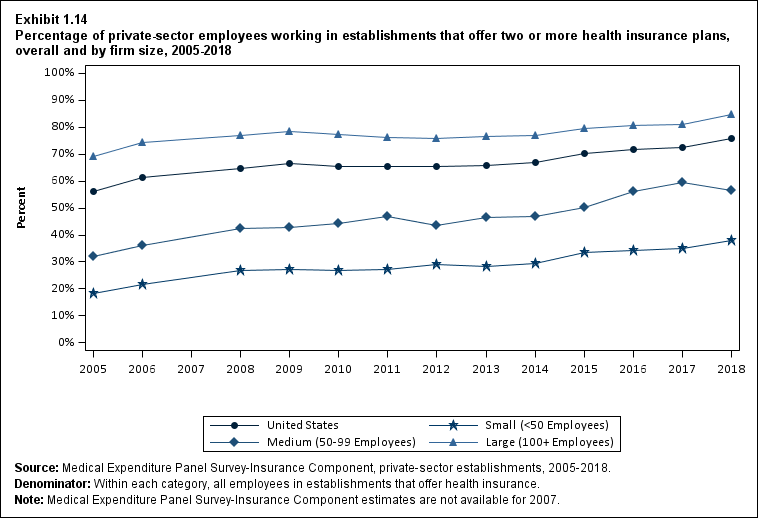
- The likelihood that a worker at an offering establishment had a choice of plans increased with firm size in all years from 2005 to 2018. In 2018, the percentage of workers with a choice of plans was 37.8 percent in firms with fewer than 50 employees, 56.4 percent in firms with 50 to 99 employees, and 84.7 percent in firms with 100 or more workers (Exhibit 1.14).
- The percentage of employees with a choice of plans increased from 72.4 percent in 2017 to 75.7 percent in 2018. From 2017 to 2018, employees at both large (100 or more employees) and small (fewer than 50 employees) firms experienced an increase in the likelihood of having a choice of plans (Exhibit 1.14).
- The availability of plan choice was significantly higher in 2018 than in 2005 for small employers (37.8 percent vs. 18.2 percent), medium employers (56.4 percent vs. 32.1 percent), and large employers (84.7 percent vs. 69.0 percent) (Exhibit 1.14).
Availability of a Choice of Plans at Employers That Offer Health Insurance, by Industry and Selected Employer Characteristics
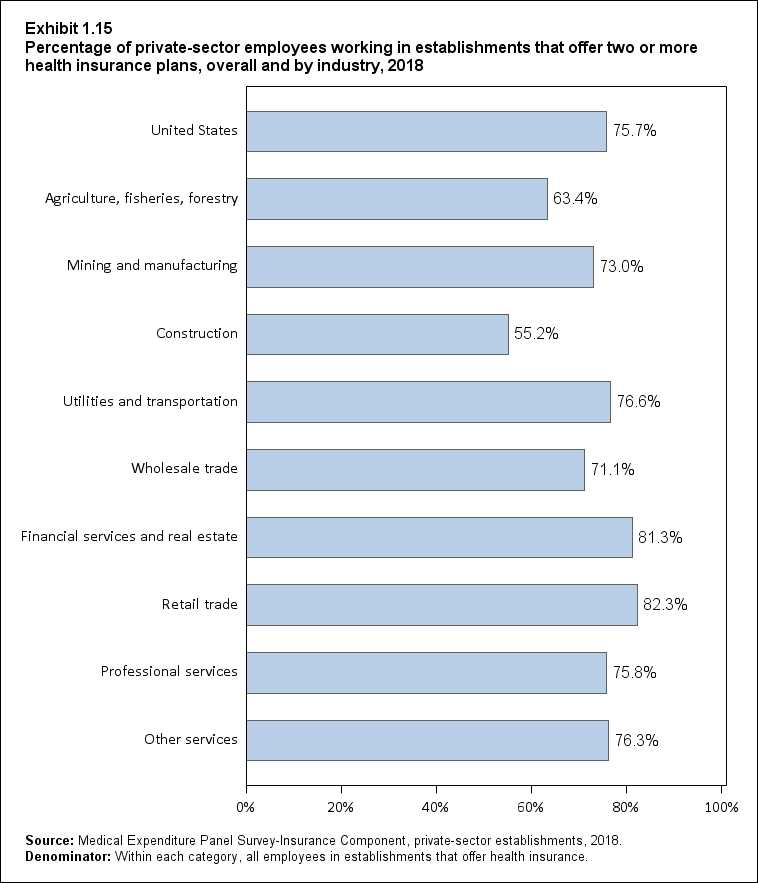
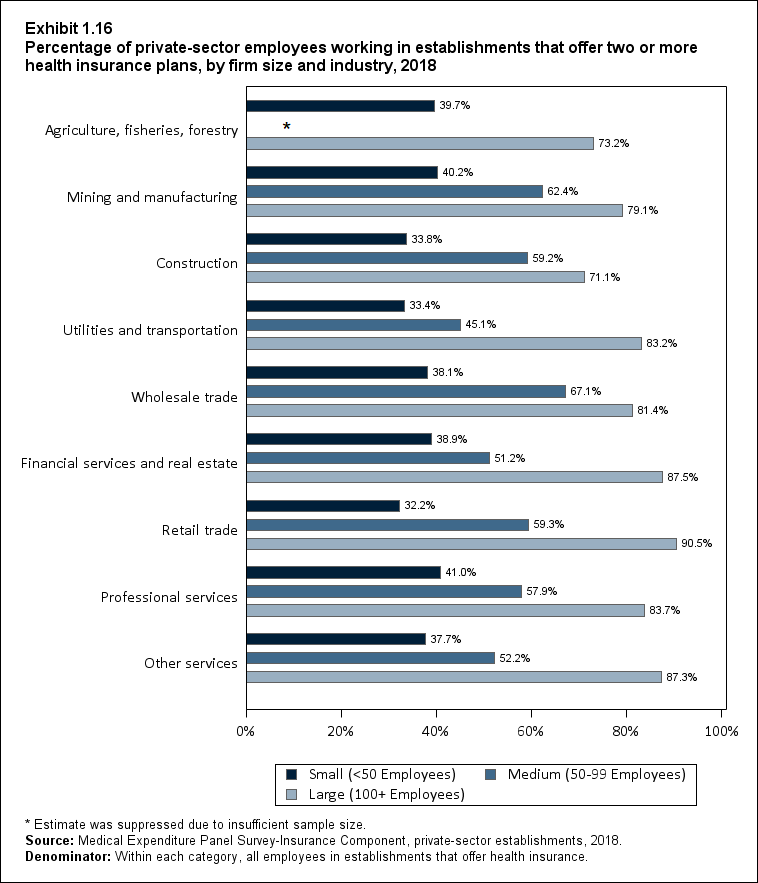
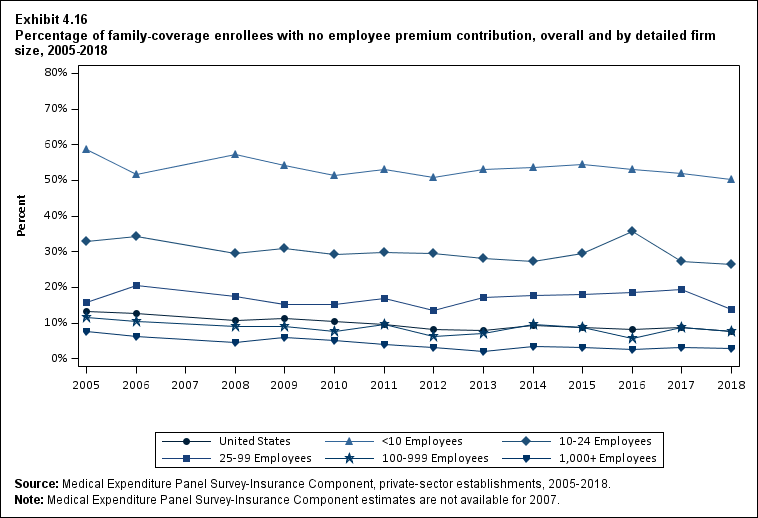
- Workers in financial services and real estate (81.3 percent) and in retail trade (82.3 percent) were more likely to be offered a choice of plans than workers in almost all other industries (there was no significant difference between the financial services and real estate sector and the utilities and transportation sector) (Exhibit 1.15). Exhibit 1.16 shows variation by industry and firm size.
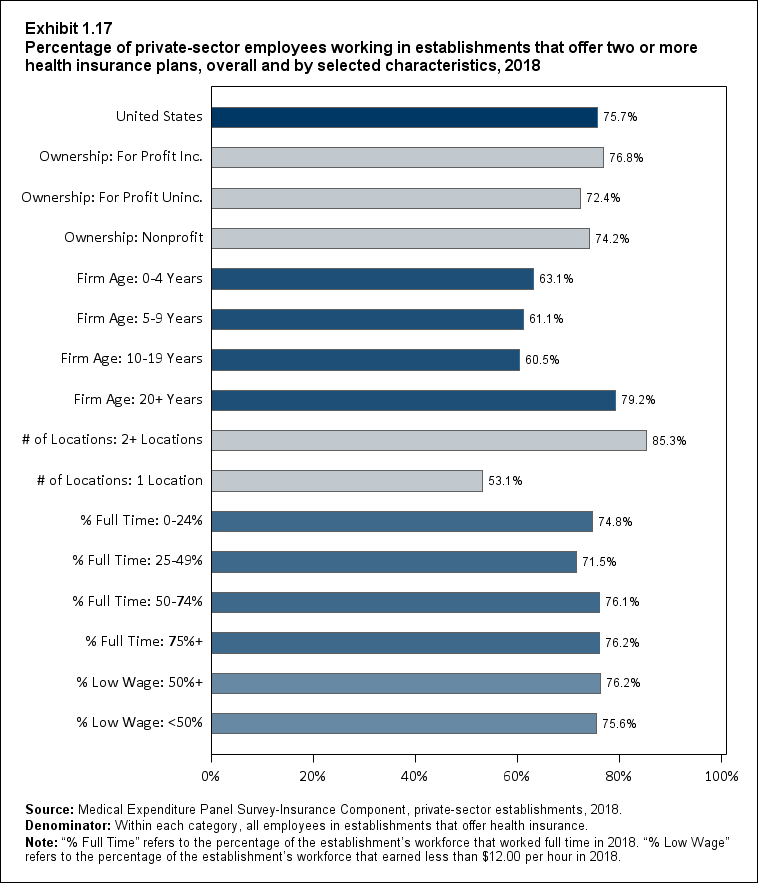
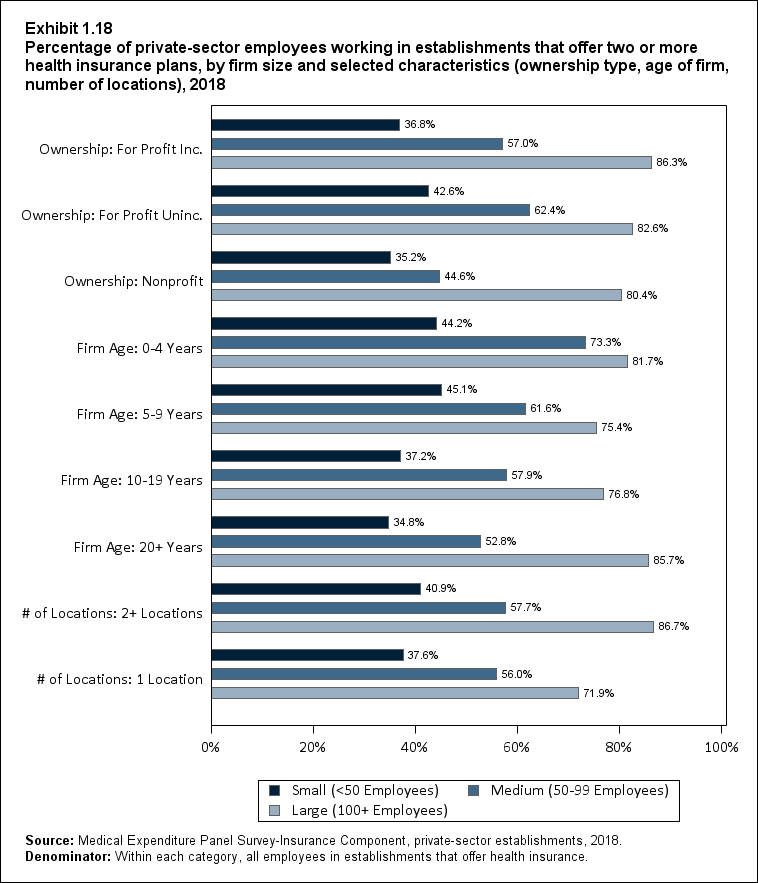
- Workers at for-profit, unincorporated employers were less likely to be offered a choice of plans than workers at for-profit incorporated employers (72.4 percent vs. 76.8 percent) (Exhibit 1.17). Exhibit 1.18 shows variation by ownership and firm size.
- Workers in firms in business for 20 or more years were more likely to be offered a choice of plans (79.2 percent) than employees at younger firms (63.1 percent, 61.1 percent, and 60.5 percent at firms in business for 0 to 4, 5 to 9, and 10 to 19 years, respectively) (Exhibit 1.17).
- Workers at establishments that were part of firms with two or more locations were more likely to be offered a choice of plans than those at firms with only one location (85.3 percent vs. 53.1 percent) (Exhibit 1.17).
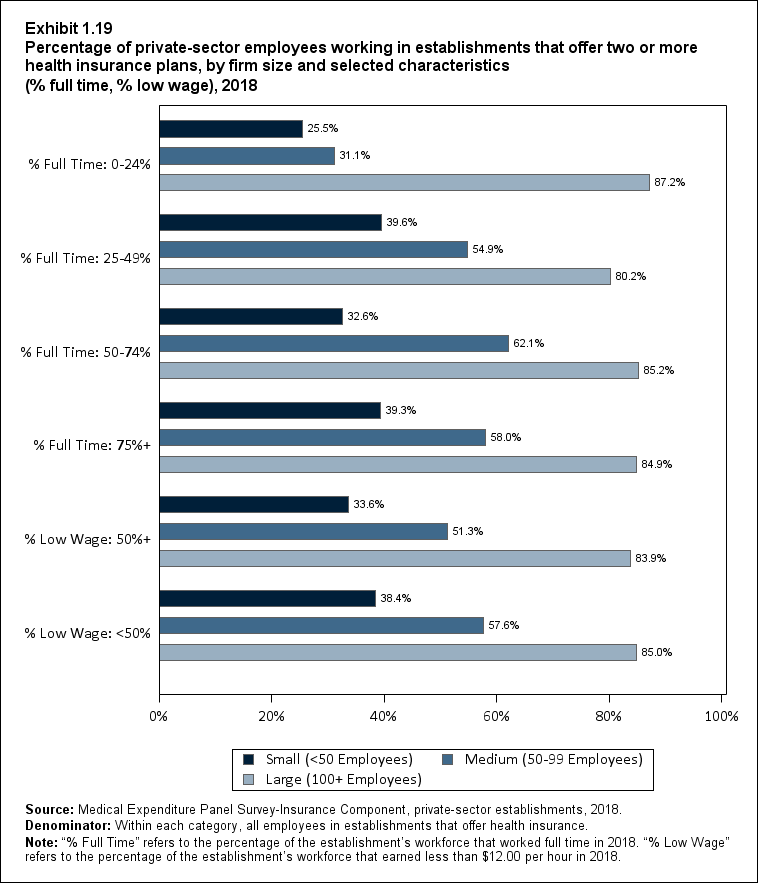
- Workers at establishments where 25 to 49 percent of employees worked full time were less likely to be offered a choice of plans than workers at establishments with a higher percentage of employees working full time (p <0.10 for the comparison with 50 to 74 percent of employees working full time) (Exhibit 1.17).
- Overall, there was no significant difference in the availability of a choice of plans by whether or not employees work in predominantly low-wage establishments (Exhibit 1.17). There was also no significant difference by wages in small, medium, and large firms (Exhibit 1.19).
Availability of Retiree Coverage at Establishments That Offer Coverage
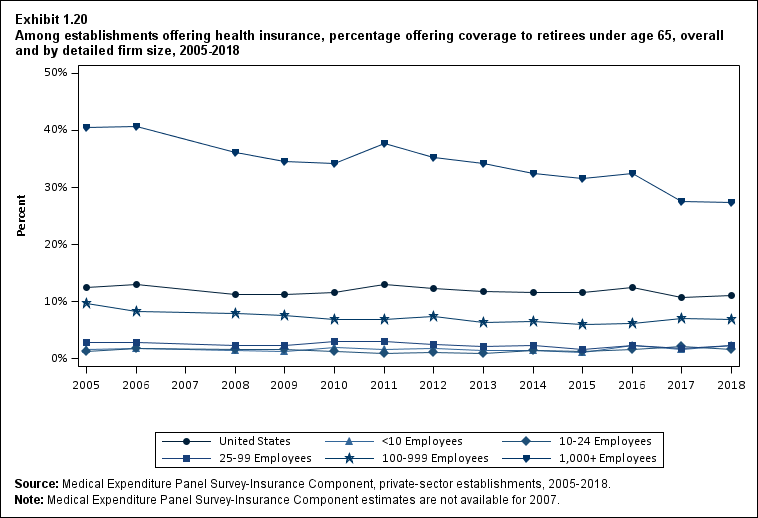
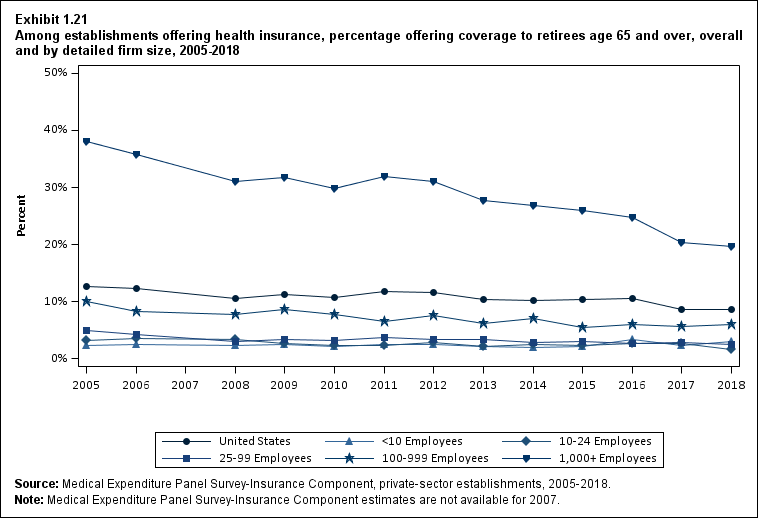
- In 2018, workers who retired from establishments that were part of the largest employers that offered employees insurance (1,000 or more workers) were the most likely to be offered retiree coverage. In 2018, 27.4 percent of these establishments offered coverage to retirees under age 65 (Exhibit 1.20). A smaller percentage, 19.7 percent in 2018, offered coverage to retirees age 65 and over (Exhibit 1.21).
- In contrast to the largest employers that offered employees insurance, in 2018, between 1.5 percent and 6.8 percent of their counterparts in all other size categories (fewer than 10, 10 to 24, 25 to 99, and 100 to 999 workers) offered retiree coverage to retirees under age 65 or age 65 and over (Exhibits 1.20 and 1.21).
- Among establishments that offered insurance to employees, there were no significant changes in the rate of offers of retiree coverage between 2017 and 2018, overall or in any firm size category (Exhibits 1.20 and 1.21).
- Between 2005 and 2018, the availability of retiree coverage in the largest firms declined by 13.1 percentage points for retirees under age 65, from 40.5 percent in 2005 to 27.4 percent in 2018. The rate for retirees age 65 and over declined by 18.4 percentage points, from 38.1 percent in 2005 to 19.7 percent in 2018 (Exhibits 1.20 and 1.21).
Return to Table of Contents
Exhibit 1.1 Percentage (standard error) of private-sector employees in establishments that offer health insurance, by firm size, 2005‑2018
| Number of Employees |
2005 |
2006 |
2008 |
2009 |
2010 |
2011 |
2012 |
2013 |
2014 |
2015 |
2016 |
2017 |
2018 |
| U.S. |
86.9% |
86.9% |
87.7% |
87.6% |
86.5% |
85.3% |
84.7% |
84.9% |
83.2% |
83.8% |
84.3% |
84.5% |
84.6% |
| (Standard Error) |
(0.5%) |
(0.2%) |
(0.3%) |
(0.2%) |
(0.2%) |
(0.2%) |
(0.3%) |
(0.3%) |
(0.3%) |
(0.2%) |
(0.2%) |
(0.2%) |
(0.2%) |
| <50 |
62.2% |
61.2% |
61.6% |
59.6% |
57.8% |
54.7% |
52.9% |
53.1% |
49.8% |
47.6% |
47.7% |
48.3% |
47.3% |
| (Standard Error) |
(0.6%) |
(0.4%) |
(0.5%) |
(0.5%) |
(0.5%) |
(0.4%) |
(0.6%) |
(0.7%) |
(0.6%) |
(0.6%) |
(0.6%) |
(0.6%) |
(0.6%) |
| 50-99 |
86.2% |
87.6% |
90.7% |
89.6% |
87.3% |
85.6% |
84.1% |
87.0% |
83.0% |
85.3% |
88.6% |
86.3% |
88.0% |
| (Standard Error) |
(1.7%) |
(1.2%) |
(0.9%) |
(1.3%) |
(0.9%) |
(1.0%) |
(1.4%) |
(1.0%) |
(1.3%) |
(1.2%) |
(1.0%) |
(1.2%) |
(1.1%) |
| 100+ |
97.5% |
97.7% |
98.2% |
98.8% |
98.5% |
98.1% |
98.2% |
98.0% |
97.3% |
98.8% |
98.9% |
98.9% |
99.0% |
| (Standard Error) |
(0.7%) |
(0.4%) |
(0.3%) |
(0.1%) |
(0.2%) |
(0.2%) |
(0.2%) |
(0.2%) |
(0.2%) |
(0.2%) |
(0.1%) |
(0.2%) |
(0.2%) |
|
Source: Medical Expenditure Panel Survey-Insurance Component, private-sector establishments, 2005‑2018.
Note: Medical Expenditure Panel Survey-Insurance Component estimates are not available for 2007.
|
Return to Table of Contents
Exhibit 1.2 Percentage (standard error) of private-sector employees in establishments that offer health insurance, by detailed firm size, 2005‑2018
| Number of Employees |
2005 |
2006 |
2008 |
2009 |
2010 |
2011 |
2012 |
2013 |
2014 |
2015 |
2016 |
2017 |
2018 |
| U.S. |
86.9% |
86.9% |
87.7% |
87.6% |
86.5% |
85.3% |
84.7% |
84.9% |
83.2% |
83.8% |
84.3% |
84.5% |
84.6% |
| (Standard Error) |
(0.5%) |
(0.2%) |
(0.3%) |
(0.2%) |
(0.2%) |
(0.2%) |
(0.3%) |
(0.3%) |
(0.3%) |
(0.2%) |
(0.2%) |
(0.2%) |
(0.2%) |
| <10 |
43.7% |
43.3% |
45.0% |
42.5% |
40.5% |
36.0% |
35.3% |
36.2% |
32.9% |
30.4% |
28.4% |
30.8% |
30.4% |
| (Standard Error) |
(0.5%) |
(0.9%) |
(0.7%) |
(0.6%) |
(0.6%) |
(0.6%) |
(0.5%) |
(0.7%) |
(0.7%) |
(0.7%) |
(0.8%) |
(0.8%) |
(0.8%) |
| 10-24 |
68.2% |
67.4% |
69.5% |
66.6% |
64.7% |
62.7% |
61.7% |
59.3% |
55.5% |
52.6% |
54.0% |
52.8% |
53.0% |
| (Standard Error) |
(1.8%) |
(1.2%) |
(0.8%) |
(1.0%) |
(1.2%) |
(0.9%) |
(1.1%) |
(0.6%) |
(1.1%) |
(1.2%) |
(1.2%) |
(1.2%) |
(1.2%) |
| 25-99 |
85.0% |
85.0% |
85.3% |
85.0% |
83.3% |
80.6% |
78.9% |
81.2% |
77.2% |
77.3% |
80.1% |
78.9% |
78.6% |
| (Standard Error) |
(1.1%) |
(0.8%) |
(1.0%) |
(0.7%) |
(0.6%) |
(0.9%) |
(0.7%) |
(0.9%) |
(0.9%) |
(1.0%) |
(0.8%) |
(0.9%) |
(0.8%) |
| 100-999 |
93.0% |
95.1% |
95.9% |
96.3% |
95.4% |
94.4% |
94.6% |
95.2% |
92.7% |
96.1% |
97.3% |
97.5% |
97.0% |
| (Standard Error) |
(2.2%) |
(1.0%) |
(0.7%) |
(0.5%) |
(0.5%) |
(0.6%) |
(0.7%) |
(0.4%) |
(0.7%) |
(0.5%) |
(0.5%) |
(0.4%) |
(0.6%) |
| 1,000+ |
99.4% |
98.7% |
99.0% |
99.7% |
99.6% |
99.5% |
99.6% |
99.1% |
99.1% |
99.8% |
99.6% |
99.5% |
99.8% |
| (Standard Error) |
(0.2%) |
(0.3%) |
(0.4%) |
(0.1%) |
(0.1%) |
(0.1%) |
(0.1%) |
(0.3%) |
(0.2%) |
(0.1%) |
(0.1%) |
(0.1%) |
(0.1%) |
|
Source: Medical Expenditure Panel Survey-Insurance Component, private-sector establishments, 2005‑2018.
Note: Medical Expenditure Panel Survey-Insurance Component estimates are not available for 2007.
|
Return to Table of Contents
Exhibit 1.3 Percentage (standard error) of private-sector employees in establishments that offer health insurance, by State, 2018
| Alabama |
86.8% |
Kentucky |
86.2% |
North Dakota |
83.8% |
| (Standard Error) |
(1.4%) |
(Standard Error) |
(1.5%) |
(Standard Error) |
(1.5%) |
| Alaska |
74.6%* |
Louisiana |
83.0% |
Ohio |
86.3% |
| (Standard Error) |
(1.8%) |
(Standard Error) |
(2.3%) |
(Standard Error) |
(1.1%) |
| Arizona |
87.5%* |
Maine |
78.7%* |
Oklahoma |
84.2% |
| (Standard Error) |
(1.3%) |
(Standard Error) |
(2.2%) |
(Standard Error) |
(1.5%) |
| Arkansas |
81.4% |
Maryland |
86.1% |
Oregon |
81.0%* |
| (Standard Error) |
(1.7%) |
(Standard Error) |
(1.7%) |
(Standard Error) |
(1.7%) |
| California |
85.8% |
Massachusetts |
88.6%* |
Pennsylvania |
87.0%* |
| (Standard Error) |
(0.8%) |
(Standard Error) |
(1.2%) |
(Standard Error) |
(0.9%) |
| Colorado |
80.8%* |
Michigan |
85.2% |
Rhode Island |
82.5% |
| (Standard Error) |
(1.8%) |
(Standard Error) |
(1.3%) |
(Standard Error) |
(1.8%) |
| Connecticut |
85.8% |
Minnesota |
84.2% |
South Carolina |
80.1%* |
| (Standard Error) |
(1.4%) |
(Standard Error) |
(1.3%) |
(Standard Error) |
(1.6%) |
| Delaware |
82.2% |
Mississippi |
84.8% |
South Dakota |
78.2%* |
| (Standard Error) |
(1.8%) |
(Standard Error) |
(1.7%) |
(Standard Error) |
(2.6%) |
| District of Columbia |
93.6%* |
Missouri |
84.8% |
Tennessee |
87.3%* |
| (Standard Error) |
(0.9%) |
(Standard Error) |
(1.5%) |
(Standard Error) |
(1.1%) |
| Florida |
84.9% |
Montana |
64.5%* |
Texas |
84.2% |
| (Standard Error) |
(1.2%) |
(Standard Error) |
(2.3%) |
(Standard Error) |
(1.0%) |
| Georgia |
83.5% |
Nebraska |
81.5%* |
Utah |
78.6%* |
| (Standard Error) |
(1.3%) |
(Standard Error) |
(1.5%) |
(Standard Error) |
(1.8%) |
| Hawaii |
95.8%* |
Nevada |
85.5% |
Vermont |
76.7%* |
| (Standard Error) |
(1.1%) |
(Standard Error) |
(1.6%) |
(Standard Error) |
(1.7%) |
| Idaho |
73.1%* |
New Hampshire |
85.1% |
Virginia |
84.8% |
| (Standard Error) |
(1.8%) |
(Standard Error) |
(1.4%) |
(Standard Error) |
(1.8%) |
| Illinois |
83.8% |
New Jersey |
83.5% |
Washington |
84.5% |
| (Standard Error) |
(2.1%) |
(Standard Error) |
(1.3%) |
(Standard Error) |
(1.4%) |
| Indiana |
84.2% |
New Mexico |
77.6%* |
West Virginia |
84.2% |
| (Standard Error) |
(1.5%) |
(Standard Error) |
(1.7%) |
(Standard Error) |
(1.4%) |
| Iowa |
87.0%* |
New York |
86.4% |
Wisconsin |
83.6% |
| (Standard Error) |
(1.1%) |
(Standard Error) |
(1.0%) |
(Standard Error) |
(1.3%) |
| Kansas |
85.3% |
North Carolina |
80.1%* |
Wyoming |
73.8%* |
| (Standard Error) |
(1.3%) |
(Standard Error) |
(1.3%) |
(Standard Error) |
(1.7%) |
|
Source: Medical Expenditure Panel Survey-Insurance Component, private-sector establishments, 2018.
Note: * Statistically different from the national average of 84.6 percent at p < 0.05. Note that the standard error on the national estimate of 84.6 percent is 0.24 percent.
|
Return to Table of Contents
Exhibit 1.4 Percentage (standard error) of private-sector employees in establishments that offer health insurance, by State, firm size <50 employees, 2018
| Alabama |
53.7% |
Kentucky |
50.7% |
North Dakota |
55.8%* |
| (Standard Error) |
(3.9%) |
(Standard Error) |
(3.9%) |
(Standard Error) |
(3.6%) |
| Alaska |
32.3%* |
Louisiana |
50.2% |
Ohio |
46.1% |
| (Standard Error) |
(3.8%) |
(Standard Error) |
(3.8%) |
(Standard Error) |
(3.5%) |
| Arizona |
50.0% |
Maine |
42.4% |
Oklahoma |
47.1% |
| (Standard Error) |
(3.9%) |
(Standard Error) |
(4.3%) |
(Standard Error) |
(3.9%) |
| Arkansas |
36.9%* |
Maryland |
58.4%* |
Oregon |
47.9% |
| (Standard Error) |
(3.7%) |
(Standard Error) |
(3.9%) |
(Standard Error) |
(3.5%) |
| California |
49.3% |
Massachusetts |
59.1%* |
Pennsylvania |
52.8% |
| (Standard Error) |
(2.0%) |
(Standard Error) |
(3.9%) |
(Standard Error) |
(2.9%) |
| Colorado |
43.4% |
Michigan |
48.9% |
Rhode Island |
53.8% |
| (Standard Error) |
(3.9%) |
(Standard Error) |
(3.8%) |
(Standard Error) |
(4.2%) |
| Connecticut |
53.8% |
Minnesota |
46.4% |
South Carolina |
33.3%* |
| (Standard Error) |
(3.9%) |
(Standard Error) |
(3.8%) |
(Standard Error) |
(3.4%) |
| Delaware |
45.6% |
Mississippi |
45.7% |
South Dakota |
47.2% |
| (Standard Error) |
(4.7%) |
(Standard Error) |
(4.2%) |
(Standard Error) |
(3.4%) |
| District of Columbia |
71.4%* |
Missouri |
47.7% |
Tennessee |
46.0% |
| (Standard Error) |
(4.1%) |
(Standard Error) |
(4.2%) |
(Standard Error) |
(4.1%) |
| Florida |
41.8% |
Montana |
28.9%* |
Texas |
43.1% |
| (Standard Error) |
(3.3%) |
(Standard Error) |
(3.1%) |
(Standard Error) |
(2.8%) |
| Georgia |
38.2%* |
Nebraska |
35.7%* |
Utah |
30.3%* |
| (Standard Error) |
(3.6%) |
(Standard Error) |
(3.7%) |
(Standard Error) |
(3.4%) |
| Hawaii |
87.8%* |
Nevada |
45.3% |
Vermont |
43.6% |
| (Standard Error) |
(2.7%) |
(Standard Error) |
(4.4%) |
(Standard Error) |
(3.5%) |
| Idaho |
35.4%* |
New Hampshire |
54.9%* |
Virginia |
49.4% |
| (Standard Error) |
(3.7%) |
(Standard Error) |
(3.6%) |
(Standard Error) |
(3.6%) |
| Illinois |
46.8% |
New Jersey |
49.1% |
Washington |
50.4% |
| (Standard Error) |
(4.0%) |
(Standard Error) |
(3.1%) |
(Standard Error) |
(3.8%) |
| Indiana |
45.4% |
New Mexico |
39.6%* |
West Virginia |
42.6% |
| (Standard Error) |
(3.6%) |
(Standard Error) |
(3.7%) |
(Standard Error) |
(4.0%) |
| Iowa |
56.3%* |
New York |
56.5%* |
Wisconsin |
41.7% |
| (Standard Error) |
(3.5%) |
(Standard Error) |
(3.0%) |
(Standard Error) |
(3.9%) |
| Kansas |
51.0% |
North Carolina |
32.3%* |
Wyoming |
35.3%* |
| (Standard Error) |
(3.7%) |
(Standard Error) |
(3.3%) |
(Standard Error) |
(3.1%) |
|
Source: Medical Expenditure Panel Survey-Insurance Component, private-sector establishments, 2018.
Note: * Statistically different from the national average of 47.3 percent at p < 0.05. Note that the standard error on the national estimate of 47.3 percent is 0.62 percent.
|
Return to Table of Contents
Exhibit 1.5 Percentage (standard error) of private-sector employees in establishments that offer health insurance, by the percentage of the establishment's workforce that is low wage and by firm size, 2005-2018
| Low Wage |
2005 |
2006 |
2008 |
2009 |
2010 |
2011 |
2012 |
2013 |
2014 |
2015 |
2016 |
2017 |
2018 |
| <50% Low-Wage Employees, Small Employers |
71.6% |
72.2% |
73.2% |
71.6% |
70.2% |
68.0% |
66.8% |
65.6% |
61.0% |
58.4% |
56.9% |
57.6% |
55.5% |
| (Standard Error) |
(0.7%) |
(0.4%) |
(0.5%) |
(0.5%) |
(0.5%) |
(0.4%) |
(0.3%) |
(0.6%) |
(0.7%) |
(0.7%) |
(0.7%) |
(0.7%) |
(0.7%) |
| 50%+ Low-Wage Employees, Small Employers |
41.1% |
35.8% |
36.8% |
34.3% |
34.1% |
30.6% |
28.0% |
28.0% |
26.6% |
23.1% |
24.4% |
24.2% |
23.6% |
| (Standard Error) |
(1.2%) |
(1.2%) |
(1.2%) |
(0.8%) |
(0.7%) |
(0.9%) |
(1.0%) |
(1.2%) |
(1.1%) |
(1.1%) |
(1.3%) |
(1.2%) |
(1.2%) |
| <50% Low-Wage Employees, Large Employers |
98.7% |
98.4% |
98.4% |
99.1% |
98.9% |
98.9% |
98.6% |
98.7% |
98.2% |
98.9% |
98.9% |
98.7% |
98.9% |
| (Standard Error) |
(0.3%) |
(0.2%) |
(0.4%) |
(0.2%) |
(0.2%) |
(0.2%) |
(0.1%) |
(0.1%) |
(0.2%) |
(0.1%) |
(0.2%) |
(0.2%) |
(0.1%) |
| 50%+ Low-Wage Employees, Large Employers |
89.4% |
92.1% |
94.8% |
94.7% |
93.5% |
91.4% |
92.2% |
92.4% |
89.6% |
92.7% |
94.5% |
94.0% |
94.0% |
| (Standard Error) |
(2.2%) |
(1.2%) |
(0.5%) |
(0.4%) |
(0.6%) |
(0.7%) |
(0.6%) |
(0.7%) |
(0.7%) |
(0.6%) |
(0.5%) |
(0.6%) |
(0.8%) |
|
Key: Small employers = fewer than 50 employees. Large employers = 50 or more employees.
Source: Medical Expenditure Panel Survey-Insurance Component, private-sector establishments, 2005‑2018.
Note: Medical Expenditure Panel Survey-Insurance Component estimates are not available for 2007. Wage levels in the MEPS-IC questionnaires have been adjusted to account for changing wages over time. In 2018, low-wage employees were defined as those earning less than $12.00 per hour.
|
Return to Table of Contents
Exhibit 1.6 Percentage (standard error) of private-sector employees in establishments that offer health insurance, overall and by industry, 2018
| Industry |
Percentage |
| United States |
84.6% |
| (Standard Error) |
(0.2%) |
| Agriculture, fisheries, forestry |
75.8% |
| (Standard Error) |
(4.3%) |
| Mining and manufacturing |
94.2% |
| (Standard Error) |
(0.5%) |
| Construction |
75.7% |
| (Standard Error) |
(1.4%) |
| Utilities and transportation |
91.0% |
| (Standard Error) |
(1.0%) |
| Wholesale trade |
88.9% |
| (Standard Error) |
(1.0%) |
| Financial services and real estate |
92.8% |
| (Standard Error) |
(0.5%) |
| Retail trade |
85.8% |
| (Standard Error) |
(0.8%) |
| Professional services |
88.7% |
| (Standard Error) |
(0.4%) |
| Other services |
73.7% |
| (Standard Error) |
(0.8%) |
|
Source: Medical Expenditure Panel Survey-Insurance Component, private-sector establishments, 2018.
|
Return to Table of Contents
Exhibit 1.7 Percentage (standard error) of private-sector employees in establishments that offer health insurance, by firm size and industry, 2018
| Industry |
<50 employees |
50-99 employees |
100 or more employees |
| Agriculture, fisheries, forestry |
33.6% |
* |
98.6% |
| (Standard Error) |
(5.1%) |
(*) |
(1.0%) |
| Mining and manufacturing |
66.7% |
98.9% |
99.7% |
| (Standard Error) |
(2.3%) |
(0.6%) |
(0.2%) |
| Construction |
55.5% |
91.0% |
99.2% |
| (Standard Error) |
(1.9%) |
(4.5%) |
(0.4%) |
| Utilities and transportation |
50.9% |
86.1% |
100.0% |
| (Standard Error) |
(3.9%) |
(6.1%) |
(0.0%) |
| Wholesale trade |
63.8% |
94.8% |
99.6% |
| (Standard Error) |
(2.5%) |
(3.1%) |
(0.3%) |
| Financial services and real estate |
57.2% |
98.2% |
99.8% |
| (Standard Error) |
(2.4%) |
(1.3%) |
(0.1%) |
| Retail trade |
41.8% |
92.5% |
99.7% |
| (Standard Error) |
(1.9%) |
(2.3%) |
(0.1%) |
| Professional services |
55.7% |
90.6% |
99.2% |
| (Standard Error) |
(1.2%) |
(1.7%) |
(0.2%) |
| Other services |
33.6% |
78.1% |
97.2% |
| (Standard Error) |
(1.2%) |
(2.6%) |
(0.7%) |
|
* Estimate was suppressed due to insufficient sample size.
Source: Medical Expenditure Panel Survey-Insurance Component, private-sector establishments, 2018.
|
Return to Table of Contents
Exhibit 1.8 Percentage (standard error) of private-sector employees in establishments that offer health insurance, overall and by selected characteristics, 2018
| Employer Characteristics |
Percentage |
| United States |
84.6% |
| (Standard Error) |
(0.2%) |
| Ownership: For Profit Inc. |
85.0% |
| (Standard Error) |
(0.3%) |
| Ownership: For Profit Uninc. |
74.3% |
| (Standard Error) |
(0.8%) |
| Ownership: Nonprofit |
93.9% |
| (Standard Error) |
(0.4%) |
| Firm Age: 0-4 Years |
48.1% |
| (Standard Error) |
(1.6%) |
| Firm Age: 5-9 Years |
57.6% |
| (Standard Error) |
(1.7%) |
| Firm Age: 10-19 Years |
68.1% |
| (Standard Error) |
(1.0%) |
| Firm Age: 20+ Years |
93.6% |
| (Standard Error) |
(0.2%) |
| # of Locations: 2+ Locations |
98.8% |
| (Standard Error) |
(0.1%) |
| # of Locations: 1 Location |
63.4% |
| (Standard Error) |
(0.6%) |
| % Full Time: 0-24% |
55.3% |
| (Standard Error) |
(1.5%) |
| % Full Time: 25-49% |
75.7% |
| (Standard Error) |
(1.3%) |
| % Full Time: 50-74% |
79.6% |
| (Standard Error) |
(1.0%) |
| % Full Time: 75%+ |
90.5% |
| (Standard Error) |
(0.2%) |
| % Low Wage: 50%+ |
72.3% |
| (Standard Error) |
(0.9%) |
| % Low Wage: <50% |
88.1% |
| (Standard Error) |
(0.2%) |
|
Source: Medical Expenditure Panel Survey-Insurance Component, private-sector establishments, 2018.
Note: "% Full Time" refers to the percentage of the establishment's workforce that worked full time in 2018. "% Low Wage" refers to the percentage of the establishment's workforce that earned less than $12.00 per hour in 2018.
|
Return to Table of Contents
Exhibit 1.9 Percentage (standard error) of private-sector employees in establishments that offer health insurance, by firm size and selected characteristics (ownership type, age of firm, number of locations), 2018
| Employer Characteristics |
<50 employees |
50-99 employees |
100 or more employees |
| Ownership: For Profit Inc. |
48.8% |
86.9% |
98.9% |
| (Standard Error) |
(0.8%) |
(1.4%) |
(0.2%) |
| Ownership: For Profit Uninc. |
39.0% |
86.4% |
98.5% |
| (Standard Error) |
(1.4%) |
(2.6%) |
(0.4%) |
| Ownership: Nonprofit |
59.6% |
96.3% |
99.8% |
| (Standard Error) |
(1.9%) |
(1.6%) |
(0.1%) |
| Firm Age: 0-4 Years |
31.5% |
75.6% |
93.5% |
| (Standard Error) |
(1.6%) |
(4.9%) |
(3.0%) |
| Firm Age: 5-9 Years |
37.7% |
80.8% |
91.0% |
| (Standard Error) |
(1.6%) |
(3.8%) |
(3.9%) |
| Firm Age: 10-19 Years |
44.3% |
86.9% |
96.4% |
| (Standard Error) |
(1.2%) |
(2.3%) |
(1.1%) |
| Firm Age: 20+ Years |
60.5% |
91.8% |
99.6% |
| (Standard Error) |
(0.9%) |
(1.3%) |
(0.1%) |
| # of Locations: 2+ Locations |
70.1% |
89.7% |
99.7% |
| (Standard Error) |
(2.4%) |
(2.0%) |
(0.1%) |
| # of Locations: 1 Location |
46.2% |
87.5% |
95.0% |
| (Standard Error) |
(0.6%) |
(1.3%) |
(1.1%) |
|
Source: Medical Expenditure Panel Survey-Insurance Component, private-sector establishments, 2018.
|
Return to Table of Contents
Exhibit 1.10 Percentage (standard error) of private-sector employees in establishments that offer health insurance, by firm size and selected characteristics (% full time, % low wage), 2018
| Employer Characteristics |
<50 employees |
50-99 employees |
100 or more employees |
| % Full Time: 0-24% |
15.0% |
64.1% |
95.3% |
| (Standard Error) |
(1.2%) |
(5.2%) |
(1.0%) |
| % Full Time: 25-49% |
35.0% |
73.7% |
98.5% |
| (Standard Error) |
(2.1%) |
(4.4%) |
(0.5%) |
| % Full Time: 50-74% |
38.6% |
82.9% |
98.0% |
| (Standard Error) |
(1.6%) |
(3.3%) |
(0.9%) |
| % Full Time: 75%+ |
60.7% |
95.0% |
99.5% |
| (Standard Error) |
(0.8%) |
(1.0%) |
(0.1%) |
| % Low Wage: 50%+ |
23.6% |
72.0% |
96.9% |
| (Standard Error) |
(1.2%) |
(3.0%) |
(0.7%) |
| % Low Wage: <50% |
55.5% |
93.1% |
99.5% |
| (Standard Error) |
(0.7%) |
(1.0%) |
(0.1%) |
|
Source: Medical Expenditure Panel Survey-Insurance Component, private-sector establishments, 2018.
Note: "% Full Time" refers to the percentage of the establishment's workforce that worked full time in 2018. "% Low Wage" refers to the percentage of the establishment's workforce that earned less than $12.00 per hour in 2018.
|
Return to Table of Contents
Exhibit 1.11 Percentage (standard error) of private-sector establishments that offer health insurance that self-insure at least one plan, overall and by detailed firm size, 2005‑2018
| Number of Employees |
2005 |
2006 |
2008 |
2009 |
2010 |
2011 |
2012 |
2013 |
2014 |
2015 |
2016 |
2017 |
2018 |
| U.S. |
32.7% |
34.4% |
34.2% |
35.1% |
35.8% |
36.9% |
37.2% |
37.6% |
37.2% |
39.0% |
40.7% |
39.2% |
38.7% |
| (Standard Error) |
(0.5%) |
(0.5%) |
(0.4%) |
(0.4%) |
(0.5%) |
(0.5%) |
(0.5%) |
(0.5%) |
(0.5%) |
(0.5%) |
(0.6%) |
(0.6%) |
(0.6%) |
| <10 |
12.7% |
14.9% |
14.0% |
14.6% |
13.1% |
12.6% |
14.9% |
15.2% |
14.4% |
15.8% |
19.3% |
17.7% |
13.1% |
| (Standard Error) |
(0.8%) |
(0.9%) |
(0.8%) |
(0.7%) |
(0.5%) |
(0.8%) |
(0.9%) |
(0.4%) |
(0.8%) |
(1.0%) |
(1.4%) |
(1.4%) |
(1.1%) |
| 10-24 |
11.2% |
11.6% |
11.1% |
10.4% |
11.6% |
9.9% |
10.7% |
9.0% |
12.0% |
10.6% |
13.6% |
13.3% |
13.8% |
| (Standard Error) |
(0.5%) |
(0.6%) |
(0.9%) |
(0.4%) |
(0.8%) |
(0.7%) |
(0.7%) |
(0.7%) |
(1.0%) |
(1.0%) |
(1.1%) |
(1.2%) |
(1.2%) |
| 25-99 |
12.2% |
13.5% |
12.6% |
13.4% |
14.3% |
12.2% |
13.5% |
12.4% |
12.2% |
13.7% |
16.6% |
16.0% |
12.9% |
| (Standard Error) |
(0.9%) |
(0.7%) |
(0.8%) |
(0.7%) |
(0.7%) |
(0.7%) |
(0.7%) |
(0.7%) |
(0.8%) |
(0.9%) |
(0.9%) |
(0.9%) |
(0.8%) |
| 100-999 |
34.9% |
30.6% |
32.7% |
29.9% |
30.9% |
31.7% |
30.1% |
30.1% |
32.5% |
33.7% |
34.4% |
37.2% |
35.1% |
| (Standard Error) |
(1.4%) |
(0.9%) |
(1.3%) |
(0.7%) |
(0.9%) |
(1.1%) |
(0.8%) |
(1.0%) |
(1.2%) |
(1.2%) |
(1.2%) |
(1.3%) |
(1.2%) |
| 1,000+ |
82.7% |
83.8% |
86.5% |
85.8% |
86.6% |
87.5% |
87.1% |
88.0% |
84.2% |
83.8% |
81.9% |
78.6% |
81.6% |
| (Standard Error) |
(0.5%) |
(0.7%) |
(0.5%) |
(0.4%) |
(0.6%) |
(0.5%) |
(0.7%) |
(0.5%) |
(0.8%) |
(0.8%) |
(0.8%) |
(0.8%) |
(0.8%) |
|
Source: Medical Expenditure Panel Survey-Insurance Component, private-sector establishments, 2005‑2018.
Note: Medical Expenditure Panel Survey-Insurance Component estimates are not available for 2007.
|
Return to Table of Contents
Exhibit 1.12 Among establishments that offer insurance, percentage (standard error) of eligible employees in establishments that self-insure at least one plan, overall and by detailed firm size, 2005‑2018
| Number of Employees |
2005 |
2006 |
2008 |
2009 |
2010 |
2011 |
2012 |
2013 |
2014 |
2015 |
2016 |
2017 |
2018 |
| U.S. |
55.5% |
54.9% |
56.8% |
57.2% |
58.4% |
59.6% |
60.1% |
58.1% |
59.2% |
59.1% |
57.3% |
58.2% |
56.8% |
| (Standard Error) |
(0.8%) |
(0.7%) |
(0.5%) |
(0.7%) |
(0.7%) |
(0.6%) |
(0.7%) |
(0.6%) |
(0.6%) |
(0.6%) |
(0.6%) |
(0.6%) |
(0.6%) |
| <10 |
11.3% |
13.1% |
12.9% |
12.3% |
12.5% |
11.5% |
12.0% |
13.2% |
12.9% |
13.5% |
15.7% |
15.6% |
12.4% |
| (Standard Error) |
(0.8%) |
(0.8%) |
(0.8%) |
(0.6%) |
(0.6%) |
(0.9%) |
(0.9%) |
(0.8%) |
(0.9%) |
(1.1%) |
(1.2%) |
(1.3%) |
(1.1%) |
| 10-24 |
11.2% |
12.0% |
11.5% |
9.8% |
11.5% |
10.1% |
11.1% |
9.1% |
11.4% |
10.5% |
14.9% |
12.8% |
12.9% |
| (Standard Error) |
(0.8%) |
(0.9%) |
(1.3%) |
(0.5%) |
(1.0%) |
(0.8%) |
(1.0%) |
(0.9%) |
(1.2%) |
(1.1%) |
(1.3%) |
(1.2%) |
(1.1%) |
| 25-99 |
13.8% |
14.4% |
12.8% |
16.0% |
17.3% |
13.5% |
15.5% |
13.4% |
14.0% |
14.5% |
17.1% |
15.3% |
14.0% |
| (Standard Error) |
(1.5%) |
(1.0%) |
(1.1%) |
(1.0%) |
(1.1%) |
(0.8%) |
(0.9%) |
(0.8%) |
(1.1%) |
(1.1%) |
(1.1%) |
(1.0%) |
(0.9%) |
| 100-999 |
36.3% |
32.4% |
36.1% |
31.7% |
35.7% |
35.0% |
35.7% |
32.6% |
39.5% |
39.5% |
37.4% |
42.0% |
34.7% |
| (Standard Error) |
(1.1%) |
(1.4%) |
(1.0%) |
(1.8%) |
(1.4%) |
(1.2%) |
(1.4%) |
(1.0%) |
(1.4%) |
(1.5%) |
(1.3%) |
(1.4%) |
(1.3%) |
| 1,000+ |
84.2% |
83.4% |
85.9% |
85.8% |
86.6% |
89.0% |
89.0% |
86.9% |
86.6% |
86.4% |
82.8% |
82.2% |
82.2% |
| (Standard Error) |
(0.9%) |
(1.0%) |
(0.7%) |
(0.7%) |
(0.6%) |
(0.4%) |
(0.5%) |
(0.4%) |
(0.7%) |
(0.7%) |
(0.8%) |
(0.7%) |
(0.9%) |
|
Source: Medical Expenditure Panel Survey-Insurance Component, private-sector establishments, 2005‑2018.
Note: Medical Expenditure Panel Survey-Insurance Component estimates are not available for 2007.
|
Return to Table of Contents
Exhibit 1.13 Percentage (standard error) of eligible employees in establishments that offer family coverage and employee-plus-one coverage among establishments that offer coverage, overall and by detailed firm size, 2018
| Coverage |
U.S. |
<10 |
10-24 |
25-99 |
100-999 |
1,000+ |
| Any Dependent Coverage |
98.6% |
86.0% |
93.4% |
97.6% |
99.6% |
99.8% |
| (Standard Error) |
(0.1%) |
(1.1%) |
(0.8%) |
(0.3%) |
(0.1%) |
(0.1%) |
| Any Family Coverage |
97.9% |
80.5% |
90.9% |
96.6% |
99.0% |
99.8% |
| (Standard Error) |
(0.1%) |
(1.3%) |
(1.0%) |
(0.4%) |
(0.2%) |
(0.1%) |
| Any Employee-Plus-One |
93.4% |
67.4% |
79.3% |
90.6% |
91.6% |
97.9% |
| (Standard Error) |
(0.3%) |
(1.6%) |
(1.4%) |
(0.7%) |
(0.7%) |
(0.3%) |
| Family and Employee-Plus-One |
92.7% |
61.9% |
76.9% |
89.6% |
91.1% |
97.9% |
| (Standard Error) |
(0.3%) |
(1.7%) |
(1.4%) |
(0.8%) |
(0.7%) |
(0.3%) |
| Family Coverage Only |
5.2% |
18.6% |
14.1% |
7.0% |
7.9% |
1.9% |
| (Standard Error) |
(0.2%) |
(1.3%) |
(1.1%) |
(0.6%) |
(0.7%) |
(0.2%) |
|
Source: Medical Expenditure Panel Survey-Insurance Component, private-sector establishments, 2018.
Note:This table does not include a row with estimates for "Employee-plus-one only." These estimates can be calculated by subtracting the estimates for "Family and Employee-Plus-One" from the estimates for "Any Employee-Plus-One."
|
Return to Table of Contents
Exhibit 1.14 Percentage (standard error) of private-sector employees working in establishments that offer two or more health insurance plans, overall and by firm size, 2005‑2018
| Number of Employees |
2005 |
2006 |
2008 |
2009 |
2010 |
2011 |
2012 |
2013 |
2014 |
2015 |
2016 |
2017 |
2018 |
| U.S. |
56.3% |
61.4% |
64.8% |
66.5% |
65.6% |
65.5% |
65.3% |
66.0% |
67.0% |
70.2% |
71.7% |
72.4% |
75.7% |
| (Standard Error) |
(0.8%) |
(0.7%) |
(0.6%) |
(0.7%) |
(0.8%) |
(0.5%) |
(0.7%) |
(0.6%) |
(0.6%) |
(0.5%) |
(0.5%) |
(0.5%) |
(0.5%) |
| <50 |
18.2% |
21.5% |
26.8% |
27.3% |
26.7% |
27.2% |
29.3% |
28.4% |
29.6% |
33.6% |
34.2% |
34.9% |
37.8% |
| (Standard Error) |
(1.1%) |
(1.1%) |
(0.7%) |
(0.9%) |
(0.8%) |
(0.9%) |
(0.8%) |
(1.0%) |
(0.9%) |
(1.1%) |
(1.0%) |
(1.0%) |
(1.0%) |
| 50-99 |
32.1% |
36.0% |
42.5% |
42.8% |
44.1% |
46.8% |
43.7% |
46.6% |
46.8% |
50.2% |
56.2% |
59.3% |
56.4% |
| (Standard Error) |
(2.5%) |
(2.4%) |
(1.7%) |
(2.0%) |
(1.9%) |
(2.2%) |
(1.7%) |
(2.2%) |
(2.1%) |
(2.2%) |
(2.0%) |
(1.9%) |
(1.9%) |
| 100+ |
69.0% |
74.3% |
76.9% |
78.5% |
77.3% |
76.3% |
75.7% |
76.5% |
77.0% |
79.7% |
80.7% |
81.0% |
84.7% |
| (Standard Error) |
(0.9%) |
(0.6%) |
(0.7%) |
(0.7%) |
(1.0%) |
(0.7%) |
(0.7%) |
(0.7%) |
(0.6%) |
(0.6%) |
(0.6%) |
(0.6%) |
(0.5%) |
|
Source: Medical Expenditure Panel Survey-Insurance Component, private-sector establishments, 2005‑2018.
Denominator: Within each category, all employees in establishments that offer health insurance.
Note: Medical Expenditure Panel Survey-Insurance Component estimates are not available for 2007.
|
Return to Table of Contents
Exhibit 1.15 Percentage (standard error) of private-sector employees in establishments that offer two or more health insurance plans, overall and by industry, 2018
| Industry |
Percentage |
| United States |
75.7% |
| (Standard Error) |
(0.5%) |
| Agriculture, fisheries, forestry |
63.4% |
| (Standard Error) |
(8.5%) |
| Mining and manufacturing |
73.0% |
| (Standard Error) |
(1.4%) |
| Construction |
55.2% |
| (Standard Error) |
(2.6%) |
| Utilities and transportation |
76.6% |
| (Standard Error) |
(2.5%) |
| Wholesale trade |
71.1% |
| (Standard Error) |
(2.1%) |
| Financial services and real estate |
81.3% |
| (Standard Error) |
(1.5%) |
| Retail trade |
82.3% |
| (Standard Error) |
(1.2%) |
| Professional services |
75.8% |
| (Standard Error) |
(0.9%) |
| Other services |
76.3% |
| (Standard Error) |
(1.0%) |
|
Source: Medical Expenditure Panel Survey-Insurance Component, private-sector establishments, 2018.
Denominator: Within each category, all employees in establishments that offer health insurance.
|
Return to Table of Contents
Exhibit 1.16 Percentage (standard error) of private-sector employees in establishments that offer two or more health insurance plans, by firm size and industry, 2018
| Industry |
<50 employees |
50-99 employees |
100 or more employees |
| Agriculture, fisheries, forestry |
39.7% |
* |
73.2% |
| (Standard Error) |
(10.1%) |
(*) |
(8.9%) |
| Mining and manufacturing |
40.2% |
62.4% |
79.1% |
| (Standard Error) |
(3.3%) |
(5.2%) |
(1.6%) |
| Construction |
33.8% |
59.2% |
71.1% |
| (Standard Error) |
(2.9%) |
(6.6%) |
(4.1%) |
| Utilities and transportation |
33.4% |
45.1% |
83.2% |
| (Standard Error) |
(5.8%) |
(11.0%) |
(2.5%) |
| Wholesale trade |
38.1% |
67.1% |
81.4% |
| (Standard Error) |
(3.4%) |
(5.8%) |
(2.4%) |
| Financial services and real estate |
38.9% |
51.2% |
87.5% |
| (Standard Error) |
(4.1%) |
(7.0%) |
(1.5%) |
| Retail trade |
32.2% |
59.3% |
90.5% |
| (Standard Error) |
(2.9%) |
(6.3%) |
(0.9%) |
| Professional services |
41.0% |
57.9% |
83.7% |
| (Standard Error) |
(1.8%) |
(3.6%) |
(1.1%) |
| Other services |
37.7% |
52.2% |
87.3% |
| (Standard Error) |
(2.2%) |
(4.0%) |
(1.0%) |
|
* Estimate was suppressed due to insufficient sample size.
Source: Medical Expenditure Panel Survey-Insurance Component, private-sector establishments, 2018.
Denominator: Within each category, all employees in establishments that offer health insurance.
|
Return to Table of Contents
Exhibit 1.17 Percentage (standard error) of private-sector employees in establishments that offer two or more health insurance plans, by selected characteristics, 2018
| Employer Characteristics |
Percentage |
| United States |
75.7% |
| (Standard Error) |
(0.5%) |
| Ownership: For Profit Inc. |
76.8% |
| (Standard Error) |
(0.6%) |
| Ownership: For Profit Uninc. |
72.4% |
| (Standard Error) |
(1.3%) |
| Ownership: Nonprofit |
74.2% |
| (Standard Error) |
(1.4%) |
| Firm Age: 0-4 Years |
63.1% |
| (Standard Error) |
(2.5%) |
| Firm Age: 5-9 Years |
61.1% |
| (Standard Error) |
(2.5%) |
| Firm Age: 10-19 Years |
60.5% |
| (Standard Error) |
(1.7%) |
| Firm Age: 20+ Years |
79.2% |
| (Standard Error) |
(0.5%) |
| # of Locations: 2+ Locations |
85.3% |
| (Standard Error) |
(0.5%) |
| # of Locations: 1 Location |
53.1% |
| (Standard Error) |
(1.0%) |
| % Full Time: 0-24% |
74.8% |
| (Standard Error) |
(1.9%) |
| % Full Time: 25-49% |
71.5% |
| (Standard Error) |
(2.0%) |
| % Full Time: 50-74% |
76.1% |
| (Standard Error) |
(1.4%) |
| % Full Time: 75%+ |
76.2% |
| (Standard Error) |
(0.6%) |
| % Low Wage: 50%+ |
76.2% |
| (Standard Error) |
(1.1%) |
| % Low Wage: <50% |
75.6% |
| (Standard Error) |
(0.5%) |
|
Source: Medical Expenditure Panel Survey-Insurance Component, private-sector establishments, 2018.
Denominator: Within each category, all employees in establishments that offer health insurance.
Note: "% Full Time" refers to the percentage of the establishment's workforce that worked full time in 2018. "% Low Wage" refers to the percentage of the establishment's workforce that earned less than $12.00 per hour in 2018.
|
Return to Table of Contents
Exhibit 1.18 Percentage (standard error) of private-sector employees in establishments that offer two or more health insurance plans, by firm size and selected characteristics (ownership type, age of firm, number of locations), 2018
| Employer Characteristics |
<50 employees |
50-99 employees |
100 or more employees |
| Ownership: For Profit Inc. |
36.8% |
57.0% |
86.3% |
| (Standard Error) |
(1.2%) |
(2.4%) |
(0.6%) |
| Ownership: For Profit Uninc. |
42.6% |
62.4% |
82.6% |
| (Standard Error) |
(2.4%) |
(4.3%) |
(1.4%) |
| Ownership: Nonprofit |
35.2% |
44.6% |
80.4% |
| (Standard Error) |
(2.8%) |
(5.0%) |
(1.5%) |
| Firm Age: 0-4 Years |
44.2% |
73.3% |
81.7% |
| (Standard Error) |
(3.3%) |
(5.7%) |
(3.5%) |
| Firm Age: 5-9 Years |
45.1% |
61.6% |
75.4% |
| (Standard Error) |
(3.0%) |
(6.0%) |
(4.1%) |
| Firm Age: 10-19 Years |
37.2% |
57.9% |
76.8% |
| (Standard Error) |
(1.9%) |
(4.1%) |
(2.6%) |
| Firm Age: 20+ Years |
34.8% |
52.8% |
85.7% |
| (Standard Error) |
(1.3%) |
(2.5%) |
(0.5%) |
| # of Locations: 2+ Locations |
40.9% |
57.7% |
86.7% |
| (Standard Error) |
(3.2%) |
(3.3%) |
(0.5%) |
| # of Locations: 1 Location |
37.6% |
56.0% |
71.9% |
| (Standard Error) |
(1.0%) |
(2.3%) |
(2.0%) |
|
Source: Medical Expenditure Panel Survey-Insurance Component, private-sector establishments, 2018.
Denominator: Within each category, all employees in establishments that offer health insurance.
|
Return to Table of Contents
Exhibit 1.19 Percentage (standard error) of private-sector employees in establishments that offer two or more health insurance plans, by firm size and selected characteristics (% full time, % low wage), 2018
| Employer Characteristics |
<50 employees |
50-99 employees |
100 or more employees |
| % Full Time: 0-24% |
25.5% |
31.1% |
87.2% |
| (Standard Error) |
(3.8%) |
(6.9%) |
(1.6%) |
| % Full Time: 25-49% |
39.6% |
54.9% |
80.2% |
| (Standard Error) |
(3.8%) |
(6.4%) |
(2.3%) |
| % Full Time: 50-74% |
32.6% |
62.1% |
85.2% |
| (Standard Error) |
(2.7%) |
(5.5%) |
(1.5%) |
| % Full Time: 75%+ |
39.3% |
58.0% |
84.9% |
| (Standard Error) |
(1.1%) |
(2.2%) |
(0.6%) |
| % Low Wage: 50%+ |
33.6% |
51.3% |
83.9% |
| (Standard Error) |
(2.8%) |
(4.4%) |
(1.2%) |
| % Low Wage: <50% |
38.4% |
57.6% |
85.0% |
| (Standard Error) |
(1.0%) |
(2.1%) |
(0.6%) |
|
Source: Medical Expenditure Panel Survey-Insurance Component, private-sector establishments, 2018.
Denominator: Within each category, all employees in establishments that offer health insurance.
Note: "% Full Time" refers to the percentage of the establishment's workforce that worked full time in 2018. "% Low Wage" refers to the percentage of the establishment's workforce that earned less than $12.00 per hour in 2018.
|
Return to Table of Contents
Exhibit 1.20 Among establishments offering health insurance, percentage (standard error) offering coverage to retirees under age 65, overall and by detailed firm size, 2005‑2018
| Number of Employees |
2005 |
2006 |
2008 |
2009 |
2010 |
2011 |
2012 |
2013 |
2014 |
2015 |
2016 |
2017 |
2018 |
| U.S. |
12.5% |
13.0% |
11.2% |
11.2% |
11.6% |
13.1% |
12.3% |
11.9% |
11.6% |
11.6% |
12.5% |
10.8% |
11.1% |
| (Standard Error) |
(0.3%) |
(0.4%) |
(0.3%) |
(0.3%) |
(0.4%) |
(0.3%) |
(0.3%) |
(0.5%) |
(0.4%) |
(0.4%) |
(0.4%) |
(0.4%) |
(0.4%) |
| <10 |
1.6% |
1.8% |
1.4% |
1.2% |
2.0% |
1.6% |
1.8% |
1.4% |
1.4% |
1.2% |
2.3% |
1.6% |
2.3% |
| (Standard Error) |
(0.3%) |
(0.2%) |
(0.2%) |
(0.2%) |
(0.2%) |
(0.3%) |
(0.2%) |
(0.2%) |
(0.3%) |
(0.3%) |
(0.6%) |
(0.4%) |
(0.5%) |
| 10-24 |
1.3% |
1.8% |
1.6% |
1.6% |
1.4% |
1.0% |
1.2% |
1.0%✝ |
1.5% |
1.3% |
1.7% |
2.1% |
1.6% |
| (Standard Error) |
(0.4%) |
(0.4%) |
(0.2%) |
(0.2%) |
(0.2%) |
(0.2%) |
(0.2%) |
(0.4%) |
(0.4%) |
(0.3%) |
(0.4%) |
(0.5%) |
(0.4%) |
| 25-99 |
2.9% |
2.9% |
2.4% |
2.4% |
3.0% |
3.1% |
2.4% |
2.2% |
2.4% |
1.7% |
2.3% |
1.9% |
2.3% |
| (Standard Error) |
(0.6%) |
(0.4%) |
(0.4%) |
(0.4%) |
(0.4%) |
(0.4%) |
(0.3%) |
(0.3%) |
(0.3%) |
(0.3%) |
(0.4%) |
(0.3%) |
(0.4%) |
| 100-999 |
9.8% |
8.3% |
8.0% |
7.5% |
6.9% |
6.8% |
7.4% |
6.3% |
6.6% |
6.0% |
6.2% |
7.0% |
6.8% |
| (Standard Error) |
(0.6%) |
(0.6%) |
(0.6%) |
(0.4%) |
(0.6%) |
(0.2%) |
(0.6%) |
(0.6%) |
(0.6%) |
(0.6%) |
(0.7%) |
(0.7%) |
(0.6%) |
| 1,000+ |
40.5% |
40.6% |
36.1% |
34.5% |
34.2% |
37.7% |
35.3% |
34.3% |
32.5% |
31.6% |
32.4% |
27.6% |
27.4% |
| (Standard Error) |
(1.2%) |
(1.5%) |
(0.9%) |
(1.2%) |
(1.3%) |
(0.9%) |
(1.1%) |
(0.9%) |
(1.2%) |
(1.1%) |
(1.0%) |
(1.0%) |
(1.0%) |
|
✝ Estimate does not meet standard of reliability or precision.
Source: Medical Expenditure Panel Survey-Insurance Component, private-sector establishments, 2005‑2018.
Note: Medical Expenditure Panel Survey-Insurance Component estimates are not available for 2007.
|
Return to Table of Contents
Exhibit 1.21 Among establishments offering health insurance, percentage (standard error) offering coverage to retirees age 65 and over, overall and by detailed firm size, 2005‑2018
| Number of Employees |
2005 |
2006 |
2008 |
2009 |
2010 |
2011 |
2012 |
2013 |
2014 |
2015 |
2016 |
2017 |
2018 |
| U.S. |
12.7% |
12.4% |
10.5% |
11.3% |
10.8% |
11.9% |
11.6% |
10.5% |
10.3% |
10.4% |
10.5% |
8.6% |
8.7% |
| (Standard Error) |
(0.2%) |
(0.4%) |
(0.4%) |
(0.3%) |
(0.4%) |
(0.3%) |
(0.4%) |
(0.4%) |
(0.4%) |
(0.4%) |
(0.4%) |
(0.4%) |
(0.4%) |
| <10 |
2.3% |
2.5% |
2.3% |
2.6% |
2.2% |
2.5% |
2.6% |
2.1% |
2.0% |
2.2% |
3.4% |
2.3% |
3.1% |
| (Standard Error) |
(0.3%) |
(0.3%) |
(0.2%) |
(0.3%) |
(0.3%) |
(0.2%) |
(0.3%) |
(0.4%) |
(0.3%) |
(0.4%) |
(0.7%) |
(0.5%) |
(0.6%) |
| 10-24 |
3.1% |
3.6% |
3.4% |
2.7% |
2.3% |
2.3% |
2.8% |
2.2% |
2.4% |
2.4% |
2.7% |
2.7% |
1.5% |
| (Standard Error) |
(0.6%) |
(0.5%) |
(0.7%) |
(0.3%) |
(0.5%) |
(0.4%) |
(0.5%) |
(0.6%) |
(0.5%) |
(0.5%) |
(0.5%) |
(0.5%) |
(0.4%) |
| 25-99 |
5.0% |
4.3% |
2.9% |
3.4% |
3.3% |
3.7% |
3.4% |
3.4% |
2.9% |
3.1% |
2.6% |
2.9% |
2.4% |
| (Standard Error) |
(0.8%) |
(0.4%) |
(0.3%) |
(0.2%) |
(0.3%) |
(0.4%) |
(0.3%) |
(0.4%) |
(0.4%) |
(0.5%) |
(0.4%) |
(0.4%) |
(0.4%) |
| 100-999 |
10.1% |
8.3% |
7.7% |
8.6% |
7.8% |
6.5% |
7.5% |
6.3% |
7.1% |
5.5% |
5.9% |
5.7% |
6.0% |
| (Standard Error) |
(0.5%) |
(0.9%) |
(0.7%) |
(0.4%) |
(0.4%) |
(0.4%) |
(0.8%) |
(0.7%) |
(0.6%) |
(0.6%) |
(0.7%) |
(0.6%) |
(0.6%) |
| 1,000+ |
38.1% |
35.7% |
31.1% |
31.8% |
29.9% |
31.9% |
31.1% |
27.8% |
26.8% |
26.1% |
24.8% |
20.3% |
19.7% |
| (Standard Error) |
(0.8%) |
(1.1%) |
(1.0%) |
(1.0%) |
(1.1%) |
(0.9%) |
(1.4%) |
(0.7%) |
(1.2%) |
(1.1%) |
(1.0%) |
(0.9%) |
(0.9%) |
|
Source: Medical Expenditure Panel Survey-Insurance Component, private-sector establishments, 2005‑2018.
Note: Medical Expenditure Panel Survey-Insurance Component estimates are not available for 2007.
|
Return to Table of Contents
In 2018, 47.8 percent of private-sector employees were enrolled in a health plan through their employer ("enrollment rate"). Among establishments that offered insurance, 56.5 percent of employees were enrolled in coverage through their employer ("coverage rate") and 78.0 percent were eligible for health insurance ("eligibility rate"). Among eligible employees, 72.4 percent were enrolled in their employer's health insurance ("take-up rate").
This section presents estimates for 2005 to 2018 for private-sector employees for the:
- Enrollment rate (percentage of all employees enrolled in their employer's health insurance plan regardless of whether the establishment offered health insurance). (Note that in this calculation the number of enrollees is equal to zero at employers that do not offer coverage),
- Coverage rate (percentage of all employees enrolled in their employer's health insurance plan at establishments that offered health insurance),
- Eligibility rate (percentage of employees eligible for health insurance through their employer at establishments offering health insurance), and
- Take-up rate (percentage of eligible employees who enrolled in their employer's health insurance).
The coverage rate is equal to the eligibility rate multiplied by the take-up rate, and the enrollment rate is equal to the coverage rate multiplied by the offer rate (the percentage of employees who work at employers that offer insurance). Information on offer rates can be found in Section 1.
This section also presents estimates for 2005 to 2018 for the percentage of enrollees in single, employee-plus-one, and family coverage and examines variation in coverage, eligibility, and take-up rates by firm size, industry, and other employer characteristics. It also presents coverage rates by the State in which the establishment was located.
Changes From 2017 to 2018
Overall
- Between 2017 and 2018, there was no significant change in the overall percentage of private-sector employees enrolled in a health insurance plan offered by their employers (enrollment rate). However, the total number of enrollees increased from 59.9 million to 62.1 million (Exhibits 2.1 and 2.2).
- Among employees in establishments that offered health insurance, there was no significant change in the coverage rate from 2017 to 2018. However, the eligibility rate increased from 76.8 percent in 2017 to 78.0 percent in 2018 and the take-up rate declined from 73.5 percent to 72.4 percent. The 2018 eligibility rate was higher than eligibility rates observed from 2014 to 2017, and the 2018 take-up rate was significantly lower than take-up rates in almost all years in the 2005 to 2017 period (Exhibits 2.3, 2.5, and 2.7).
By Firm Size
- Between 2017 and 2018, there was no significant change in the enrollment rate in any firm-size category and no significant change in the number of enrollees in either small firms (fewer than 50 employees) or medium firms (50-99 employees). However, the number of enrollees in large firms (100 or more employees) increased from 46.9 million to 48.9 million (Exhibits 2.1 and 2.2).
- There was no significant change in the coverage rate between 2017 and 2018 in any firm-size category (Exhibit 2.3).
- Underlying the lack of significant change in coverage rates at large firms was an increase in the eligibility rate from 76.6 percent in 2017 to 78.0 percent in 2018 (p <0.10) and a decrease in the take-up rate from 74.5 percent to 73.3 percent. The eligibility rate in 2018 for large firms was higher than those observed for large firms from 2014 to 2017 but the take-up rate was lower than in all years from 2005 to 2017 (Exhibits 2.5 and 2.7).
- Between 2017 and 2018, there was a significant increase in eligibility rates for the overall large firm category (100 or more employees, p <0.10), but there were no significant changes for subgroups of large firms with 100-999 employees and with 1,000 or more employees. Take-up rates declined significantly for employees in firms with 1,000 or more employees (Exhibits 2.5, 2.6 and 2.8).
- Eligibility and take-up rates at small and medium firms did not differ significantly from their 2017 levels (Exhibits 2.5 and 2.7).
By Firm Size and Percentage of Establishment's Workforce That Is Low Wage
- Between 2017 and 2018, coverage rates at small low-wage employers (fewer than 50 employees and 50 percent or more of the establishment's workforce earning less than $12.00 per hour) increased from 28.9 percent to 32.6 percent (p <0.10) but there were no significant changes in eligibility or take-up rates for this group (Exhibits 2.9, 2.10, and 2.11).
- The only other significant change in coverage, eligibility, or take-up rates for employers classified by wage category and firm size was a decline in take-up rates for large higher wage employers (50 or more employees and less than 50 percent of the establishment's workforce earning less than $12.00 per hour). Take-up rates in such firms declined from 76.9 percent in 2017 to 75.2 percent in 2018 (Exhibits 2.9, 2.10, and 2.11).
- Throughout the 2005 to 2018 period, coverage and take-up rates were higher at large higher wage employers than at small higher wage employers. In most years, there was no significant difference in eligibility rates by firm size among higher wage employers. Patterns are less consistent in this period for comparisons of coverage, eligibility, and take-up rates between small and large low-wage employers (Exhibits 2.9, 2.10, and 2.11).
Estimates by Selected Characteristics, 2018
Differences by Firm Size, 2018
- In 2018, enrollment rates varied significantly across all firm sizes. Workers in firms with fewer than 50 employees had the lowest enrollment rate (26.6 percent), workers in medium firms (50-99 employees) had an enrollment rate of 44.3 percent, and workers in large firms (100 or more employees) had the highest enrollment rate (56.5 percent) (Exhibit 2.1).
- In 2018, the coverage rate was significantly lower in medium firms (50.3 percent) than in small (56.2 percent) and large firms (57.1 percent) (Exhibit 2.3).
- In 2018, the higher enrollment rates at medium and large firms than at small firms reflect higher offer rates at medium and large employers compared with small employers since workers at medium firms had lower coverage rates than workers at small firms and there was no significant difference in coverage rates between small and large firms (Exhibits 1.1, 2.1, and 2.3).
- The higher enrollment rate for large firms compared with medium firms reflects higher offer rates and coverage rates at large firms compared with medium firms (Exhibits 1.1, 2.1, and 2.3).
- From 2005 to 2018, eligibility rates were similar between small and large firms, except for the period from 2014 to 2017, when eligibility rates for small firms were higher than in large firms (Exhibit 2.5).
- Except for 2006, workers in small firms had significantly lower take-up rates than workers in large firms in all years from 2005 to 2018 (Exhibit 2.7).
- The lower coverage rate in 2018 for workers in medium firms than in small and large firms was driven by higher eligibility and take-up rates in small and large firms (p <0.10 for the difference in eligibility rates between large and medium firms) (Exhibits 2.3, 2.5, and 2.7).
- The coverage rate in 2018 for workers in the smallest firms (fewer than 10 employees) was higher than coverage rates for workers in the four other detailed firm sizes (10-24, 25-99, 100-999, and 1,000 or more employees). This higher coverage rate reflects the higher eligibility rate for workers in the smallest firms compared with workers in all other firm-size categories (p <0.10 for the comparison with 10-24 employees) and higher take-up rates compared with workers in all but the very largest firms (Exhibits 2.4, 2.6, and 2.8).
- Workers in the largest firms (1,000 or more employees) had a higher coverage rate than workers in firms with 10-24 workers (p <0.10) and 25-99 workers due to a higher take-up rate. The take-up rate in the largest firms was higher than in all firm-size categories except the smallest firms (p <0.10 for the comparison with 100-999 workers) (Exhibits 2.4, 2.6, and 2.8).
Differences by State, 2018
- The coverage rate varied by State in 2018, although most States were not significantly different from the national average of 56.5 percent.
- Five States were significantly below the national average: New Mexico, New York, Rhode Island, Vermont, and West Virginia.
- Nine States were significantly above the national average: District of Columbia, Idaho, Missouri, North Dakota, Oregon, South Carolina, Texas, Utah, and Washington (Exhibit 2.12).
Differences by Industry, 2018
- Employees in mining and manufacturing had a higher coverage rate (76.8 percent) than any other sector. The high coverage rate in mining and manufacturing was due to a higher eligibility rate than all other sectors (94.5 percent, p <0.10 for the difference with wholesale trade) and a higher take-up rate (81.3 percent) than all other sectors (Exhibits 2.13, 2.14, and 2.15).
- Employees in wholesale trade and financial services and real estate had higher coverage rates (73.5 percent and 71.9 percent, respectively) than all other sectors besides mining and manufacturing. These higher rates were due to a combination of eligibility rates (92.9 percent and 91.8 percent, respectively) and take-up rates (79.1 percent, and 78.3 percent, respectively) that were higher than almost all other sectors (p <0.10 for some comparisons) (Exhibits 2.13, 2.14, and 2.15).
- Conversely, employees in retail trade and in other services had lower coverage rates than most sectors (42.1 percent and 36.3 percent, respectively). These lower rates resulted from lower eligibility rates (65.0 percent and 59.5 percent, respectively) and lower take-up rates (64.8 percent and 61.0 percent, respectively) than most other sectors (Exhibits 2.13, 2.14, and 2.15).
Differences by Selected Firm Characteristics, 2018
- Employees in establishments that were for profit and unincorporated had a lower coverage rate than employees in establishments that were either nonprofit or for profit and incorporated (51.2 percent vs. 58.8 percent and 57.0 percent, respectively). The eligibility rate was higher at for-profit incorporated establishments (78.9 percent) than at for-profit unincorporated establishments (74.9 percent) and nonprofit establishments (76.9 percent). Employees in nonprofit establishments had a higher take-up rate than those in for-profit unincorporated establishments or for-profit incorporated establishments (76.5 percent vs. 68.3 percent and 72.3 percent, respectively) (Exhibits 2.16, 2.17, and 2.18).
- Employees in firms that were 20 years old or older had a higher coverage rate (57.6 percent) than employees in firms that were less than 5 years old, 5-9 years old, and 10-19 years old (50.4 percent, 51.5 percent, and 52.0 percent, respectively). The eligibility rate was higher in the oldest firms than in firms younger than 10 years (p <0.10 for the comparison with firms 5-9 years old) and the take-up rate was higher than in all younger firms (73.7 percent vs. a range of 66.3 percent to 68.2 percent in younger firms) (Exhibits 2.16, 2.17, and 2.18).
- Employees in firms with multiple locations had a higher coverage rate than those with a single location (57.9 percent vs. 53.1 percent). The difference in coverage rates was due to both a higher eligibility rate (78.4 percent vs. 76.8 percent) and a higher take-up rate in firms with multiple locations (73.8 percent vs. 69.2 percent) (Exhibits 2.16, 2.17, and 2.18).
- The coverage rate increased directly with the percentage of full-time employees at an establishment, increasing from 13.2 percent for employees in establishments with 0-24 percent full-time employees to 65.6 percent in establishments with 75 percent or more full-time employees. The eligibility rate followed the same pattern, increasing from 27.7 percent to 87.9 percent. Take-up rates also followed a similar pattern, increasing from 47.5 percent in establishments with 0-24 percent full-time employees to 74.7 percent in firms with 75 percent or more full-time employees (Exhibits 2.16, 2.17, and 2.18).
- Employees in higher wage establishments (less than 50 percent of the employees earned less than $12.00 an hour) had more than double the coverage rate of employees in predominantly low-wage establishments (50 percent or more of the employees earned less than $12.00 an hour) (62.4 percent vs. 30.6 percent). This difference was due to both a higher eligibility rate (83.6 percent vs. 53.6 percent) and a higher take-up rate (74.7 percent vs. 57.0 percent) among employees in higher wage establishments (Exhibits 2.16, 2.17, and 2.18).
Enrollment in Single, Employee-Plus-One, and Family Coverage
Overall
- In 2018, 55.2 percent of enrollees had single coverage, 18.6 percent had employee-plus-one coverage, and 26.2 percent had family coverage (Exhibits 2.19, 2.20, and 2.21).
- Between 2017 and 2018, there was no significant change in the percentage of enrollees with single, employee-plus-one, or family coverage (Exhibits 2.19, 2.20, and 2.21).
- Between 2005 and 2018, the percentage of enrollees with single coverage increased from 48.6 percent to 55.2 percent and the percentage with employee-plus-one coverage increased from 17.3 percent to 18.6 percent. The percentage with family coverage decreased from 34.0 percent to 26.2 percent (Exhibits 2.19, 2.20, and 2.21).
By Firm Size
- In 2018, a lower percentage of enrollees in large firms than in small and medium firms chose single coverage (52.9 percent vs. 63.2 percent and 64.6 percent, respectively). A higher percentage of large-firm enrollees chose employee-plus-one coverage (19.6 percent vs. 14.8 percent and 16.1 percent, respectively) and family coverage (27.5 percent vs. 22.0 percent and 19.3 percent, respectively) (Exhibits 2.19, 2.20, and 2.21).
- Between 2017 and 2018, the percentage of employees in large firms enrolled in single coverage increased from 52.1 percent to 52.9 percent (p <0.10). The percentage of enrollees with employee-plus-one coverage increased in small firms (p <0.10) and decreased in large firms. There was no significant change in the percentage of enrollees with family coverage in any firm-size category (Exhibits 2.19, 2.20, and 2.21).
- In the detailed firm-size categories, the only significant change in the type of enrollment between 2017 and 2018 was in employee-plus-one coverage. The percentage of employees who chose employee-plus-one coverage increased in firms with 25-99 employees (p <0.10) and decreased in firms with 100-999 employees (Exhibits 2.22, 2.23, and 2.24).
Return to Table of Contents
Exhibit 2.1: Enrollment Rate Percentage (standard error) of all private-sector employees enrolled in health insurance offered by their employers, overall and by firm size, 2005‑2018
| Number of Employees |
2005 |
2006 |
2008 |
2009 |
2010 |
2011 |
2012 |
2013 |
2014 |
2015 |
2016 |
2017 |
2018 |
| U.S. |
54.3% |
52.8% |
53.9% |
53.5% |
51.8% |
50.6% |
49.9% |
49.4% |
48.1% |
47.8% |
47.2% |
47.7% |
47.8% |
| (Standard Error) |
(0.5%) |
(0.3%) |
(0.4%) |
(0.4%) |
(0.5%) |
(0.3%) |
(0.3%) |
(0.3%) |
(0.3%) |
(0.4%) |
(0.3%) |
(0.4%) |
(0.4%) |
| <50 |
37.4% |
36.8% |
36.8% |
35.5% |
34.2% |
32.0% |
30.5% |
30.3% |
28.3% |
27.1% |
26.5% |
26.7% |
26.6% |
| (Standard Error) |
(0.4%) |
(0.4%) |
(0.3%) |
(0.4%) |
(0.6%) |
(0.4%) |
(0.3%) |
(0.4%) |
(0.4%) |
(0.5%) |
(0.4%) |
(0.4%) |
(0.4%) |
| 50-99 |
49.4% |
48.7% |
51.1% |
53.8% |
48.8% |
46.9% |
46.6% |
47.6% |
45.2% |
47.0% |
45.4% |
45.0% |
44.3% |
| (Standard Error) |
(1.0%) |
(1.5%) |
(1.0%) |
(1.1%) |
(1.0%) |
(1.2%) |
(0.7%) |
(0.7%) |
(1.3%) |
(1.3%) |
(1.2%) |
(1.2%) |
(1.2%) |
| 100+ |
62.0% |
59.9% |
61.3% |
60.9% |
59.5% |
58.9% |
58.5% |
57.7% |
56.7% |
56.4% |
56.0% |
56.5% |
56.5% |
| (Standard Error) |
(0.7%) |
(0.6%) |
(0.6%) |
(0.6%) |
(0.6%) |
(0.4%) |
(0.4%) |
(0.3%) |
(0.5%) |
(0.5%) |
(0.5%) |
(0.5%) |
(0.5%) |
|
Source: Medical Expenditure Panel Survey-Insurance Component, private-sector establishments, 2005‑2018.
Denominator: Within each category, all employees in all establishments.
Note: Medical Expenditure Panel Survey-Insurance Component estimates are not available for 2007.
|
Return to Table of Contents
Exhibit 2.2: Number Enrolled Total number (in millions) (standard error) of private-sector employees enrolled in health insurance offered by their employers, overall and by firm size, 2005‑2018
| Number of Employees |
2005 |
2006 |
2008 |
2009 |
2010 |
2011 |
2012 |
2013 |
2014 |
2015 |
2016 |
2017 |
2018 |
| U.S. |
60.9 |
60.5 |
62.6 |
59.2 |
56.1 |
54.8 |
55.4 |
56.3 |
55.8 |
57.3 |
58.2 |
59.9 |
62.1 |
| (Standard Error) |
(0.9) |
(0.7) |
(0.6) |
(0.7) |
(0.8) |
(0.6) |
(0.6) |
(0.7) |
(0.6) |
(0.6) |
(0.6) |
(0.7) |
(0.7) |
| <50 |
11.7 |
11.6 |
11.5 |
10.6 |
10.2 |
9.5 |
9.3 |
9.5 |
8.9 |
8.9 |
8.9 |
8.9 |
9.1 |
| (Standard Error) |
(0.2) |
(0.2) |
(0.1) |
(0.2) |
(0.2) |
(0.1) |
(0.1) |
(0.2) |
(0.1) |
(0.1) |
(0.1) |
(0.1) |
(0.1) |
| 50-99 |
3.9 |
3.8 |
4.4 |
4.3 |
3.8 |
3.7 |
3.8 |
4.0 |
4.1 |
4.0 |
4.0 |
4.1 |
4.2 |
| (Standard Error) |
(0.2) |
(0.2) |
(0.2) |
(0.1) |
(0.2) |
(0.1) |
(0.2) |
(0.2) |
(0.1) |
(0.2) |
(0.1) |
(0.2) |
(0.2) |
| 100+ |
45.3 |
45.1 |
46.7 |
44.3 |
42.1 |
41.6 |
42.3 |
42.9 |
42.8 |
44.4 |
45.3 |
46.9 |
48.9 |
| (Standard Error) |
(0.8) |
(0.9) |
(0.6) |
(0.6) |
(0.8) |
(0.5) |
(0.6) |
(0.7) |
(0.6) |
(0.6) |
(0.6) |
(0.7) |
(0.7) |
|
Source: Medical Expenditure Panel Survey-Insurance Component, private-sector establishments, 2005‑2018.
Note: Medical Expenditure Panel Survey-Insurance Component estimates are not available for 2007. The sum of estimates by firm size may differ from the U.S. total due to rounding.
|
Return to Table of Contents
Exhibit 2.3: Coverage Rate Percentage (standard error) of private-sector employees who are enrolled in health insurance at establishments that offer health insurance, overall and by firm size, 2005‑2018
| Number of Employees |
2005 |
2006 |
2008 |
2009 |
2010 |
2011 |
2012 |
2013 |
2014 |
2015 |
2016 |
2017 |
2018 |
| U.S. |
62.5% |
60.7% |
61.4% |
61.1% |
59.8% |
59.4% |
58.9% |
58.2% |
57.8% |
57.0% |
56.0% |
56.5% |
56.5% |
| (Standard Error) |
(0.4%) |
(0.3%) |
(0.4%) |
(0.4%) |
(0.5%) |
(0.2%) |
(0.4%) |
(0.3%) |
(0.4%) |
(0.4%) |
(0.4%) |
(0.4%) |
(0.4%) |
| <50 |
60.1% |
60.1% |
59.7% |
59.6% |
59.2% |
58.6% |
57.7% |
57.1% |
56.8% |
57.0% |
55.5% |
55.4% |
56.2% |
| (Standard Error) |
(0.5%) |
(0.6%) |
(0.2%) |
(0.4%) |
(0.6%) |
(0.5%) |
(0.5%) |
(0.5%) |
(0.6%) |
(0.6%) |
(0.6%) |
(0.6%) |
(0.6%) |
| 50-99 |
57.4% |
55.6% |
56.3% |
60.1% |
55.9% |
54.9% |
55.4% |
54.7% |
54.5% |
55.8% |
51.2% |
52.2% |
50.3% |
| (Standard Error) |
(1.5%) |
(1.6%) |
(1.0%) |
(1.0%) |
(0.8%) |
(1.0%) |
(1.2%) |
(0.8%) |
(1.3%) |
(1.2%) |
(1.2%) |
(1.2%) |
(1.2%) |
| 100+ |
63.6% |
61.4% |
62.4% |
61.6% |
60.4% |
60.0% |
59.5% |
58.8% |
58.3% |
57.1% |
56.6% |
57.1% |
57.1% |
| (Standard Error) |
(0.6%) |
(0.5%) |
(0.5%) |
(0.6%) |
(0.6%) |
(0.3%) |
(0.4%) |
(0.3%) |
(0.5%) |
(0.5%) |
(0.5%) |
(0.5%) |
(0.5%) |
|
Source: Medical Expenditure Panel Survey-Insurance Component, private-sector establishments, 2005‑2018.
Denominator: Within each category, all employees in establishments that offer health insurance.
Note: Medical Expenditure Panel Survey-Insurance Component estimates are not available for 2007.
|
Return to Table of Contents
Exhibit 2.4: Coverage Rate Percentage (standard error) of private-sector employees who are enrolled in health insurance at establishments that offer health insurance, overall and by detailed firm size, 2005‑2018
| Number of Employees |
2005 |
2006 |
2008 |
2009 |
2010 |
2011 |
2012 |
2013 |
2014 |
2015 |
2016 |
2017 |
2018 |
| U.S. |
62.5% |
60.7% |
61.4% |
61.1% |
59.8% |
59.4% |
58.9% |
58.2% |
57.8% |
57.0% |
56.0% |
56.5% |
56.5% |
| (Standard Error) |
(0.4%) |
(0.3%) |
(0.4%) |
(0.4%) |
(0.5%) |
(0.2%) |
(0.4%) |
(0.3%) |
(0.4%) |
(0.4%) |
(0.4%) |
(0.4%) |
(0.4%) |
| <10 |
66.2% |
66.6% |
65.0% |
62.9% |
64.4% |
63.9% |
62.2% |
61.8% |
61.7% |
61.9% |
60.0% |
60.6% |
61.1% |
| (Standard Error) |
(0.6%) |
(0.8%) |
(0.4%) |
(0.5%) |
(0.5%) |
(0.8%) |
(0.8%) |
(0.4%) |
(0.8%) |
(0.9%) |
(1.1%) |
(1.0%) |
(1.1%) |
| 10-24 |
57.8% |
58.4% |
58.2% |
58.8% |
57.3% |
56.5% |
56.5% |
56.3% |
56.8% |
57.1% |
55.5% |
54.1% |
55.1% |
| (Standard Error) |
(1.0%) |
(0.9%) |
(0.7%) |
(1.0%) |
(0.8%) |
(0.8%) |
(0.8%) |
(0.7%) |
(0.9%) |
(1.0%) |
(1.1%) |
(1.1%) |
(1.1%) |
| 25-99 |
57.4% |
55.9% |
56.3% |
58.9% |
56.2% |
55.7% |
55.2% |
54.4% |
53.8% |
54.5% |
51.8% |
52.5% |
51.7% |
| (Standard Error) |
(1.1%) |
(1.0%) |
(0.6%) |
(0.6%) |
(0.7%) |
(0.7%) |
(0.9%) |
(0.7%) |
(0.9%) |
(0.9%) |
(0.8%) |
(0.8%) |
(0.8%) |
| 100-999 |
60.0% |
59.5% |
59.1% |
59.2% |
57.7% |
57.2% |
56.6% |
55.3% |
56.9% |
55.8% |
54.5% |
54.4% |
56.3% |
| (Standard Error) |
(1.2%) |
(1.1%) |
(0.6%) |
(1.2%) |
(1.1%) |
(0.7%) |
(0.8%) |
(0.6%) |
(0.8%) |
(0.8%) |
(0.8%) |
(0.8%) |
(0.8%) |
| 1,000+ |
65.0% |
62.1% |
63.7% |
62.5% |
61.4% |
61.1% |
60.6% |
60.1% |
58.8% |
57.7% |
57.5% |
58.1% |
57.4% |
| (Standard Error) |
(0.7%) |
(0.7%) |
(0.7%) |
(0.7%) |
(0.6%) |
(0.4%) |
(0.6%) |
(0.5%) |
(0.6%) |
(0.6%) |
(0.6%) |
(0.6%) |
(0.6%) |
|
Source: Medical Expenditure Panel Survey-Insurance Component, private-sector establishments, 2005‑2018.
Denominator: Within each category, all employees in establishments that offer health insurance.
Note: Medical Expenditure Panel Survey-Insurance Component estimates are not available for 2007.
|
Return to Table of Contents
Exhibit 2.5: Eligibility Rate Percentage (standard error) of private-sector employees eligible for health insurance at establishments that offer health insurance, overall and by firm size, 2005‑2018
| Number of Employees |
2005 |
2006 |
2008 |
2009 |
2010 |
2011 |
2012 |
2013 |
2014 |
2015 |
2016 |
2017 |
2018 |
| U.S. |
78.5% |
77.5% |
78.1% |
79.5% |
78.2% |
78.0% |
77.8% |
77.8% |
75.4% |
76.0% |
76.5% |
76.8% |
78.0% |
| (Standard Error) |
(0.5%) |
(0.4%) |
(0.4%) |
(0.3%) |
(0.5%) |
(0.4%) |
(0.3%) |
(0.2%) |
(0.4%) |
(0.4%) |
(0.4%) |
(0.4%) |
(0.4%) |
| <50 |
78.0% |
77.7% |
78.5% |
79.3% |
78.6% |
78.7% |
77.9% |
78.0% |
77.7% |
79.1% |
78.7% |
78.3% |
79.1% |
| (Standard Error) |
(0.7%) |
(0.6%) |
(0.4%) |
(0.5%) |
(0.5%) |
(0.6%) |
(0.5%) |
(0.4%) |
(0.6%) |
(0.6%) |
(0.6%) |
(0.6%) |
(0.6%) |
| 50-99 |
76.6% |
72.3% |
75.3% |
79.2% |
74.5% |
73.6% |
76.4% |
76.2% |
74.1% |
77.8% |
76.2% |
75.5% |
75.6% |
| (Standard Error) |
(1.4%) |
(1.5%) |
(1.3%) |
(0.8%) |
(0.6%) |
(1.0%) |
(1.2%) |
(0.8%) |
(1.4%) |
(1.2%) |
(1.2%) |
(1.2%) |
(1.2%) |
| 100+ |
78.8% |
77.9% |
78.3% |
79.6% |
78.5% |
78.3% |
77.9% |
77.9% |
75.0% |
75.2% |
76.0% |
76.6% |
78.0% |
| (Standard Error) |
(0.6%) |
(0.6%) |
(0.4%) |
(0.5%) |
(0.6%) |
(0.4%) |
(0.3%) |
(0.3%) |
(0.5%) |
(0.5%) |
(0.4%) |
(0.5%) |
(0.5%) |
|
Source: Medical Expenditure Panel Survey-Insurance Component, private-sector establishments, 2005‑2018.
Denominator: Within each category, all employees in establishments that offer health insurance.
Note: Medical Expenditure Panel Survey-Insurance Component estimates are not available for 2007.
|
Return to Table of Contents
Exhibit 2.6: Eligibility Rate Percentage (standard error) of private-sector employees eligible for health insurance at establishments that offer health insurance, overall and by detailed firm size, 2005‑2018
| Number of Employees |
2005 |
2006 |
2008 |
2009 |
2010 |
2011 |
2012 |
2013 |
2014 |
2015 |
2016 |
2017 |
2018 |
| U.S. |
78.5% |
77.5% |
78.1% |
79.5% |
78.2% |
78.0% |
77.8% |
77.8% |
75.4% |
76.0% |
76.5% |
76.8% |
78.0% |
| (Standard Error) |
(0.5%) |
(0.4%) |
(0.4%) |
(0.3%) |
(0.5%) |
(0.4%) |
(0.3%) |
(0.2%) |
(0.4%) |
(0.4%) |
(0.4%) |
(0.4%) |
(0.4%) |
| <10 |
82.2% |
81.9% |
82.2% |
80.7% |
82.1% |
82.2% |
79.9% |
81.2% |
79.9% |
80.3% |
80.6% |
81.8% |
81.4% |
| (Standard Error) |
(0.6%) |
(0.5%) |
(0.5%) |
(0.3%) |
(0.6%) |
(0.8%) |
(0.7%) |
(0.5%) |
(0.8%) |
(0.9%) |
(1.1%) |
(0.8%) |
(1.0%) |
| 10-24 |
77.8% |
76.3% |
78.3% |
79.1% |
78.5% |
77.6% |
77.5% |
77.8% |
79.8% |
79.9% |
79.2% |
77.3% |
78.9% |
| (Standard Error) |
(1.2%) |
(1.2%) |
(1.0%) |
(0.9%) |
(0.7%) |
(1.0%) |
(0.6%) |
(0.6%) |
(0.9%) |
(1.0%) |
(1.1%) |
(1.1%) |
(1.0%) |
| 25-99 |
75.7% |
73.8% |
75.2% |
78.8% |
75.0% |
75.2% |
76.4% |
76.0% |
74.0% |
76.9% |
76.6% |
76.1% |
76.4% |
| (Standard Error) |
(1.2%) |
(0.9%) |
(0.8%) |
(0.5%) |
(0.6%) |
(0.7%) |
(0.9%) |
(0.6%) |
(1.0%) |
(0.9%) |
(0.8%) |
(0.8%) |
(0.8%) |
| 100-999 |
76.1% |
77.2% |
75.4% |
76.8% |
76.0% |
75.1% |
75.0% |
75.3% |
74.5% |
76.8% |
75.8% |
76.7% |
78.0% |
| (Standard Error) |
(0.9%) |
(1.0%) |
(0.7%) |
(1.4%) |
(1.3%) |
(0.4%) |
(0.8%) |
(0.8%) |
(0.9%) |
(0.8%) |
(0.8%) |
(0.7%) |
(0.8%) |
| 1,000+ |
79.8% |
78.2% |
79.4% |
80.5% |
79.4% |
79.5% |
79.0% |
78.9% |
75.2% |
74.8% |
76.2% |
76.6% |
77.9% |
| (Standard Error) |
(0.7%) |
(0.7%) |
(0.5%) |
(0.4%) |
(0.6%) |
(0.5%) |
(0.5%) |
(0.4%) |
(0.6%) |
(0.6%) |
(0.5%) |
(0.6%) |
(0.6%) |
|
Source: Medical Expenditure Panel Survey-Insurance Component, private-sector establishments, 2005‑2018.
Denominator: Within each category, all employees in establishments that offer health insurance.
Note: Medical Expenditure Panel Survey-Insurance Component estimates are not available for 2007.
|
Return to Table of Contents
Exhibit 2.7: Take-Up Rate Percentage (standard error) of eligible private-sector employees who are enrolled in health insurance at establishments that offer health insurance, overall and by firm size, 2005‑2018
| Number of Employees |
2005 |
2006 |
2008 |
2009 |
2010 |
2011 |
2012 |
2013 |
2014 |
2015 |
2016 |
2017 |
2018 |
| U.S. |
79.6% |
78.3% |
78.7% |
76.9% |
76.5% |
76.1% |
75.8% |
74.8% |
76.7% |
75.0% |
73.3% |
73.5% |
72.4% |
| (Standard Error) |
(0.3%) |
(0.3%) |
(0.3%) |
(0.3%) |
(0.2%) |
(0.3%) |
(0.3%) |
(0.2%) |
(0.3%) |
(0.3%) |
(0.3%) |
(0.3%) |
(0.4%) |
| <50 |
77.0% |
77.4% |
76.0% |
75.2% |
75.3% |
74.4% |
74.1% |
73.1% |
73.0% |
72.1% |
70.4% |
70.7% |
71.0% |
| (Standard Error) |
(0.6%) |
(0.7%) |
(0.3%) |
(0.3%) |
(0.6%) |
(0.4%) |
(0.4%) |
(0.6%) |
(0.5%) |
(0.5%) |
(0.5%) |
(0.6%) |
(0.6%) |
| 50-99 |
74.9% |
76.9% |
74.9% |
75.9% |
75.1% |
74.5% |
72.5% |
71.8% |
73.5% |
71.7% |
67.2% |
69.1% |
66.6% |
| (Standard Error) |
(1.2%) |
(1.3%) |
(0.5%) |
(0.9%) |
(0.7%) |
(0.6%) |
(0.8%) |
(1.0%) |
(1.0%) |
(1.1%) |
(1.2%) |
(1.1%) |
(1.1%) |
| 100+ |
80.7% |
78.7% |
79.7% |
77.5% |
76.9% |
76.7% |
76.4% |
75.5% |
77.8% |
76.0% |
74.4% |
74.5% |
73.3% |
| (Standard Error) |
(0.5%) |
(0.4%) |
(0.4%) |
(0.5%) |
(0.3%) |
(0.3%) |
(0.4%) |
(0.3%) |
(0.3%) |
(0.3%) |
(0.4%) |
(0.4%) |
(0.4%) |
|
Source: Medical Expenditure Panel Survey-Insurance Component, private-sector establishments, 2005‑2018.
Denominator: Within each category, eligible employees in establishments that offer health insurance.
Note: Medical Expenditure Panel Survey-Insurance Component estimates are not available for 2007.
|
Return to Table of Contents
Exhibit 2.8: Take-Up Rate Percentage (standard error) of eligible private-sector employees who are enrolled in health insurance at establishments that offer health insurance, overall and by detailed firm size, 2005‑2018
| Number of Employees |
2005 |
2006 |
2008 |
2009 |
2010 |
2011 |
2012 |
2013 |
2014 |
2015 |
2016 |
2017 |
2018 |
| U.S. |
79.6% |
78.3% |
78.7% |
76.9% |
76.5% |
76.1% |
75.8% |
74.8% |
76.7% |
75.0% |
73.3% |
73.5% |
72.4% |
| (Standard Error) |
(0.3%) |
(0.3%) |
(0.3%) |
(0.3%) |
(0.2%) |
(0.3%) |
(0.3%) |
(0.2%) |
(0.3%) |
(0.3%) |
(0.3%) |
(0.3%) |
(0.4%) |
| <10 |
80.5% |
81.3% |
79.2% |
78.0% |
78.5% |
77.7% |
77.9% |
76.1% |
77.2% |
77.1% |
74.4% |
74.0% |
75.0% |
| (Standard Error) |
(0.5%) |
(0.8%) |
(0.5%) |
(0.6%) |
(0.5%) |
(0.7%) |
(0.8%) |
(0.7%) |
(0.8%) |
(0.8%) |
(1.0%) |
(1.0%) |
(1.0%) |
| 10-24 |
74.3% |
76.5% |
74.3% |
74.4% |
73.0% |
72.8% |
73.0% |
72.4% |
71.2% |
71.5% |
70.1% |
69.9% |
69.8% |
| (Standard Error) |
(0.7%) |
(0.7%) |
(0.4%) |
(0.6%) |
(0.5%) |
(0.6%) |
(1.0%) |
(0.7%) |
(0.9%) |
(0.9%) |
(0.9%) |
(1.0%) |
(0.9%) |
| 25-99 |
75.9% |
75.8% |
74.8% |
74.8% |
74.9% |
74.1% |
72.2% |
71.6% |
72.7% |
70.8% |
67.6% |
69.0% |
67.6% |
| (Standard Error) |
(0.9%) |
(0.6%) |
(0.4%) |
(0.7%) |
(0.6%) |
(0.5%) |
(0.4%) |
(1.0%) |
(0.7%) |
(0.7%) |
(0.8%) |
(0.7%) |
(0.7%) |
| 100-999 |
78.9% |
77.1% |
78.4% |
77.0% |
76.0% |
76.2% |
75.5% |
73.4% |
76.4% |
72.7% |
71.9% |
71.0% |
72.1% |
| (Standard Error) |
(1.2%) |
(1.1%) |
(0.2%) |
(0.6%) |
(0.6%) |
(0.8%) |
(0.6%) |
(0.4%) |
(0.6%) |
(0.7%) |
(0.8%) |
(0.8%) |
(0.7%) |
| 1,000+ |
81.4% |
79.3% |
80.2% |
77.6% |
77.3% |
76.8% |
76.8% |
76.2% |
78.3% |
77.2% |
75.4% |
75.9% |
73.7% |
| (Standard Error) |
(0.4%) |
(0.5%) |
(0.6%) |
(0.6%) |
(0.4%) |
(0.4%) |
(0.4%) |
(0.3%) |
(0.4%) |
(0.4%) |
(0.5%) |
(0.4%) |
(0.5%) |
|
Source: Medical Expenditure Panel Survey-Insurance Component, private-sector establishments, 2005‑2018.
Denominator: Within each category, eligible employees in establishments that offer health insurance.
Note: Medical Expenditure Panel Survey-Insurance Component estimates are not available for 2007.
|
Return to Table of Contents
Exhibit 2.9: Coverage Rate Percentage (standard error) of private-sector employees who are enrolled in health insurance, by the percentage of the establishment's workforce that is low wage and by firm size, 2005‑2018
| Low Wage |
2005 |
2006 |
2008 |
2009 |
2010 |
2011 |
2012 |
2013 |
2014 |
2015 |
2016 |
2017 |
2018 |
| <50% Low-Wage Employees, Small Employers |
65.7% |
64.9% |
65.1% |
65.1% |
64.7% |
64.3% |
62.9% |
62.1% |
61.6% |
61.7% |
60.1% |
59.7% |
59.6% |
| (Standard Error) |
(0.5%) |
(0.6%) |
(0.3%) |
(0.4%) |
(0.6%) |
(0.4%) |
(0.5%) |
(0.4%) |
(0.6%) |
(0.6%) |
(0.6%) |
(0.6%) |
(0.6%) |
| 50%+ Low-Wage Employees, Small Employers |
38.2% |
37.6% |
36.4% |
35.5% |
37.2% |
35.8% |
35.5% |
33.3% |
33.5% |
29.8% |
28.2% |
28.9% |
32.6% |
| (Standard Error) |
(1.0%) |
(1.0%) |
(1.0%) |
(0.7%) |
(0.8%) |
(0.6%) |
(0.6%) |
(1.2%) |
(1.5%) |
(1.4%) |
(1.3%) |
(1.3%) |
(1.5%) |
| <50% Low-Wage Employees, Large Employers |
70.2% |
68.6% |
70.0% |
70.0% |
69.3% |
68.8% |
69.0% |
67.5% |
67.8% |
66.3% |
64.1% |
63.8% |
63.0% |
| (Standard Error) |
(0.3%) |
(0.5%) |
(0.3%) |
(0.5%) |
(0.6%) |
(0.4%) |
(0.5%) |
(0.4%) |
(0.4%) |
(0.5%) |
(0.5%) |
(0.5%) |
(0.5%) |
| 50%+ Low-Wage Employees, Large Employers |
39.1% |
39.1% |
38.7% |
38.3% |
34.8% |
33.3% |
32.9% |
33.2% |
30.6% |
26.7% |
27.4% |
29.5% |
30.3% |
| (Standard Error) |
(0.6%) |
(1.0%) |
(0.6%) |
(0.8%) |
(0.9%) |
(0.6%) |
(0.6%) |
(0.6%) |
(0.7%) |
(0.7%) |
(0.7%) |
(0.7%) |
(0.9%)
|
|
Key: Small employer = fewer than 50 employees. Large employer = 50 or more employees.
Source: Medical Expenditure Panel Survey-Insurance Component, private-sector establishments, 2005‑2018.
Denominator: Within each category, all employees in establishments that offer health insurance.
Note: Medical Expenditure Panel Survey-Insurance Component estimates are not available for 2007. Wage levels in the MEPS-IC questionnaires have been adjusted to account for changing wages over time. In 2018, low-wage employees were defined as those earning less than $12.00 per hour.
|
Return to Table of Contents
Exhibit 2.10: Eligibility Rate Percentage (standard error) of private-sector employees eligible for health insurance, by the percentage of the establishment's workforce that is low wage and by firm size, 2005‑2018
| Low Wage |
2005 |
2006 |
2008 |
2009 |
2010 |
2011 |
2012 |
2013 |
2014 |
2015 |
2016 |
2017 |
2018 |
| <50% Low-Wage Employees, Small Employers |
84.0% |
82.5% |
84.1% |
84.3% |
84.0% |
84.3% |
83.2% |
83.3% |
83.0% |
83.8% |
83.8% |
83.0% |
83.0% |
| (Standard Error) |
(0.6%) |
(0.5%) |
(0.2%) |
(0.3%) |
(0.5%) |
(0.4%) |
(0.6%) |
(0.4%) |
(0.5%) |
(0.5%) |
(0.5%) |
(0.5%) |
(0.6%) |
| 50%+ Low-Wage Employees, Small Employers |
54.5% |
55.4% |
54.3% |
57.1% |
57.4% |
56.4% |
55.2% |
52.9% |
52.5% |
51.9% |
49.1% |
49.6% |
53.2% |
| (Standard Error) |
(1.3%) |
(1.3%) |
(0.9%) |
(1.0%) |
(1.0%) |
(1.3%) |
(1.0%) |
(1.5%) |
(1.8%) |
(1.9%) |
(2.0%) |
(1.8%) |
(1.9%) |
| <50% Low-Wage Employees, Large Employers |
84.1% |
83.3% |
84.6% |
85.4% |
85.0% |
85.3% |
85.4% |
84.3% |
84.0% |
83.8% |
83.4% |
83.0% |
83.7% |
| (Standard Error) |
(0.3%) |
(0.5%) |
(0.4%) |
(0.5%) |
(0.7%) |
(0.5%) |
(0.4%) |
(0.3%) |
(0.4%) |
(0.4%) |
(0.4%) |
(0.5%) |
(0.5%) |
| 50%+ Low-Wage Employees, Large Employers |
59.9% |
61.1% |
59.4% |
63.3% |
59.6% |
56.9% |
57.4% |
59.4% |
49.5% |
48.0% |
49.7% |
51.9% |
53.7% |
| (Standard Error) |
(1.2%) |
(1.5%) |
(0.8%) |
(0.9%) |
(0.8%) |
(1.0%) |
(0.5%) |
(0.6%) |
(0.9%) |
(0.9%) |
(0.9%) |
(0.9%) |
(1.1%) |
|
Key: Small employer = fewer than 50 employees. Large employer = 50 or more employees.
Source: Medical Expenditure Panel Survey-Insurance Component, private-sector establishments, 2005‑2018.
Denominator: Within each category, all employees in establishments that offer health insurance.
Note: Medical Expenditure Panel Survey-Insurance Component estimates are not available for 2007. Wage levels in the MEPS-IC questionnaires have been adjusted to account for changing wages over time. In 2018, low-wage employees were defined as those earning less than $12.00 per hour.
|
Return to Table of Contents
Exhibit 2.11: Take-Up Rate Percentage (standard error) of eligible private-sector employees who are enrolled in health insurance, by the percentage of the establishment's workforce that is low wage and by firm size, 2005‑2018
| Low Wage |
2005 |
2006 |
2008 |
2009 |
2010 |
2011 |
2012 |
2013 |
2014 |
2015 |
2016 |
2017 |
2018 |
| <50% Low-Wage Employees, Small Employers |
78.2% |
78.7% |
77.4% |
77.2% |
77.0% |
76.3% |
75.6% |
74.5% |
74.2% |
73.6% |
71.7% |
71.9% |
71.9% |
| (Standard Error) |
(0.7%) |
(0.7%) |
(0.3%) |
(0.4%) |
(0.5%) |
(0.4%) |
(0.2%) |
(0.5%) |
(0.5%) |
(0.5%) |
(0.6%) |
(0.5%) |
(0.6%) |
| 50%+ Low-Wage Employees, Small Employers |
70.1% |
67.9% |
67.0% |
62.1% |
64.9% |
63.5% |
64.3% |
63.0% |
63.9% |
57.4% |
57.5% |
58.3% |
61.3% |
| (Standard Error) |
(1.3%) |
(1.4%) |
(1.7%) |
(1.3%) |
(1.2%) |
(1.1%) |
(1.7%) |
(1.9%) |
(2.1%) |
(2.2%) |
(2.1%) |
(2.3%) |
(2.2%) |
| <50% Low-Wage Employees, Large Employers |
83.4% |
82.4% |
82.8% |
81.9% |
81.5% |
80.7% |
80.8% |
80.0% |
80.7% |
79.1% |
76.9% |
76.9% |
75.2% |
| (Standard Error) |
(0.4%) |
(0.4%) |
(0.2%) |
(0.4%) |
(0.3%) |
(0.4%) |
(0.3%) |
(0.3%) |
(0.3%) |
(0.3%) |
(0.4%) |
(0.4%) |
(0.4%) |
| 50%+ Low-Wage Employees, Large Employers |
65.2% |
64.0% |
65.1% |
60.5% |
58.4% |
58.5% |
57.3% |
55.9% |
61.9% |
55.6% |
55.2% |
57.0% |
56.5% |
| (Standard Error) |
(1.2%) |
(0.9%) |
(0.9%) |
(0.9%) |
(1.0%) |
(0.8%) |
(1.1%) |
(0.5%) |
(0.8%) |
(1.0%) |
(1.0%) |
(1.0%) |
(1.2%) |
|
Key: Small employer = fewer than 50 employees. Large employer = 50 or more employees.
Source: Medical Expenditure Panel Survey-Insurance Component, private-sector establishments, 2005‑2018.
Denominator: Within each category, eligible employees in establishments that offer health insurance.
Note: Medical Expenditure Panel Survey-Insurance Component estimates are not available for 2007. Wage levels in the MEPS-IC questionnaires have been adjusted to account for changing wages over time. In 2018, low-wage employees were defined as those earning less than $12.00 per hour.
|
Return to Table of Contents
Exhibit 2.12: Coverage Rate Percentage (standard error) of private-sector employees who are enrolled in health insurance at establishments that offer health insurance, by State, 2018
| Alabama |
53.6% |
Kentucky |
57.7% |
North Dakota |
61.1%* |
| (Standard Error) |
(3.1%) |
(Standard Error) |
(2.4%) |
(Standard Error) |
(1.7%) |
| Alaska |
59.0% |
Louisiana |
54.5% |
Ohio |
58.3% |
| (Standard Error) |
(2.1%) |
(Standard Error) |
(2.6%) |
(Standard Error) |
(2.0%) |
| Arizona |
54.5% |
Maine |
58.4% |
Oklahoma |
51.6% |
| (Standard Error) |
(2.3%) |
(Standard Error) |
(1.6%) |
(Standard Error) |
(2.6%) |
| Arkansas |
57.5% |
Maryland |
53.2% |
Oregon |
64.5%* |
| (Standard Error) |
(2.9%) |
(Standard Error) |
(1.9%) |
(Standard Error) |
(3.0%) |
| California |
55.6% |
Massachusetts |
51.9% |
Pennsylvania |
56.6% |
| (Standard Error) |
(1.5%) |
(Standard Error) |
(2.3%) |
(Standard Error) |
(1.7%) |
| Colorado |
57.0% |
Michigan |
57.3% |
Rhode Island |
52.0%* |
| (Standard Error) |
(2.1%) |
(Standard Error) |
(2.2%) |
(Standard Error) |
(1.9%) |
| Connecticut |
55.5% |
Minnesota |
58.5% |
South Carolina |
62.0%* |
| (Standard Error) |
(2.5%) |
(Standard Error) |
(2.2%) |
(Standard Error) |
(2.2%) |
| Delaware |
55.7% |
Mississippi |
56.8% |
South Dakota |
55.3% |
| (Standard Error) |
(2.2%) |
(Standard Error) |
(3.3%) |
(Standard Error) |
(2.5%) |
| District of Columbia |
62.3%* |
Missouri |
62.6%* |
Tennessee |
54.2% |
| (Standard Error) |
(2.1%) |
(Standard Error) |
(2.2%) |
(Standard Error) |
(2.1%) |
| Florida |
55.0% |
Montana |
56.7% |
Texas |
61.1%* |
| (Standard Error) |
(2.7%) |
(Standard Error) |
(2.4%) |
(Standard Error) |
(1.4%) |
| Georgia |
57.2% |
Nebraska |
59.7% |
Utah |
62.3%* |
| (Standard Error) |
(2.3%) |
(Standard Error) |
(2.1%) |
(Standard Error) |
(2.4%) |
| Hawaii |
61.6% |
Nevada |
54.7% |
Vermont |
52.1%* |
| (Standard Error) |
(3.1%) |
(Standard Error) |
(3.1%) |
(Standard Error) |
(2.1%) |
| Idaho |
62.0%* |
New Hampshire |
54.6% |
Virginia |
56.9% |
| (Standard Error) |
(2.4%) |
(Standard Error) |
(2.3%) |
(Standard Error) |
(2.2%) |
| Illinois |
56.8% |
New Jersey |
52.8% |
Washington |
62.8%* |
| (Standard Error) |
(2.6%) |
(Standard Error) |
(2.1%) |
(Standard Error) |
(2.5%) |
| Indiana |
57.2% |
New Mexico |
46.9%* |
West Virginia |
51.4%* |
| (Standard Error) |
(2.8%) |
(Standard Error) |
(2.0%) |
(Standard Error) |
(2.3%) |
| Iowa |
55.5% |
New York |
49.6%* |
Wisconsin |
57.1% |
| (Standard Error) |
(2.0%) |
(Standard Error) |
(1.7%) |
(Standard Error) |
(2.2%) |
| Kansas |
52.5% |
North Carolina |
58.8% |
Wyoming |
54.4% |
| (Standard Error) |
(2.6%) |
(Standard Error) |
(2.3%) |
(Standard Error) |
(2.9%) |
|
Source: Medical Expenditure Panel Survey-Insurance Component, private-sector establishments, 2018.
Denominator: Within each state, all employees in establishments that offer health insurance.
Note: * Statistically different from national average of 56.5 percent at p < 0.05. Note that the standard error on the national estimate of 56.5 percent is 0.41.
|
Return to Table of Contents
Exhibit 2.13: Coverage Rate Percentage (standard error) of private-sector employees who are enrolled in health insurance at establishments that offer health insurance, overall and by industry, 2018
| Industry |
Percentage |
| United States |
56.5% |
| (Standard Error) |
(0.4%) |
| Agriculture, fisheries, forestry |
45.7% |
| (Standard Error) |
(7.2%) |
| Mining and manufacturing |
76.8% |
| (Standard Error) |
(0.6%) |
| Construction |
59.9% |
| (Standard Error) |
(1.6%) |
| Utilities and transportation |
67.5% |
| (Standard Error) |
(1.8%) |
| Wholesale trade |
73.5% |
| (Standard Error) |
(1.0%) |
| Financial services and real estate |
71.9% |
| (Standard Error) |
(0.9%) |
| Retail trade |
42.1% |
| (Standard Error) |
(1.0%) |
| Professional services |
60.6% |
| (Standard Error) |
(0.6%) |
| Other services |
36.3% |
| (Standard Error) |
(0.9%) |
|
Source: Medical Expenditure Panel Survey-Insurance Component, private-sector establishments, 2018.
Denominator: Within each category, all employees in establishments that offer health insurance.
|
Return to Table of Contents
Exhibit 2.14: Eligibility Rate Percentage (standard error) of private-sector employees eligible for health insurance at establishments that offer health insurance, overall and by industry, 2018
| Industry |
Percentage |
| United States |
78.0% |
| (Standard Error) |
(0.4%) |
| Agriculture, fisheries, forestry |
75.6% |
| (Standard Error) |
(8.9%) |
| Mining and manufacturing |
94.5% |
| (Standard Error) |
(0.3%) |
| Construction |
84.1% |
| (Standard Error) |
(1.4%) |
| Utilities and transportation |
89.1% |
| (Standard Error) |
(1.4%) |
| Wholesale trade |
92.9% |
| (Standard Error) |
(0.9%) |
| Financial services and real estate |
91.8% |
| (Standard Error) |
(0.7%) |
| Retail trade |
65.0% |
| (Standard Error) |
(1.2%) |
| Professional services |
81.7% |
| (Standard Error) |
(0.5%) |
| Other services |
59.5% |
| (Standard Error) |
(1.1%) |
|
Source: Medical Expenditure Panel Survey-Insurance Component, private-sector establishments, 2018.
Denominator: Within each category, all employees in establishments that offer health insurance.
|
Return to Table of Contents
Exhibit 2.15: Take-Up Rate Percentage (standard error) of eligible private-sector employees who are enrolled in health insurance at establishments that offer health insurance, overall and by industry, 2018
| Industry |
Percentage |
| United States |
72.4% |
| (Standard Error) |
(0.4%) |
| Agriculture, fisheries, forestry |
60.5% |
| (Standard Error) |
(8.2%) |
| Mining and manufacturing |
81.3% |
| (Standard Error) |
(0.6%) |
| Construction |
71.2% |
| (Standard Error) |
(1.5%) |
| Utilities and transportation |
75.8% |
| (Standard Error) |
(1.8%) |
| Wholesale trade |
79.1% |
| (Standard Error) |
(0.9%) |
| Financial services and real estate |
78.3% |
| (Standard Error) |
(0.8%) |
| Retail trade |
64.8% |
| (Standard Error) |
(1.1%) |
| Professional services |
74.1% |
| (Standard Error) |
(0.5%) |
| Other services |
61.0% |
| (Standard Error) |
(1.1%) |
|
Source: Medical Expenditure Panel Survey-Insurance Component, private-sector establishments, 2018.
Denominator: Within each category, eligible employees in establishments that offer health insurance.
|
Return to Table of Contents
Exhibit 2.16: Coverage Rate Percentage (standard error) of private-sector employees who are enrolled in health insurance at establishments that offer health insurance, overall and by selected characteristics, 2018
| Employer Characteristics |
Percentage |
| United States |
56.5% |
| (Standard Error) |
(0.4%) |
| Ownership: For Profit Inc. |
57.0% |
| (Standard Error) |
(0.5%) |
| Ownership: For Profit Uninc. |
51.2% |
| (Standard Error) |
(1.0%) |
| Ownership: Nonprofit |
58.8% |
| (Standard Error) |
(0.8%) |
| Firm Age: 0-4 Years |
50.4% |
| (Standard Error) |
(1.8%) |
| Firm Age: 5-9 Years |
51.5% |
| (Standard Error) |
(1.8%) |
| Firm Age: 10-19 Years |
52.0% |
| (Standard Error) |
(1.1%) |
| Firm Age: 20+ Years |
57.6% |
| (Standard Error) |
(0.5%) |
| # of Locations: 2+ Locations |
57.9% |
| (Standard Error) |
(0.5%) |
| # of Locations: 1 Location |
53.1% |
| (Standard Error) |
(0.7%) |
| % Full Time: 0-24% |
13.2% |
| (Standard Error) |
(0.9%) |
| % Full Time: 25-49% |
25.1% |
| (Standard Error) |
(0.8%) |
| % Full Time: 50-74% |
42.1% |
| (Standard Error) |
(0.9%) |
| % Full Time: 75%+ |
65.6% |
| (Standard Error) |
(0.5%) |
| % Low Wage: 50%+ |
30.6% |
| (Standard Error) |
(0.8%) |
| % Low Wage: <50% |
62.4% |
| (Standard Error) |
(0.4%) |
|
Source: Medical Expenditure Panel Survey-Insurance Component, private-sector establishments, 2018.
Denominator: Within each category, all employees in establishments that offer health insurance.
Note: "% Full Time" refers to the percentage of the establishment's workforce that worked full time in 2018. "% Low Wage" refers to the percentage of the establishment's workforce that earned less than $12.00 per hour in 2018.
|
Return to Table of Contents
Exhibit 2.17: Eligibility Rate Percentage (standard error) of private-sector employees eligible for health insurance at establishments that offer health insurance, overall and by selected characteristics, 2018
| Employer Characteristics |
Percentage |
| United States |
78.0% |
| (Standard Error) |
(0.4%) |
| Ownership: For Profit Inc. |
78.9% |
| (Standard Error) |
(0.5%) |
| Ownership: For Profit Uninc. |
74.9% |
| (Standard Error) |
(0.9%) |
| Ownership: Nonprofit |
76.9% |
| (Standard Error) |
(0.8%) |
| Firm Age: 0-4 Years |
74.4% |
| (Standard Error) |
(1.7%) |
| Firm Age: 5-9 Years |
75.5% |
| (Standard Error) |
(1.6%) |
| Firm Age: 10-19 Years |
78.5% |
| (Standard Error) |
(0.9%) |
| Firm Age: 20+ Years |
78.2% |
| (Standard Error) |
(0.5%) |
| # of Locations: 2+ Locations |
78.4% |
| (Standard Error) |
(0.5%) |
| # of Locations: 1 Location |
76.8% |
| (Standard Error) |
(0.7%) |
| % Full Time: 0-24% |
27.7% |
| (Standard Error) |
(1.4%) |
| % Full Time: 25-49% |
42.0% |
| (Standard Error) |
(0.8%) |
| % Full Time: 50-74% |
65.2% |
| (Standard Error) |
(0.7%) |
| % Full Time: 75%+ |
87.9% |
| (Standard Error) |
(0.4%) |
| % Low Wage: 50%+ |
53.6% |
| (Standard Error) |
(1.0%) |
| % Low Wage: <50% |
83.6% |
| (Standard Error) |
(0.4%) |
|
Source: Medical Expenditure Panel Survey-Insurance Component, private-sector establishments, 2018.
Denominator: Within each category, all employees in establishments that offer health insurance.
Note: "% Full Time" refers to the percentage of the establishment's workforce that worked full time in 2018. "% Low Wage" refers to the percentage of the establishment's workforce that earned less than $12.00 per hour in 2018.
|
Return to Table of Contents
Exhibit 2.18: Take-Up Rate Percentage (standard error) of eligible private-sector employees who are enrolled in health insurance at establishments that offer health insurance, overall and by selected characteristics, 2018
| Employer Characteristics |
Percentage |
| United States |
72.4% |
| (Standard Error) |
(0.4%) |
| Ownership: For Profit Inc. |
72.3% |
| (Standard Error) |
(0.4%) |
| Ownership: For Profit Uninc. |
68.3% |
| (Standard Error) |
(1.0%) |
| Ownership: Nonprofit |
76.5% |
| (Standard Error) |
(0.6%) |
| Firm Age: 0-4 Years |
67.8% |
| (Standard Error) |
(1.7%) |
| Firm Age: 5-9 Years |
68.2% |
| (Standard Error) |
(1.5%) |
| Firm Age: 10-19 Years |
66.3% |
| (Standard Error) |
(1.3%) |
| Firm Age: 20+ Years |
73.7% |
| (Standard Error) |
(0.4%) |
| # of Locations: 2+ Locations |
73.8% |
| (Standard Error) |
(0.4%) |
| # of Locations: 1 Location |
69.2% |
| (Standard Error) |
(0.6%) |
| % Full Time: 0-24% |
47.5% |
| (Standard Error) |
(2.5%) |
| % Full Time: 25-49% |
59.6% |
| (Standard Error) |
(1.5%) |
| % Full Time: 50-74% |
64.6% |
| (Standard Error) |
(1.1%) |
| % Full Time: 75%+ |
74.7% |
| (Standard Error) |
(0.4%) |
| % Low Wage: 50%+ |
57.0% |
| (Standard Error) |
(1.1%) |
| % Low Wage: <50% |
74.7% |
| (Standard Error) |
(0.4%) |
|
Source: Medical Expenditure Panel Survey-Insurance Component, private-sector establishments, 2018.
Denominator: Within each category, all employees in establishments that offer health insurance.
Note: "% Full Time" refers to the percentage of the establishment's workforce that worked full time in 2018. "% Low Wage" refers to the percentage of the establishment's workforce that earned less than $12.00 per hour in 2018.
|
Return to Table of Contents
Exhibit 2.19 Percentage (standard error) of private-sector employees enrolled in a health insurance plan who take single coverage, overall and by firm size, 2005‑2018
| Number of Employees |
2005 |
2006 |
2008 |
2009 |
2010 |
2011 |
2012 |
2013 |
2014 |
2015 |
2016 |
2017 |
2018 |
| U.S. |
48.6% |
48.9% |
50.2% |
50.0% |
51.3% |
50.2% |
51.3% |
51.3% |
52.4% |
53.5% |
55.3% |
54.6% |
55.2% |
| (Standard Error) |
(0.3%) |
(0.2%) |
(0.4%) |
(0.2%) |
(0.3%) |
(0.3%) |
(0.3%) |
(0.2%) |
(0.3%) |
(0.3%) |
(0.3%) |
(0.3%) |
(0.3%) |
| <50 |
58.6% |
57.7% |
60.7% |
58.8% |
60.3% |
60.8% |
61.4% |
62.5% |
61.5% |
63.5% |
62.8% |
63.5% |
63.2% |
| (Standard Error) |
(0.6%) |
(0.7%) |
(0.5%) |
(0.5%) |
(0.6%) |
(0.7%) |
(0.5%) |
(0.7%) |
(0.6%) |
(0.6%) |
(0.6%) |
(0.6%) |
(0.6%) |
| 50-99 |
56.8% |
57.9% |
58.5% |
56.7% |
57.6% |
58.6% |
58.1% |
59.4% |
60.8% |
61.7% |
63.3% |
63.3% |
64.6% |
| (Standard Error) |
(0.9%) |
(0.8%) |
(0.6%) |
(1.1%) |
(1.2%) |
(0.9%) |
(0.6%) |
(0.8%) |
(1.0%) |
(1.0%) |
(1.0%) |
(1.0%) |
(0.9%) |
| 100+ |
45.4% |
45.8% |
46.9% |
47.2% |
48.6% |
47.1% |
48.5% |
48.1% |
49.7% |
50.8% |
53.1% |
52.1% |
52.9% |
| (Standard Error) |
(0.3%) |
(0.2%) |
(0.4%) |
(0.2%) |
(0.3%) |
(0.4%) |
(0.3%) |
(0.2%) |
(0.4%) |
(0.3%) |
(0.3%) |
(0.3%) |
(0.3%) |
|
Source: Medical Expenditure Panel Survey-Insurance Component, private-sector establishments, 2005‑2018.
Note: Medical Expenditure Panel Survey-Insurance Component estimates are not available for 2007.
|
Return to Table of Contents
Exhibit 2.20 Percentage (standard error) of private-sector employees enrolled in a health insurance plan who take employee-plus-one coverage, overall and by firm size, 2005‑2018
| Number of Employees |
2005 |
2006 |
2008 |
2009 |
2010 |
2011 |
2012 |
2013 |
2014 |
2015 |
2016 |
2017 |
2018 |
| U.S. |
17.3% |
18.0% |
18.0% |
19.5% |
18.3% |
18.9% |
18.1% |
18.9% |
18.3% |
18.4% |
17.8% |
19.0% |
18.6% |
| (Standard Error) |
(0.2%) |
(0.1%) |
(0.2%) |
(0.2%) |
(0.2%) |
(0.2%) |
(0.2%) |
(0.1%) |
(0.2%) |
(0.2%) |
(0.2%) |
(0.2%) |
(0.2%) |
| <50 |
13.7% |
13.7% |
13.3% |
14.6% |
13.8% |
14.3% |
14.0% |
13.4% |
13.8% |
13.7% |
14.5% |
13.9% |
14.8% |
| (Standard Error) |
(0.3%) |
(0.3%) |
(0.3%) |
(0.4%) |
(0.3%) |
(0.2%) |
(0.4%) |
(0.2%) |
(0.3%) |
(0.4%) |
(0.4%) |
(0.4%) |
(0.4%) |
| 50-99 |
14.9% |
14.2% |
15.4% |
17.7% |
15.9% |
16.4% |
16.7% |
16.6% |
15.8% |
16.2% |
16.3% |
15.8% |
16.1% |
| (Standard Error) |
(0.7%) |
(0.6%) |
(0.5%) |
(0.8%) |
(0.6%) |
(0.5%) |
(0.5%) |
(0.6%) |
(0.6%) |
(0.6%) |
(0.6%) |
(0.6%) |
(0.5%) |
| 100+ |
18.5% |
19.4% |
19.4% |
20.9% |
19.6% |
20.1% |
19.2% |
20.3% |
19.5% |
19.5% |
18.6% |
20.2% |
19.6% |
| (Standard Error) |
(0.3%) |
(0.2%) |
(0.2%) |
(0.2%) |
(0.3%) |
(0.3%) |
(0.2%) |
(0.1%) |
(0.2%) |
(0.2%) |
(0.2%) |
(0.2%) |
(0.2%) |
|
Source: Medical Expenditure Panel Survey-Insurance Component, private-sector establishments, 2005‑2018.
Note: Medical Expenditure Panel Survey-Insurance Component estimates are not available for 2007.
|
Return to Table of Contents
Exhibit 2.21 Percentage (standard error) of private-sector employees enrolled in a health insurance plan who take family coverage, overall and by firm size, 2005‑2018
| Number of Employees |
2005 |
2006 |
2008 |
2009 |
2010 |
2011 |
2012 |
2013 |
2014 |
2015 |
2016 |
2017 |
2018 |
| U.S. |
34.0% |
33.2% |
31.8% |
30.5% |
30.3% |
30.9% |
30.6% |
29.8% |
29.3% |
28.1% |
26.8% |
26.5% |
26.2% |
| (Standard Error) |
(0.3%) |
(0.3%) |
(0.2%) |
(0.3%) |
(0.3%) |
(0.3%) |
(0.3%) |
(0.2%) |
(0.3%) |
(0.2%) |
(0.3%) |
(0.3%) |
(0.2%) |
| <50 |
27.7% |
28.7% |
26.0% |
26.6% |
25.8% |
24.9% |
24.6% |
24.0% |
24.7% |
22.8% |
22.7% |
22.6% |
22.0% |
| (Standard Error) |
(0.3%) |
(0.5%) |
(0.3%) |
(0.5%) |
(0.4%) |
(0.6%) |
(0.4%) |
(0.6%) |
(0.5%) |
(0.5%) |
(0.5%) |
(0.6%) |
(0.5%) |
| 50-99 |
28.3% |
28.0% |
26.1% |
25.5% |
26.5% |
25.1% |
25.2% |
24.0% |
23.4% |
22.1% |
20.4% |
20.9% |
19.3% |
| (Standard Error) |
(1.0%) |
(0.9%) |
(0.7%) |
(0.7%) |
(0.9%) |
(1.0%) |
(0.7%) |
(0.5%) |
(0.8%) |
(0.9%) |
(0.9%) |
(0.9%) |
(0.8%) |
| 100+ |
36.2% |
34.8% |
33.7% |
31.9% |
31.8% |
32.8% |
32.4% |
31.6% |
30.8% |
29.7% |
28.2% |
27.7% |
27.5% |
| (Standard Error) |
(0.3%) |
(0.3%) |
(0.3%) |
(0.3%) |
(0.4%) |
(0.3%) |
(0.3%) |
(0.2%) |
(0.3%) |
(0.3%) |
(0.3%) |
(0.3%) |
(0.3%) |
|
Source: Medical Expenditure Panel Survey-Insurance Component, private-sector establishments, 2005‑2018.
Note: Medical Expenditure Panel Survey-Insurance Component estimates are not available for 2007.
|
Return to Table of Contents
Exhibit 2.22 Percentage (standard error) of private-sector employees enrolled in a health insurance plan who take single coverage, overall and by detailed firm size, 2005‑2018
| Number of Employees |
2005 |
2006 |
2008 |
2009 |
2010 |
2011 |
2012 |
2013 |
2014 |
2015 |
2016 |
2017 |
2018 |
| U.S. |
48.6% |
48.9% |
50.2% |
50.0% |
51.3% |
50.2% |
51.3% |
51.3% |
52.4% |
53.5% |
55.3% |
54.6% |
55.2% |
| (Standard Error) |
(0.3%) |
(0.2%) |
(0.4%) |
(0.2%) |
(0.3%) |
(0.3%) |
(0.3%) |
(0.2%) |
(0.3%) |
(0.3%) |
(0.3%) |
(0.3%) |
(0.3%) |
| <10 |
58.2% |
59.5% |
61.7% |
59.2% |
60.9% |
61.2% |
63.3% |
63.7% |
63.4% |
62.8% |
63.7% |
62.2% |
61.9% |
| (Standard Error) |
(0.5%) |
(1.1%) |
(0.5%) |
(0.8%) |
(0.7%) |
(0.7%) |
(1.2%) |
(0.6%) |
(0.9%) |
(1.1%) |
(1.1%) |
(1.2%) |
(1.2%) |
| 10-24 |
57.9% |
57.4% |
62.1% |
59.2% |
60.2% |
61.9% |
61.2% |
62.8% |
61.4% |
63.9% |
61.3% |
63.6% |
65.2% |
| (Standard Error) |
(0.9%) |
(1.0%) |
(0.9%) |
(0.5%) |
(0.9%) |
(0.8%) |
(0.8%) |
(1.0%) |
(0.9%) |
(1.0%) |
(1.1%) |
(1.1%) |
(1.0%) |
| 25-99 |
58.2% |
56.9% |
58.2% |
57.3% |
58.6% |
58.8% |
58.9% |
60.1% |
60.4% |
62.5% |
63.4% |
63.8% |
63.5% |
| (Standard Error) |
(0.8%) |
(0.7%) |
(0.5%) |
(0.8%) |
(0.8%) |
(0.6%) |
(0.5%) |
(0.7%) |
(0.7%) |
(0.7%) |
(0.7%) |
(0.7%) |
(0.7%) |
| 100-999 |
51.0% |
51.7% |
52.8% |
53.5% |
53.5% |
53.5% |
54.5% |
55.0% |
55.0% |
57.1% |
59.2% |
57.7% |
58.2% |
| (Standard Error) |
(0.7%) |
(0.8%) |
(0.7%) |
(0.8%) |
(0.5%) |
(0.5%) |
(0.4%) |
(0.5%) |
(0.6%) |
(0.6%) |
(0.6%) |
(0.6%) |
(0.6%) |
| 1,000+ |
43.3% |
43.7% |
44.8% |
45.1% |
46.9% |
44.9% |
46.4% |
45.8% |
47.8% |
48.5% |
50.8% |
50.1% |
50.9% |
| (Standard Error) |
(0.4%) |
(0.3%) |
(0.5%) |
(0.4%) |
(0.4%) |
(0.5%) |
(0.3%) |
(0.4%) |
(0.4%) |
(0.3%) |
(0.3%) |
(0.4%) |
(0.4%) |
|
Source: Medical Expenditure Panel Survey-Insurance Component, private-sector establishments, 2005‑2018.
Note: Medical Expenditure Panel Survey-Insurance Component estimates are not available for 2007.
|
Return to Table of Contents
Exhibit 2.23 Percentage (standard error) of private-sector employees enrolled in a health insurance plan who take employee-plus-one coverage, overall and by detailed firm size, 2005‑2018
| Number of Employees |
2005 |
2006 |
2008 |
2009 |
2010 |
2011 |
2012 |
2013 |
2014 |
2015 |
2016 |
2017 |
2018 |
| U.S. |
17.3% |
18.0% |
18.0% |
19.5% |
18.3% |
18.9% |
18.1% |
18.9% |
18.3% |
18.4% |
17.8% |
19.0% |
18.6% |
| (Standard Error) |
(0.2%) |
(0.1%) |
(0.2%) |
(0.2%) |
(0.2%) |
(0.2%) |
(0.2%) |
(0.1%) |
(0.2%) |
(0.2%) |
(0.2%) |
(0.2%) |
(0.2%) |
| <10 |
13.2% |
12.0% |
12.7% |
13.4% |
13.0% |
13.5% |
13.3% |
12.3% |
12.5% |
12.6% |
13.0% |
13.7% |
15.2% |
| (Standard Error) |
(0.6%) |
(0.4%) |
(0.4%) |
(0.4%) |
(0.6%) |
(0.3%) |
(0.5%) |
(0.4%) |
(0.6%) |
(0.7%) |
(0.7%) |
(0.8%) |
(0.8%) |
| 10-24 |
13.4% |
14.3% |
12.5% |
14.6% |
14.0% |
13.8% |
13.6% |
13.2% |
13.8% |
13.2% |
14.2% |
13.5% |
13.1% |
| (Standard Error) |
(0.5%) |
(0.3%) |
(0.5%) |
(0.6%) |
(0.4%) |
(0.4%) |
(0.7%) |
(0.5%) |
(0.5%) |
(0.6%) |
(0.6%) |
(0.6%) |
(0.5%) |
| 25-99 |
14.7% |
14.4% |
15.3% |
16.8% |
15.3% |
16.1% |
16.0% |
15.9% |
15.4% |
15.8% |
16.1% |
15.2% |
16.2% |
| (Standard Error) |
(0.3%) |
(0.4%) |
(0.4%) |
(0.4%) |
(0.4%) |
(0.3%) |
(0.5%) |
(0.3%) |
(0.4%) |
(0.4%) |
(0.4%) |
(0.4%) |
(0.4%) |
| 100-999 |
15.2% |
15.7% |
16.7% |
17.7% |
17.1% |
18.2% |
17.0% |
16.9% |
18.1% |
17.9% |
17.3% |
18.4% |
16.6% |
| (Standard Error) |
(0.5%) |
(0.3%) |
(0.2%) |
(0.6%) |
(0.5%) |
(0.5%) |
(0.4%) |
(0.3%) |
(0.5%) |
(0.4%) |
(0.4%) |
(0.4%) |
(0.4%) |
| 1,000+ |
19.7% |
20.8% |
20.4% |
22.0% |
20.5% |
20.8% |
19.9% |
21.4% |
20.0% |
20.1% |
19.2% |
20.8% |
20.7% |
| (Standard Error) |
(0.4%) |
(0.3%) |
(0.3%) |
(0.3%) |
(0.3%) |
(0.3%) |
(0.2%) |
(0.2%) |
(0.3%) |
(0.2%) |
(0.3%) |
(0.3%) |
(0.2%) |
|
Source: Medical Expenditure Panel Survey-Insurance Component, private-sector establishments, 2005‑2018.
Note: Medical Expenditure Panel Survey-Insurance Component estimates are not available for 2007.
|
Return to Table of Contents
Exhibit 2.24 Percentage (standard error) of private-sector employees enrolled in a health insurance plan who take family coverage, overall and by detailed firm size, 2005‑2018
| Number of Employees |
2005 |
2006 |
2008 |
2009 |
2010 |
2011 |
2012 |
2013 |
2014 |
2015 |
2016 |
2017 |
2018 |
| U.S. |
34.0% |
33.2% |
31.8% |
30.5% |
30.3% |
30.9% |
30.6% |
29.8% |
29.3% |
28.1% |
26.8% |
26.5% |
26.2% |
| (Standard Error) |
(0.3%) |
(0.3%) |
(0.2%) |
(0.3%) |
(0.3%) |
(0.3%) |
(0.3%) |
(0.2%) |
(0.3%) |
(0.2%) |
(0.3%) |
(0.3%) |
(0.2%) |
| <10 |
28.6% |
28.4% |
25.6% |
27.3% |
26.1% |
25.3% |
23.4% |
24.0% |
24.1% |
24.6% |
23.3% |
24.0% |
22.9% |
| (Standard Error) |
(0.6%) |
(0.9%) |
(0.3%) |
(0.6%) |
(0.6%) |
(0.7%) |
(0.9%) |
(0.5%) |
(0.8%) |
(1.0%) |
(1.0%) |
(1.1%) |
(1.1%) |
| 10-24 |
28.7% |
28.2% |
25.4% |
26.2% |
25.7% |
24.3% |
25.3% |
24.0% |
24.8% |
22.9% |
24.5% |
23.0% |
21.7% |
| (Standard Error) |
(0.8%) |
(1.0%) |
(0.8%) |
(0.5%) |
(0.7%) |
(0.7%) |
(0.8%) |
(0.8%) |
(0.9%) |
(0.9%) |
(1.0%) |
(1.0%) |
(0.9%) |
| 25-99 |
27.0% |
28.7% |
26.5% |
25.9% |
26.1% |
25.1% |
25.1% |
24.0% |
24.2% |
21.7% |
20.5% |
21.0% |
20.3% |
| (Standard Error) |
(0.9%) |
(0.6%) |
(0.6%) |
(0.5%) |
(0.6%) |
(0.6%) |
(0.5%) |
(0.6%) |
(0.6%) |
(0.6%) |
(0.6%) |
(0.6%) |
(0.6%) |
| 100-999 |
33.8% |
32.6% |
30.5% |
28.8% |
29.5% |
28.3% |
28.5% |
28.1% |
26.8% |
25.0% |
23.5% |
23.9% |
25.2% |
| (Standard Error) |
(0.9%) |
(0.7%) |
(0.8%) |
(0.7%) |
(0.5%) |
(0.5%) |
(0.6%) |
(0.6%) |
(0.6%) |
(0.5%) |
(0.5%) |
(0.5%) |
(0.6%) |
| 1,000+ |
37.0% |
35.5% |
34.9% |
32.9% |
32.6% |
34.3% |
33.7% |
32.7% |
32.2% |
31.5% |
30.0% |
29.1% |
28.4% |
| (Standard Error) |
(0.5%) |
(0.4%) |
(0.4%) |
(0.4%) |
(0.5%) |
(0.3%) |
(0.3%) |
(0.3%) |
(0.4%) |
(0.3%) |
(0.4%) |
(0.4%) |
(0.3%) |
|
Source: Medical Expenditure Panel Survey-Insurance Component, private-sector establishments, 2005‑2018.
Note: Medical Expenditure Panel Survey-Insurance Component estimates are not available for 2007.
|
Return to Table of Contents
In 2018, average annual health insurance premiums per enrolled employee with private-sector employer coverage were $6,715 for single coverage, $13,425 for employee-plus-one coverage, and $19,565 for family coverage. These amounts represent increases of 5.4 percent for single coverage, 5.0 percent for employee-plus-one coverage, and 4.7 percent for family coverage over 2017 levels.
Between 2005 and 2018, premiums for the three types of coverage grew by between 68.3 percent and 82.4 percent, with average annual growth rates between 4.1 percent and 4.7 percent. In 2018, nine States had average annual premiums that were lower than the national average and four States had average annual premiums that were higher than the national average for all three types of coverage.
This section presents information on recent growth rates in total premiums for single, employee-plus-one, and family coverage and trends in growth rates from 2005 to 2018, overall and by firm size. This section also examines variation in premiums in 2018 by firm size, State where the employer is located, industry, and other employer characteristics. Finally, this section presents information on the distribution of premiums, overall and by firm size.
Premium Growth Rates: Comparison of 2017-2018 With Recent Years
- Average health insurance premiums in 2018 were $6,715 (single coverage), $13,425 (employee-plus-one coverage), and $19,565 (family coverage), representing increases from 2017 levels of 5.4 percent for single coverage, 5.0 percent for employee-plus-one coverage, and 4.7 percent for family coverage (Exhibits 3.1 and 3.2).
- There were no significant differences between the 2017 to 2018 and 2016 to 2017 growth rates for single coverage (5.4 percent vs. 4.4 percent), employee-plus-one coverage (5.0 percent vs. 5.5 percent), or family coverage (4.7 percent vs. 5.5 percent) (Exhibit 3.2).
Premium Growth Rates From 2005 to 2018
- Between 2005 and 2018, premiums for all types of coverage increased substantially but growth was fastest for family coverage, and premiums grew faster for employee-plus-one than for single coverage. Premiums grew by 82.4 percent for family coverage ($10,728 to $19,565), 75.0 percent for employee-plus-one coverage ($7,671 to $13,425), and 68.3 percent for single coverage ($3,991 to $6,715) (Exhibit 3.1).
- In the 13 years from 2005 to 2018, annual premium growth rates ranged from 2.2 percent to 8.3 percent for family coverage, from 2.6 percent to 6.9 percent for employee-plus-one coverage, and from 2.2 percent to 6.5 percent for single coverage (Exhibit 3.2).
- There was no significant difference between the 2017 to 2018 growth rate and the average annual growth rate from 2005 to 2018 for employee-plus-one coverage (5.0 percent vs. 4.4 percent) or family coverage (4.7 percent for both growth rates) (Exhibit 3.2; data on average annual growth rates not shown).
- For single premiums, the growth rate from 2017 to 2018 (5.4 percent) was greater than the average annual growth rate from 2005 to 2018 (4.1 percent) (Exhibit 3.2; data on average annual growth rates not shown).
Premiums by Firm Size, 2005 to 2018
- From 2005 to 2018, premiums grew more rapidly in large firms (100 or more employees) than in medium (50-99 employees) and small firms (fewer than 50 employees) for single coverage (71.4 percent vs. 58.7 and 61.8 percent, respectively); employee-plus-one coverage (77.2 percent vs. 64.7 and 66.4 percent, respectively); and family coverage (84.3 percent vs. 73.1 and 72.1 percent, respectively; p <0.10 for the difference between large and medium firms) (Exhibits 3.3, 3.4, and 3.5, data on growth rates not shown).
- In 2018, average single premiums were lower in medium firms ($6,287) than in small ($6,667) or large firms ($6,770) (Exhibit 3.3).
- Premiums for dependent coverage were highest in large firms in 2018. Specifically, premiums were higher in large firms than in medium and small firms for employee-plus-one coverage ($13,537 vs. $12,593 and $13,044, respectively) and family coverage ($19,824 vs. $18,386 and $18,296, respectively) (Exhibits 3.4 and 3.5).
- Estimates by detailed firm-size categories show that in 2018, the largest firms (1,000 or more employees) had higher average family premiums ($19,948) than firms with 25-99 employees ($18,181), 10-24 employees ($18,961), and fewer than 10 employees ($17,922) (Exhibit 3.6).
Premiums by State, 2018
- In total, 14 States had average annual premiums for single coverage that were significantly lower than the national average of $6,715: Alabama, Arizona, Arkansas, California, Colorado, Hawaii, Idaho, Kansas, Michigan, Mississippi, Nevada, North Carolina, Tennessee, and Utah. Nine States had average annual single premiums that were significantly higher than the national average: Alaska, Connecticut, District of Columbia, Illinois, Massachusetts, New Hampshire, New Jersey, New York, and Rhode Island (Exhibit 3.7).
- Thirteen States had average annual premiums for employee-plus-one coverage that were significantly lower than the national average of $13,425: Alabama, Arizona, Arkansas, Colorado, Idaho, Mississippi, Nevada, North Carolina, North Dakota, Oregon, Tennessee, Utah, and Wyoming. Eight States had average annual employee-plus-one premiums that were significantly above the national average: Alaska, District of Columbia, Massachusetts, New Hampshire, New Jersey, New York, Pennsylvania, and Wisconsin (Exhibit 3.8).
- In 2018, the average annual family premium was $19,565. Fifteen States had average annual family premiums that were significantly lower than the national average: Alabama, Arkansas, Colorado, Georgia, Hawaii, Idaho, Iowa, Michigan, Mississippi, Nevada, New Mexico, North Carolina, North Dakota, Tennessee, and Utah. Five States had family premiums that were significantly above the national average: Alaska, Connecticut, District of Columbia, New Jersey, and New York (Exhibit 3.9).
- In 2018, average annual premiums for single, employee-plus-one, and family coverage were $6,715, $13,425, and $19,565, respectively. Nine States had average annual premiums that were significantly lower than the national average for all three types of coverage: Alabama, Arkansas, Colorado, Idaho, Mississippi, Nevada, North Carolina, Tennessee, and Utah. Four States (Alaska, District of Columbia, New Jersey, and New York) had average annual premiums that were significantly higher than the national average for all three types of coverage (Exhibits 3.7, 3.8, and 3.9).
Premiums by Industry Category, 2018
- In 2018, enrolled employees in professional services had higher average single premiums ($7,168), employee-plus-one premiums ($14,168), and family premiums ($20,542) than enrolled employees in any other industry sector, but the differences with financial services and real estate were not statistically significant (Exhibits 3.10, 3.11, and 3.12).
- Other than professional services, enrolled employees in financial services and real estate had the highest average single ($6,988) and employee-plus-one premiums ($13,707), but the difference with mining and manufacturing in average employee-plus-one premiums was not statistically significant (Exhibits 3.10 and 3.11).
Premiums by Selected Employer Characteristics, 2018
- Premiums for all three types of coverage for nonprofit employers were higher than premiums for unincorporated and incorporated for-profit employers ($7,490 vs. $6,448 and $6,571, respectively, for single coverage; $14,674 vs. $12,841 and $13,201, respectively, for employee-plus-one coverage; and $21,176 vs. $19,018 and $19,257, respectively, for family coverage) (Exhibits 3.13, 3.14, and 3.15).
- In 2018, enrolled employees in firms that were 20 years old or more had higher single premiums ($6,814), employee-plus-one premiums ($13,609), and family premiums ($19,750) than enrolled employees in firms that were 10-19 years old, 5-9 years old, or 0-4 years old (Exhibits 3.13, 3.14, and 3.15).
- Enrolled employees in firms with multiple locations had higher premiums than those in single-location firms for single coverage ($6,831 vs. $6,464), employee-plus-one coverage ($13,592 vs. $12,877), and family coverage ($19,955 vs. $18,359) (Exhibits 3.13, 3.14, and 3.15).
- In 2018, enrolled employees in predominantly low-wage establishments (50 percent or more of employees earned less than $12.00 per hour) had lower average premiums than those in higher wage establishments for single coverage ($6,232 vs. $6,784), employee-plus-one coverage ($12,382 vs. $13,518), and family coverage ($18,003 vs. $19,675) (Exhibits 3.13, 3.14, and 3.15).
Premium Distributions, 2018
- In 2018, premium distributions for all three types of coverage showed substantial variation as the 90th percentile value was more than twice as large as the 10th percentile
value for single premiums ($9,400 vs. $4,200), employee-plus-one premiums ($19,000 vs. $8,400), and family premiums ($27,000 vs. $13,000) (Exhibit 3.16).
- Single and employee-plus-one premiums for establishments in small firms (fewer than 50 employees) showed more variability than premiums
for large firms (100 or more employees). In particular, premiums for both types of coverage were lower in small firms than in large firms at the 10th,
25th, and 50th percentiles. However, at the 90th percentile,
small firms had higher premiums than large firms for both single coverage ($10,000 vs. $9,200) and employee-plus-one coverage ($20,000 vs. $19,000) (Exhibit 3.16).
- For family coverage, premiums in small firms were lower than in the largest firms at the 10th, 25th, 50th, and 75th percentiles but were the same at the 90th percentile ($27,000 for both firm-size groups) (Exhibit 3.16).
- Throughout the distribution, premiums tended to be lower at medium firms (50-99 employees) than at large firms: single premiums for medium firms were lower at the 10th through 75th percentiles; employee-plus-one premiums were lower at the 10th through 90th percentiles (p <0.10 for the difference at the 90th percentile); and family premiums were lower at the 25th through 75th percentiles (p <0.10 for the difference at the 25th percentile) (Exhibit 3.16).
Return to Table of Contents
Exhibit 3.1 Average total premiums (standard error) per enrolled employee for single, employee-plus-one, and family coverage, 2005‑2018
| Coverage |
2005 |
2006 |
2008 |
2009 |
2010 |
2011 |
2012 |
2013 |
2014 |
2015 |
2016 |
2017 |
2018 |
| Single |
$3,991 |
$4,118 |
$4,386 |
$4,669 |
$4,940 |
$5,222 |
$5,384 |
$5,571 |
$5,832 |
$5,963 |
$6,101 |
$6,368 |
$6,715 |
| (Standard Error) |
($24) |
($25) |
($15) |
($21) |
($22) |
($26) |
($28) |
($23) |
($25) |
($26) |
($27) |
($28) |
($31) |
| Plus One |
$7,671 |
$7,988 |
$8,535 |
$9,053 |
$9,664 |
$10,329 |
$10,621 |
$10,990 |
$11,503 |
$11,800 |
$12,124 |
$12,789 |
$13,425 |
| (Standard Error) |
($44) |
($48) |
($43) |
($34) |
($60) |
($105) |
($56) |
($54) |
($60) |
($58) |
($60) |
($70) |
($70) |
| Family |
$10,728 |
$11,381 |
$12,298 |
$13,027 |
$13,871 |
$15,022 |
$15,473 |
$16,029 |
$16,655 |
$17,322 |
$17,710 |
$18,687 |
$19,565 |
| (Standard Error) |
($41) |
($32) |
($81) |
($25) |
($75) |
($98) |
($95) |
($61) |
($79) |
($95) |
($84) |
($105) |
($104) |
|
Source: Medical Expenditure Panel Survey-Insurance Component, private-sector establishments, 2005‑2018.
Note: Medical Expenditure Panel Survey-Insurance Component estimates are not available for 2007.
|
Return to Table of Contents
Exhibit 3.2 Percentage change (standard error) in total premiums from previous year per enrolled employee for single, employee-plus-one, and family coverage, 2006‑2018
| Year |
Single |
Employee-Plus-One |
Family |
| 2006 |
3.2% |
4.1% |
6.1% |
| (Standard Error) |
(0.9%) |
(0.9%) |
(0.5%) |
| 2007 |
3.2% |
3.4% |
4.0% |
| (Standard Error) |
(0.8%) |
(0.8%) |
(0.8%) |
| 2008 |
3.2% |
3.4% |
4.0% |
| (Standard Error) |
(0.8%) |
(0.8%) |
(0.8%) |
| 2009 |
6.5% |
6.1% |
5.9% |
| (Standard Error) |
(0.6%) |
(0.7%) |
(0.7%) |
| 2010 |
5.8% |
6.7% |
6.5% |
| (Standard Error) |
(0.7%) |
(0.8%) |
(0.6%) |
| 2011 |
5.7% |
6.9% |
8.3% |
| (Standard Error) |
(0.7%) |
(1.3%) |
(0.9%) |
| 2012 |
3.1% |
2.8% |
3.0% |
| (Standard Error) |
(0.7%) |
(1.2%) |
(0.9%) |
| 2013 |
3.5% |
3.5% |
3.6% |
| (Standard Error) |
(0.7%) |
(0.7%) |
(0.7%) |
| 2014 |
4.7% |
4.7% |
3.9% |
| (Standard Error) |
(0.6%) |
(0.7%) |
(0.6%) |
| 2015 |
2.2% |
2.6% |
4.0% |
| (Standard Error) |
(0.6%) |
(0.7%) |
(0.8%) |
| 2016 |
2.3% |
2.7% |
2.2% |
| (Standard Error) |
(0.6%) |
(0.7%) |
(0.7%) |
| 2017 |
4.4% |
5.5% |
5.5% |
| (Standard Error) |
(0.7%) |
(0.8%) |
(0.8%) |
| 2018 |
5.4% |
5.0% |
4.7% |
| (Standard Error) |
(0.7%) |
(0.8%) |
(0.8%) |
|
Source: Medical Expenditure Panel Survey-Insurance Component, private-sector establishments, 2005‑2018.
Note: Medical Expenditure Panel Survey-Insurance Component estimates are not available for 2007. Therefore, growth rates were annualized over the 2006‑2008 period.
|
Return to Table of Contents
Exhibit 3.3 Average total single premium (standard error) per enrolled employee, by firm size, 2005‑2018
| Number of Employees |
2005 |
2006 |
2008 |
2009 |
2010 |
2011 |
2012 |
2013 |
2014 |
2015 |
2016 |
2017 |
2018 |
| U.S. |
$3,991 |
$4,118 |
$4,386 |
$4,669 |
$4,940 |
$5,222 |
$5,384 |
$5,571 |
$5,832 |
$5,963 |
$6,101 |
$6,368 |
$6,715 |
| (Standard Error) |
($24) |
($25) |
($15) |
($21) |
($22) |
($26) |
($28) |
($23) |
($25) |
($26) |
($27) |
($28) |
($31) |
| <50 |
$4,121 |
$4,260 |
$4,501 |
$4,652 |
$4,956 |
$5,258 |
$5,460 |
$5,628 |
$5,886 |
$5,947 |
$6,070 |
$6,421 |
$6,667 |
| (Standard Error) |
($45) |
($34) |
($31) |
($31) |
($34) |
($39) |
($60) |
($39) |
($55) |
($55) |
($53) |
($61) |
($63) |
| 50-99 |
$3,962 |
$4,045 |
$4,215 |
$4,614 |
$4,713 |
$4,861 |
$5,246 |
$5,314 |
$5,549 |
$5,642 |
$5,743 |
$6,163 |
$6,287 |
| (Standard Error) |
($70) |
($66) |
($37) |
($82) |
($52) |
($75) |
($39) |
($73) |
($82) |
($104) |
($96) |
($121) |
($111) |
| 100+ |
$3,950 |
$4,080 |
$4,370 |
$4,681 |
$4,959 |
$5,252 |
$5,378 |
$5,584 |
$5,851 |
$6,006 |
$6,146 |
$6,377 |
$6,770 |
| (Standard Error) |
($32) |
($32) |
($26) |
($38) |
($23) |
($31) |
($28) |
($29) |
($30) |
($31) |
($32) |
($33) |
($37) |
|
Source: Medical Expenditure Panel Survey-Insurance Component, private-sector establishments, 2005‑2018.
Note: Medical Expenditure Panel Survey-Insurance Component estimates are not available for 2007.
|
Return to Table of Contents
Exhibit 3.4 Average total employee-plus-one premium (standard error) per enrolled employee, by firm size, 2005‑2018
| Number of Employees |
2005 |
2006 |
2008 |
2009 |
2010 |
2011 |
2012 |
2013 |
2014 |
2015 |
2016 |
2017 |
2018 |
| U.S. |
$7,671 |
$7,988 |
$8,535 |
$9,053 |
$9,664 |
$10,329 |
$10,621 |
$10,990 |
$11,503 |
$11,800 |
$12,124 |
$12,789 |
$13,425 |
| (Standard Error) |
($44) |
($48) |
($43) |
($34) |
($60) |
($105) |
($56) |
($54) |
($60) |
($58) |
($60) |
($70) |
($70) |
| <50 |
$7,841 |
$8,105 |
$8,631 |
$9,124 |
$9,850 |
$10,253 |
$10,524 |
$11,050 |
$11,386 |
$11,666 |
$11,833 |
$12,558 |
$13,044 |
| (Standard Error) |
($115) |
($113) |
($110) |
($119) |
($80) |
($104) |
($121) |
($92) |
($163) |
($158) |
($156) |
($170) |
($176) |
| 50-99 |
$7,645 |
$7,774 |
$8,421 |
$8,852 |
$9,166 |
$9,615 |
$10,178 |
$10,673 |
$10,845 |
$10,885 |
$11,389 |
$11,931 |
$12,593 |
| (Standard Error) |
($138) |
($167) |
($88) |
($148) |
($124) |
($192) |
($185) |
($330) |
($187) |
($198) |
($227) |
($232) |
($236) |
| 100+ |
$7,640 |
$7,981 |
$8,527 |
$9,058 |
$9,669 |
$10,394 |
$10,672 |
$11,006 |
$11,571 |
$11,892 |
$12,225 |
$12,878 |
$13,537 |
| (Standard Error) |
($60) |
($61) |
($60) |
($34) |
($62) |
($113) |
($70) |
($59) |
($68) |
($66) |
($68) |
($79) |
($79) |
|
Source: Medical Expenditure Panel Survey-Insurance Component, private-sector establishments, 2005‑2018.
Note: Medical Expenditure Panel Survey-Insurance Component estimates are not available for 2007.
|
Return to Table of Contents
Exhibit 3.5 Average total family premium (standard error) per enrolled employee, by firm size, 2005‑2018
| Number of Employees |
2005 |
2006 |
2008 |
2009 |
2010 |
2011 |
2012 |
2013 |
2014 |
2015 |
2016 |
2017 |
2018 |
| U.S. |
$10,728 |
$11,381 |
$12,298 |
$13,027 |
$13,871 |
$15,022 |
$15,473 |
$16,029 |
$16,655 |
$17,322 |
$17,710 |
$18,687 |
$19,565 |
| (Standard Error) |
($41) |
($32) |
($81) |
($25) |
($75) |
($98) |
($95) |
($61) |
($79) |
($95) |
($84) |
($105) |
($104) |
| <50 |
$10,632 |
$11,095 |
$11,679 |
$12,041 |
$13,170 |
$14,086 |
$14,496 |
$14,787 |
$15,575 |
$15,919 |
$16,471 |
$17,649 |
$18,296 |
| (Standard Error) |
($106) |
($116) |
($182) |
($129) |
($111) |
($145) |
($181) |
($89) |
($177) |
($212) |
($207) |
($192) |
($231) |
| 50-99 |
$10,619 |
$10,954 |
$11,578 |
$12,431 |
$13,019 |
$14,151 |
$15,421 |
$15,376 |
$15,732 |
$16,336 |
$16,214 |
$17,735 |
$18,386 |
| (Standard Error) |
($208) |
($301) |
($128) |
($229) |
($153) |
($168) |
($273) |
($268) |
($274) |
($335) |
($348) |
($327) |
($473) |
| 100+ |
$10,754 |
$11,471 |
$12,468 |
$13,271 |
$14,074 |
$15,245 |
$15,641 |
$16,284 |
$16,903 |
$17,612 |
$18,000 |
$18,911 |
$19,824 |
| (Standard Error) |
($55) |
($51) |
($95) |
($33) |
($85) |
($117) |
($114) |
($82) |
($91) |
($110) |
($95) |
($122) |
($118) |
|
Source: Medical Expenditure Panel Survey-Insurance Component, private-sector establishments, 2005‑2018.
Note: Medical Expenditure Panel Survey-Insurance Component estimates are not available for 2007.
|
Return to Table of Contents
Exhibit 3.6 Average total premiums (standard error) per enrolled employee for single, employee-plus-one, and family coverage, overall and by firm size, 2018
| Number of Employees |
Single |
Employee-Plus-One |
Family |
| United States |
$6,715 |
$13,425 |
$19,565 |
| (Standard Error) |
($31) |
($70) |
($104) |
| Firm size in 3 categories |
|
|
|
| <50 |
$6,667 |
$13,044 |
$18,296 |
| (Standard Error) |
($63) |
($176) |
($231) |
| 50-99 |
$6,287 |
$12,593 |
$18,386 |
| (Standard Error) |
($111) |
($236) |
($473) |
| 100+ |
$6,770 |
$13,537 |
$19,824 |
| (Standard Error) |
($37) |
($79) |
($118) |
| Firm size in 5 categories |
|
|
|
| <10 |
$6,973 |
$13,395 |
$17,922 |
| (Standard Error) |
($120) |
($393) |
($445) |
| 10-24 |
$6,660 |
$12,814 |
$18,961 |
| (Standard Error) |
($120) |
($277) |
($407) |
| 25-99 |
$6,341 |
$12,752 |
$18,181 |
| (Standard Error) |
($73) |
($173) |
($297) |
| 100-999 |
$6,705 |
$13,568 |
$19,444 |
| (Standard Error) |
($77) |
($167) |
($287) |
| 1,000+ |
$6,798 |
$13,528 |
$19,948 |
| (Standard Error) |
($42) |
($89) |
($125) |
|
Source: Medical Expenditure Panel Survey-Insurance Component, private-sector establishments, 2018.
|
Return to Table of Contents
Exhibit 3.7 Average total single premium (standard error) per enrolled employee, by State, 2018
| Alabama |
$6,089* |
Kentucky |
$6,690 |
North Dakota |
$6,643 |
| (Standard Error) |
($138) |
(Standard Error) |
($221) |
(Standard Error) |
($132) |
| Alaska |
$8,432* |
Louisiana |
$6,537 |
Ohio |
$6,804 |
| (Standard Error) |
($199) |
(Standard Error) |
($197) |
(Standard Error) |
($129) |
| Arizona |
$6,229* |
Maine |
$6,866 |
Oklahoma |
$6,630 |
| (Standard Error) |
($140) |
(Standard Error) |
($144) |
(Standard Error) |
($156) |
| Arkansas |
$5,974* |
Maryland |
$6,695 |
Oregon |
$6,441 |
| (Standard Error) |
($167) |
(Standard Error) |
($194) |
(Standard Error) |
($160) |
| California |
$6,542* |
Massachusetts |
$7,443* |
Pennsylvania |
$6,769 |
| (Standard Error) |
($82) |
(Standard Error) |
($254) |
(Standard Error) |
($145) |
| Colorado |
$6,255* |
Michigan |
$6,322* |
Rhode Island |
$7,018* |
| (Standard Error) |
($121) |
(Standard Error) |
($147) |
(Standard Error) |
($143) |
| Connecticut |
$7,264* |
Minnesota |
$6,781 |
South Carolina |
$6,708 |
| (Standard Error) |
($149) |
(Standard Error) |
($157) |
(Standard Error) |
($145) |
| Delaware |
$6,848 |
Mississippi |
$5,993* |
South Dakota |
$6,931 |
| (Standard Error) |
($157) |
(Standard Error) |
($124) |
(Standard Error) |
($146) |
| District of Columbia |
$7,230* |
Missouri |
$6,664 |
Tennessee |
$5,971* |
| (Standard Error) |
($147) |
(Standard Error) |
($157) |
(Standard Error) |
($100) |
| Florida |
$6,674 |
Montana |
$6,862 |
Texas |
$6,589 |
| (Standard Error) |
($189) |
(Standard Error) |
($161) |
(Standard Error) |
($134) |
| Georgia |
$6,799 |
Nebraska |
$6,851 |
Utah |
$6,125* |
| (Standard Error) |
($163) |
(Standard Error) |
($219) |
(Standard Error) |
($162) |
| Hawaii |
$6,475* |
Nevada |
$6,032* |
Vermont |
$6,919 |
| (Standard Error) |
($114) |
(Standard Error) |
($166) |
(Standard Error) |
($148) |
| Idaho |
$6,175* |
New Hampshire |
$7,405* |
Virginia |
$6,635 |
| (Standard Error) |
($162) |
(Standard Error) |
($301) |
(Standard Error) |
($155) |
| Illinois |
$7,123* |
New Jersey |
$7,507* |
Washington |
$6,646 |
| (Standard Error) |
($166) |
(Standard Error) |
($126) |
(Standard Error) |
($154) |
| Indiana |
$6,778 |
New Mexico |
$6,624 |
West Virginia |
$6,898 |
| (Standard Error) |
($200) |
(Standard Error) |
($238) |
(Standard Error) |
($272) |
| Iowa |
$6,796 |
New York |
$7,741* |
Wisconsin |
$6,816 |
| (Standard Error) |
($160) |
(Standard Error) |
($211) |
(Standard Error) |
($142) |
| Kansas |
$6,262* |
North Carolina |
$6,339* |
Wyoming |
$6,779 |
| (Standard Error) |
($151) |
(Standard Error) |
($129) |
(Standard Error) |
($183) |
|
Source: Medical Expenditure Panel Survey-Insurance Component, private-sector establishments, 2018.
Note: * Statistically different from national average of $6,715 at p < 0.05. Note that the standard error on the national estimate of $6,715 is $31.18.
|
Return to Table of Contents
Exhibit 3.8 Average total employee-plus-one premium (standard error) per enrolled employee, by State, 2018
| Alabama |
$12,307* |
Kentucky |
$13,128 |
North Dakota |
$12,375* |
| (Standard Error) |
($367) |
(Standard Error) |
($326) |
(Standard Error) |
($343) |
| Alaska |
$16,082* |
Louisiana |
$13,007 |
Ohio |
$13,745 |
| (Standard Error) |
($422) |
(Standard Error) |
($364) |
(Standard Error) |
($291) |
| Arizona |
$12,784* |
Maine |
$13,505 |
Oklahoma |
$13,049 |
| (Standard Error) |
($275) |
(Standard Error) |
($527) |
(Standard Error) |
($417) |
| Arkansas |
$11,854* |
Maryland |
$13,256 |
Oregon |
$12,742* |
| (Standard Error) |
($369) |
(Standard Error) |
($349) |
(Standard Error) |
($338) |
| California |
$13,236 |
Massachusetts |
$15,094* |
Pennsylvania |
$14,135* |
| (Standard Error) |
($181) |
(Standard Error) |
($772) |
(Standard Error) |
($301) |
| Colorado |
$12,612* |
Michigan |
$13,649 |
Rhode Island |
$14,004 |
| (Standard Error) |
($371) |
(Standard Error) |
($405) |
(Standard Error) |
($288) |
| Connecticut |
$13,690 |
Minnesota |
$13,523 |
South Carolina |
$12,879 |
| (Standard Error) |
($788) |
(Standard Error) |
($311) |
(Standard Error) |
($367) |
| Delaware |
$13,289 |
Mississippi |
$11,352* |
South Dakota |
$13,196 |
| (Standard Error) |
($336) |
(Standard Error) |
($618) |
(Standard Error) |
($300) |
| District of Columbia |
$15,008* |
Missouri |
$12,902 |
Tennessee |
$12,135* |
| (Standard Error) |
($360) |
(Standard Error) |
($312) |
(Standard Error) |
($307) |
| Florida |
$13,257 |
Montana |
$13,151 |
Texas |
$13,592 |
| (Standard Error) |
($329) |
(Standard Error) |
($437) |
(Standard Error) |
($275) |
| Georgia |
$13,213 |
Nebraska |
$13,177 |
Utah |
$12,462* |
| (Standard Error) |
($293) |
(Standard Error) |
($384) |
(Standard Error) |
($329) |
| Hawaii |
$12,778 |
Nevada |
$11,524* |
Vermont |
$13,837 |
| (Standard Error) |
($415) |
(Standard Error) |
($422) |
(Standard Error) |
($345) |
| Idaho |
$12,160* |
New Hampshire |
$14,820* |
Virginia |
$12,903 |
| (Standard Error) |
($337) |
(Standard Error) |
($481) |
(Standard Error) |
($364) |
| Illinois |
$13,549 |
New Jersey |
$14,808* |
Washington |
$12,557 |
| (Standard Error) |
($552) |
(Standard Error) |
($351) |
(Standard Error) |
($470) |
| Indiana |
$13,788 |
New Mexico |
$12,759 |
West Virginia |
$13,797 |
| (Standard Error) |
($466) |
(Standard Error) |
($545) |
(Standard Error) |
($464) |
| Iowa |
$13,041 |
New York |
$15,325* |
Wisconsin |
$14,310* |
| (Standard Error) |
($435) |
(Standard Error) |
($400) |
(Standard Error) |
($383) |
| Kansas |
$13,344 |
North Carolina |
$11,947* |
Wyoming |
$12,613* |
| (Standard Error) |
($382) |
(Standard Error) |
($353) |
(Standard Error) |
($363) |
|
Source: Medical Expenditure Panel Survey-Insurance Component, private-sector establishments, 2018.
Note: * Statistically different from national average of $13,425 at p < 0.05. Note that the standard error on the national estimate of $13,425 is $69.63.
|
Return to Table of Contents
Exhibit 3.9 Average total family premium (standard error) per enrolled employee, by State, 2018
| Alabama |
$18,001* |
Kentucky |
$19,277 |
North Dakota |
$17,337* |
| (Standard Error) |
($563) |
(Standard Error) |
($561) |
(Standard Error) |
($361) |
| Alaska |
$21,648* |
Louisiana |
$19,294 |
Ohio |
$19,640 |
| (Standard Error) |
($624) |
(Standard Error) |
($580) |
(Standard Error) |
($404) |
| Arizona |
$18,875 |
Maine |
$19,555 |
Oklahoma |
$18,745 |
| (Standard Error) |
($421) |
(Standard Error) |
($417) |
(Standard Error) |
($408) |
| Arkansas |
$17,995* |
Maryland |
$19,237 |
Oregon |
$18,977 |
| (Standard Error) |
($559) |
(Standard Error) |
($412) |
(Standard Error) |
($433) |
| California |
$19,567 |
Massachusetts |
$21,801 |
Pennsylvania |
$20,255 |
| (Standard Error) |
($252) |
(Standard Error) |
($1,183) |
(Standard Error) |
($531) |
| Colorado |
$18,314* |
Michigan |
$18,242* |
Rhode Island |
$18,623 |
| (Standard Error) |
($449) |
(Standard Error) |
($520) |
(Standard Error) |
($535) |
| Connecticut |
$20,735* |
Minnesota |
$19,327 |
South Carolina |
$19,284 |
| (Standard Error) |
($547) |
(Standard Error) |
($491) |
(Standard Error) |
($573) |
| Delaware |
$20,098 |
Mississippi |
$17,384* |
South Dakota |
$19,730 |
| (Standard Error) |
($515) |
(Standard Error) |
($574) |
(Standard Error) |
($342) |
| District of Columbia |
$21,810* |
Missouri |
$19,249 |
Tennessee |
$17,663* |
| (Standard Error) |
($472) |
(Standard Error) |
($570) |
(Standard Error) |
($400) |
| Florida |
$18,934 |
Montana |
$19,610 |
Texas |
$19,460 |
| (Standard Error) |
($388) |
(Standard Error) |
($859) |
(Standard Error) |
($450) |
| Georgia |
$18,575* |
Nebraska |
$19,015 |
Utah |
$18,052* |
| (Standard Error) |
($409) |
(Standard Error) |
($529) |
(Standard Error) |
($496) |
| Hawaii |
$17,919* |
Nevada |
$18,357* |
Vermont |
$20,129 |
| (Standard Error) |
($478) |
(Standard Error) |
($600) |
(Standard Error) |
($557) |
| Idaho |
$17,579* |
New Hampshire |
$20,538 |
Virginia |
$19,512 |
| (Standard Error) |
($459) |
(Standard Error) |
($611) |
(Standard Error) |
($521) |
| Illinois |
$20,407 |
New Jersey |
$22,294* |
Washington |
$18,783 |
| (Standard Error) |
($543) |
(Standard Error) |
($416) |
(Standard Error) |
($613) |
| Indiana |
$19,551 |
New Mexico |
$17,861* |
West Virginia |
$20,709 |
| (Standard Error) |
($636) |
(Standard Error) |
($816) |
(Standard Error) |
($874) |
| Iowa |
$18,192* |
New York |
$21,904* |
Wisconsin |
$19,555 |
| (Standard Error) |
($371) |
(Standard Error) |
($728) |
(Standard Error) |
($448) |
| Kansas |
$18,825 |
North Carolina |
$18,211* |
Wyoming |
$19,374 |
| (Standard Error) |
($575) |
(Standard Error) |
($384) |
(Standard Error) |
($663) |
|
Source: Medical Expenditure Panel Survey-Insurance Component, private-sector establishments, 2018.
Note: * Statistically different from national average of $19,565 at p < 0.05. Note that the standard error on the national estimate of $19,565 is 104.33.
|
Return to Table of Contents
Exhibit 3.10 Average total single premium (standard error) per enrolled employee, overall and by industry, 2018
| Industry |
Amount |
| United States |
$6,715 |
| (Standard Error) |
($31) |
| Agriculture, fisheries, forestry |
$6,113 |
| (Standard Error) |
($420) |
| Mining and manufacturing |
$6,541 |
| (Standard Error) |
($69) |
| Construction |
$6,440 |
| (Standard Error) |
($122) |
| Utilities and transportation |
$6,306 |
| (Standard Error) |
($177) |
| Wholesale trade |
$6,530 |
| (Standard Error) |
($117) |
| Financial services and real estate |
$6,988 |
| (Standard Error) |
($114) |
| Retail trade |
$6,254 |
| (Standard Error) |
($59) |
| Professional services |
$7,168 |
| (Standard Error) |
($52) |
| Other services |
$6,456 |
| (Standard Error) |
($96) |
|
Source: Medical Expenditure Panel Survey-Insurance Component, private-sector establishments, 2018.
|
Return to Table of Contents
Exhibit 3.11 Average total employee-plus-one premium (standard error) per enrolled employee, overall and by industry, 2018
| Industry |
Amount |
| United States |
$13,425 |
| (Standard Error) |
($70) |
| Agriculture, fisheries, forestry |
$11,670 |
| (Standard Error) |
($712) |
| Mining and manufacturing |
$13,494 |
| (Standard Error) |
($146) |
| Construction |
$12,631 |
| (Standard Error) |
($252) |
| Utilities and transportation |
$12,671 |
| (Standard Error) |
($237) |
| Wholesale trade |
$13,099 |
| (Standard Error) |
($202) |
| Financial services and real estate |
$13,707 |
| (Standard Error) |
($201) |
| Retail trade |
$12,246 |
| (Standard Error) |
($235) |
| Professional services |
$14,168 |
| (Standard Error) |
($138) |
| Other services |
$12,896 |
| (Standard Error) |
($188) |
|
Source: Medical Expenditure Panel Survey-Insurance Component, private-sector establishments, 2018.
|
Return to Table of Contents
Exhibit 3.12 Average total family premium (standard error) per enrolled employee, overall and by industry, 2018
| Industry |
Amount |
| United States |
$19,565 |
| (Standard Error) |
($104) |
| Agriculture, fisheries, forestry |
$17,515 |
| (Standard Error) |
($1,215) |
| Mining and manufacturing |
$19,240 |
| (Standard Error) |
($216) |
| Construction |
$17,679 |
| (Standard Error) |
($691) |
| Utilities and transportation |
$19,151 |
| (Standard Error) |
($344) |
| Wholesale trade |
$19,499 |
| (Standard Error) |
($288) |
| Financial services and real estate |
$19,985 |
| (Standard Error) |
($290) |
| Retail trade |
$18,452 |
| (Standard Error) |
($257) |
| Professional services |
$20,542 |
| (Standard Error) |
($202) |
| Other services |
$18,855 |
| (Standard Error) |
($290) |
|
Source: Medical Expenditure Panel Survey-Insurance Component, private-sector establishments, 2018.
|
Return to Table of Contents
Exhibit 3.13 Average total single premium (standard error) per enrolled employee, overall and by selected characteristics, 2018
| Employer Characteristics |
Amount |
| United States |
$6,715 |
| (Standard Error) |
($31) |
| Ownership: For Profit Inc. |
$6,571 |
| (Standard Error) |
($35) |
| Ownership: For Profit Uninc. |
$6,448 |
| (Standard Error) |
($82) |
| Ownership: Nonprofit |
$7,490 |
| (Standard Error) |
($89) |
| Firm Age: 0-4 Years |
$5,927 |
| (Standard Error) |
($164) |
| Firm Age: 5-9 Years |
$6,254 |
| (Standard Error) |
($161) |
| Firm Age: 10-19 Years |
$6,476 |
| (Standard Error) |
($97) |
| Firm Age: 20+ Years |
$6,814 |
| (Standard Error) |
($34) |
| # of Locations: 2+ Locations |
$6,831 |
| (Standard Error) |
($38) |
| # of Locations: 1 Location |
$6,464 |
| (Standard Error) |
($53) |
| % Full Time: 0-24% |
$6,214 |
| (Standard Error) |
($142) |
| % Full Time: 25-49% |
$6,267 |
| (Standard Error) |
($101) |
| % Full Time: 50-74% |
$6,672 |
| (Standard Error) |
($87) |
| % Full Time: 75%+ |
$6,753 |
| (Standard Error) |
($35) |
| % Low Wage: 50%+ |
$6,232 |
| (Standard Error) |
($78) |
| % Low Wage: <50% |
$6,784 |
| (Standard Error) |
($34) |
|
Source: Medical Expenditure Panel Survey-Insurance Component, private-sector establishments, 2018.
Note: "% Full Time" refers to the percentage of the establishment's workforce that worked full time in 2018. "% Low Wage" refers to the percentage of the establishment's workforce that earned less than $12.00 per hour in 2018.
|
Return to Table of Contents
Exhibit 3.14 Average total employee-plus-one premium (standard error) per enrolled employee, overall and by selected characteristics, 2018
| Employer Characteristics |
Amount |
| United States |
$13,425 |
| (Standard Error) |
($70) |
| Ownership: For Profit Inc. |
$13,201 |
| (Standard Error) |
($78) |
| Ownership: For Profit Uninc. |
$12,841 |
| (Standard Error) |
($172) |
| Ownership: Nonprofit |
$14,674 |
| (Standard Error) |
($200) |
| Firm Age: 0-4 Years |
$12,122 |
| (Standard Error) |
($387) |
| Firm Age: 5-9 Years |
$11,853 |
| (Standard Error) |
($295) |
| Firm Age: 10-19 Years |
$12,709 |
| (Standard Error) |
($209) |
| Firm Age: 20+ Years |
$13,609 |
| (Standard Error) |
($77) |
| # of Locations: 2+ Locations |
$13,592 |
| (Standard Error) |
($83) |
| # of Locations: 1 Location |
$12,877 |
| (Standard Error) |
($123) |
| % Full Time: 0-24% |
$12,678 |
| (Standard Error) |
($564) |
| % Full Time: 25-49% |
$12,788 |
| (Standard Error) |
($279) |
| % Full Time: 50-74% |
$13,090 |
| (Standard Error) |
($283) |
| % Full Time: 75%+ |
$13,490 |
| (Standard Error) |
($74) |
| % Low Wage: 50%+ |
$12,382 |
| (Standard Error) |
($205) |
| % Low Wage: <50% |
$13,518 |
| (Standard Error) |
($73) |
|
Source: Medical Expenditure Panel Survey-Insurance Component, private-sector establishments, 2018.
Note: "% Full Time" refers to the percentage of the establishment's workforce that worked full time in 2018. "% Low Wage" refers to the percentage of the establishment's workforce that earned less than $12.00 per hour in 2018.
|
Return to Table of Contents
Exhibit 3.15 Average total family premium (standard error) per enrolled employee, overall and by selected characteristics, 2018
| Employer Characteristics |
Amount |
| United States |
$19,565 |
| (Standard Error) |
($104) |
| Ownership: For Profit Inc. |
$19,257 |
| (Standard Error) |
($125) |
| Ownership: For Profit Uninc. |
$19,018 |
| (Standard Error) |
($243) |
| Ownership: Nonprofit |
$21,176 |
| (Standard Error) |
($267) |
| Firm Age: 0-4 Years |
$18,524 |
| (Standard Error) |
($603) |
| Firm Age: 5-9 Years |
$17,469 |
| (Standard Error) |
($434) |
| Firm Age: 10-19 Years |
$18,962 |
| (Standard Error) |
($263) |
| Firm Age: 20+ Years |
$19,750 |
| (Standard Error) |
($117) |
| # of Locations: 2+ Locations |
$19,955 |
| (Standard Error) |
($115) |
| # of Locations: 1 Location |
$18,359 |
| (Standard Error) |
($231) |
| % Full Time: 0-24% |
$19,230 |
| (Standard Error) |
($441) |
| % Full Time: 25-49% |
$18,875 |
| (Standard Error) |
($460) |
| % Full Time: 50-74% |
$19,255 |
| (Standard Error) |
($297) |
| % Full Time: 75%+ |
$19,613 |
| (Standard Error) |
($114) |
| % Low Wage: 50%+ |
$18,003 |
| (Standard Error) |
($285) |
| % Low Wage: <50% |
$19,675 |
| (Standard Error) |
($110) |
|
Source: Medical Expenditure Panel Survey-Insurance Component, private-sector establishments, 2018.
Note: "% Full Time" refers to the percentage of the establishment's workforce that worked full time in 2018. "% Low Wage" refers to the percentage of the establishment's workforce that earned less than $12.00 per hour in 2018.
|
Return to Table of Contents
Exhibit 3.16 Premium distributions (standard error) for employees enrolled in single, employee-plus-one, and family coverage, overall and by firm size, 2018
| Coverage |
Estimate |
Total |
<50 employees |
50-99
employees |
100 or
more employees |
| Single |
Average (mean) |
$6,715 |
$6,667 |
$6,287 |
$6,770 |
| (Standard Error) |
($31) |
($63) |
($111) |
($37) |
| 10 percentile |
$4,200 |
$3,700 |
$3,700 |
$4,300 |
| (Standard Error) |
($22) |
($62) |
($158) |
($53) |
| 25 percentile |
$5,300 |
$4,800 |
$4,800 |
$5,500 |
| (Standard Error) |
($34) |
($40) |
($106) |
($37) |
| 50 percentile (median) |
$6,500 |
$6,000 |
$6,000 |
$6,600 |
| (Standard Error) |
($30) |
($51) |
($89) |
($28) |
| 75 percentile |
$7,800 |
$8,000 |
$7,300 |
$7,800 |
| (Standard Error) |
($39) |
($103) |
($181) |
($43) |
| 90 percentile |
$9,400 |
$10,000 |
$9,300 |
$9,200 |
| (Standard Error) |
($103) |
($154) |
($282) |
($94) |
| Employee-plus-one |
Average (mean) |
$13,425 |
$13,044 |
$12,593 |
$13,537 |
| (Standard Error) |
($70) |
($176) |
($236) |
($79) |
| 10 percentile |
$8,400 |
$6,900 |
$7,200 |
$8,800 |
| (Standard Error) |
($120) |
($205) |
($373) |
($163) |
| 25 percentile |
$11,000 |
$9,400 |
$9,600 |
$11,000 |
| (Standard Error) |
($67) |
($159) |
($274) |
($62) |
| 50 percentile (median) |
$13,000 |
$12,000 |
$12,000 |
$13,000 |
| (Standard Error) |
($73) |
($198) |
($250) |
($73) |
| 75 percentile |
$16,000 |
$16,000 |
$15,000 |
$16,000 |
| (Standard Error) |
($113) |
($313) |
($374) |
($132) |
| 90 percentile |
$19,000 |
$20,000 |
$18,000 |
$19,000 |
| (Standard Error) |
($107) |
($408) |
($538) |
($135) |
| Family |
Average (mean) |
$19,565 |
$18,296 |
$18,386 |
$19,824 |
| (Standard Error) |
($104) |
($231) |
($473) |
($118) |
| 10 percentile |
$13,000 |
$10,000 |
$11,000 |
$13,000 |
| (Standard Error) |
($105) |
($318) |
($1,302) |
($156) |
| 25 percentile |
$16,000 |
$14,000 |
$15,000 |
$16,000 |
| (Standard Error) |
($117) |
($326) |
($503) |
($116) |
| 50 percentile (median) |
$19,000 |
$18,000 |
$18,000 |
$20,000 |
| (Standard Error) |
($103) |
($207) |
($363) |
($133) |
| 75 percentile |
$23,000 |
$22,000 |
$21,000 |
$23,000 |
| (Standard Error) |
($166) |
($321) |
($439) |
($139) |
| 90 percentile |
$27,000 |
$27,000 |
$26,000 |
$27,000 |
| (Standard Error) |
($168) |
($760) |
($1,059) |
($189) |
|
Source: Medical Expenditure Panel Survey-Insurance Component, private-sector establishments, 2018.
|
Return to Table of Contents
In 2018, enrolled employees paid 21.3 percent of total premiums for single coverage, 27.1 percent for employee-plus-one coverage, and 27.8 percent for family coverage. The employee share of total premiums in 2018 for single coverage decreased by 0.9 percentage points from its 2017 level, while the employee shares for the other two coverage types were not significantly different from their 2017 levels.
Average employee contributions in 2018 were $3,634 for employee-plus-one coverage and $5,431 for family coverage, representing increases of 2.9 percent and 4.1 percent, respectively, over 2017 levels (p <0.10 for employee-plus-one coverage). The employee contribution for single coverage in 2018 ($1,427) was not significantly different from the average contribution in 2017. Average employer contributions in 2018 increased by 6.8 percent, 5.8 percent, and 4.9 percent for single, employee-plus-one, and family coverage, respectively, over 2017 levels.
This section examines how employee and employer premium contributions changed between 2005 and 2018, both in nominal dollars and as a percentage of annual premiums per enrolled employee. This section also examines variation in employee premium contributions by coverage type, State where the enrolled employee's establishment was located, firm size, industry, and other employer characteristics. In addition, this section presents the distribution of employee contributions by firm size.
Employee and Employer Premium Contributions, 2005 to 2018
- In 2018, enrolled employees paid 21.3 percent of total premiums for single coverage, 27.1 percent for employee-plus-one coverage, and 27.8 percent for family coverage. The employee share of total premiums in 2018 for single coverage decreased by 0.9 percentage points from its 2017 level, while the employee shares for the other two coverage types were not significantly different from their 2017 levels (Exhibit 4.1).
- Employees enrolled in single coverage contributed a smaller share of premiums than employees enrolled in employee-plus-one and family coverage in all years from 2005 to 2018 (Exhibit 4.1).
- Average employee contributions in 2018 were $3,634 for employee-plus-one coverage and $5,431 for family coverage, representing increases of 2.9 percent and 4.1 percent, respectively, over 2017 levels (p <0.10 for employee-plus-one coverage). The employee contribution for single coverage in 2018 ($1,427) was not significantly different from the average contribution in 2017. Annual increases in average employee contributions for each coverage type were statistically significant in most years from 2005 to 2017 (Exhibit 4.2).
- Average employer contributions in 2018 were $5,288 for single coverage, $9,791 for employee-plus-one coverage, and $14,134 for family coverage, representing increases of 6.8 percent, 5.8 percent, and 4.9 percent, respectively, over 2017 levels. Similar to employee contributions, there were statistically significant annual increases in average employer contributions for these coverage types in most years from 2005 to 2017 (Exhibits 4.3, 4.4, and 4.5).
- From 2005 to 2018, the percentage of premiums contributed by employees increased by 3.2 percentage points, 4.2 percentage points, and 3.7 percentage points for single, employee-plus-one, and family coverage, respectively. These increases occurred because employee contributions increased more rapidly than employer contributions from 2005 to 2018 for each type of coverage (Exhibits 4.1, 4.3, 4.4, and 4.5).
Employee Premium Contributions by Firm Size, 2005 to 2018
Percentage Contributed for Single Coverage
- The percentage of single-coverage premiums paid by employees in large firms (100 or more employees) decreased by 1.6 percentage points, from 22.8 percent in 2017 to 21.2 percent in 2018. In contrast, the percentage of single premiums paid by employees in medium firms (50-99 employees) increased by 2.5 percentage points, from 21.9 percent in 2017 to 24.4 percent in 2018. The percentage of single-coverage premiums paid by employees in small firms (fewer than 50 employees) in 2018 (20.3 percent) was not significantly different from its 2017 level (Exhibit 4.6).
- In 2018, enrolled employees in medium firms (50-99 employees) contributed a significantly higher percentage of single premiums than those in small and large firms. There was no significant difference in the percentage of single-coverage premiums paid by employees in small firms (fewer than 50 employees) and large firms (100 or more employees) in 2018 (Exhibit 4.6).
- In 2018, employees with single coverage in the smallest firms (fewer than 10 employees) paid a significantly lower share of premiums (17.7 percent) than enrolled employees in larger firms except firms with 10-24 employees (20.1 percent):
- 23.7 percent in firms with 25-99 employees,
- 21.6 percent in firms with 100-999 employees, and
- 21.0 percent in firms with 1,000 or more employees (Exhibit 4.12).
- One factor behind the lower percentage of single premiums contributed by enrolled employees in the smallest firms (fewer than 10 employees) compared with larger firms (firms with 25 to 99 employees or larger) is the much higher percentage of these small-firm enrollees with no required employee premium contribution. In 2018, for example, 51.8 percent of employees with single coverage in firms with fewer than 10 employees had no required premium contribution. In contrast, only 12.6 percent and 4.9 percent of employees with single coverage in firms with 100-999 employees and with 1,000 or more employees, respectively, were not required to contribute to single premiums (Exhibits 4.12 and 4.14).
- Between 2017 and 2018, the percentage of enrolled employees with no required employee contribution for single coverage increased by 1.0 percentage point in firms with 1,000 or more employees (p <0.10) (Exhibit 4.14).
Percentage Contributed for Dependent Coverage
- In all years between 2005 and 2018, enrolled employees in small firms (fewer than 50 employees) paid a percentage of premiums that was not significantly different or was higher for employee-plus-one and family coverage than enrolled employees in large firms (100 or more employees). Enrolled employees in medium firms (50-99 employees) contributed the same or a larger share of premiums for both types of coverage than those in both small and large firms over the entire period (Exhibits 4.8 and 4.10).
- In 2018, employees with employee-plus-one coverage in the smallest firms (fewer than 10 employees) and the largest firms (1,000 or more employees) paid a lower percentage of their premium (21.5 percent and 24.5 percent, respectively) than enrollees in the three other firm-size categories:
- 34.9 percent in firms with 10-24 employees,
- 36.4 percent in firms with 25-99 employees, and
- 30.4 percent in firms with 100-999 employees (Exhibit 4.12).
- In 2018, employees with family coverage in the smallest firms and the largest firms also paid a lower percentage of their premium (23.2 percent and 25.4 percent, respectively) than enrollees in the three other firm-size categories:
- 34.2 percent in firms with 10-24 employees,
- 37.7 percent in firms with 25-99 employees, and
- 30.6 percent in firms with 100-999 employees (Exhibit 4.12).
- In 2018, the percentage of enrolled employees with no required premium contribution for employee-plus-one coverage was highest for employees in the smallest firms and decreased as firm size increased (except that there was no significant difference between the two largest firm sizes):
- 49.9 percent in firms with fewer than 10 employees,
- 18.9 percent in firms with 10-24 employees,
- 9.8 percent in firms with 25-99 employees, and
- 5.4 percent and 4.2 percent in firms with 100-999 and 1,000 or more employees, respectively (Exhibit 4.15).
- In 2018, the percentage of enrolled employees with no required premium contribution for family coverage was highest for employees in the smallest firms and decreased in a step-by-step fashion as firm size increased:
- 50.2 percent in firms with fewer than 10 employees,
- 26.4 percent in firms with 10-24 employees,
- 13.9 percent in firms with 25-99 employees,
- 7.6 percent in firms with 100-999 employees, and
- 2.9 percent in firms with 1,000 or more employees (Exhibit 4.16).
Employee Contributions for Single Coverage (Dollar Amount)
- In 2018, employee premium contributions for single coverage were lower in firms with fewer than 50 employees ($1,351) than in firms with 50-99 employees ($1,534) and in firms with 100 or more employees ($1,433) (Exhibit 4.7).
- Enrolled employees in firms with fewer than 10 employees contributed a significantly smaller dollar amount for their single coverage ($1,237) in 2018 than those in larger firms except firms with 10-24 employees ($1,338):
- $1,504 in firms with 25-99 employees
- $1,449 in firms with 100-999 employees, and
- $1,427 in firms with 1,000 or more employees (Exhibit 4.13).
Employee Contributions for Dependent Coverage (Dollar Amount)
- In 2018, employee premium contributions for employee-plus-one coverage were highest in firms with 50-99 employees ($4,732) and higher in firms with fewer than 50 employees ($4,017) than in firms with 100 or more employees ($3,504) (Exhibit 4.9).
- In the more detailed firm-size categories, the amounts paid by employees with employee-plus-one coverage were lowest in firms with fewer than 10 employees ($2,885, p <0.10 for the difference with 1,000 or more employees), and employees in the largest firms (1,000 or more employees, $3,317) had lower required contributions than enrolled employees in the three firm-size categories with10-999 employees (Exhibit 4.13).
- Employee premium contributions for family coverage were also highest in firms with 50-99 employees ($6,973) and higher in firms with fewer than 50 employees ($5,854) than in firms with 100 or more employees ($5,277) in 2018 (Exhibit 4.11).
- In the more detailed firm-size categories, employees with family coverage in firms with fewer than 10 employees contributed the lowest dollar amount ($4,163) in 2018. Among enrolled employees with family coverage in larger firms (10 or more employees), enrollees in firms with 1,000 or more employees contributed a lower dollar amount ($5,059) than enrollees in the three other firm-size categories (Exhibit 4.13).
Trends in Employee Contributions (Dollar Amount)
- Between 2017 and 2018, employee premium contributions at medium firms (50-99 employees) increased by 13.7 percent (from $1,349 to $1,534) for single coverage and by 21.5 percent (from $5,738 to $6,973) for family coverage (Exhibits 4.7 and 4.11).
Employee Premium Contributions by State, 2018
- The percentage of premiums paid by enrollees with single coverage varied by State in 2018, from 11.7 percent in Hawaii to 26.3 percent in Virginia. States where the enrollee's share of single-coverage premiums was higher than the national average of 21.3 percent were Arizona, Iowa, Louisiana, Massachusetts, Ohio, Rhode Island, and Virginia. States where the enrollee's share of single-coverage premiums was lower than the national average were Alaska, California, District of Columbia, Hawaii, Montana, North Dakota, Oregon, and Washington (Exhibit 4.17).
- The percentage of premiums paid by enrollees with employee-plus-one coverage also varied by State, from 20.4 percent in Washington to 33.1 percent in Tennessee. States where the enrollee's share of employee-plus-one premiums was higher than the national average of 27.1 percent were Arkansas, Louisiana, Tennessee, and Texas. States where the enrollee's share of employee-plus-one premiums was lower than the national average were Alaska, Illinois, Kansas, New York, Washington, West Virginia, and Wisconsin (Exhibit 4.18).
- In 2018, the percentage of premiums paid by family-coverage enrollees varied by State, from 20.6 percent in Washington to 34.1 percent in Nevada. States where the enrollee's share of family-coverage premiums was higher than the national average of 27.8 percent were Florida, Georgia, Louisiana, Maryland, Mississippi, Nevada, North Carolina, Tennessee, Texas, and Virginia. States where the enrollee's share was lower than the national average were Alaska, Indiana, Michigan, New York, Ohio, Washington, and West Virginia (Exhibit 4.19).
- The dollar amount of average single-coverage employee contributions also varied by State, from $755 in Hawaii to $1,903 in Massachusetts. States with employee premium contributions for single coverage that exceeded the national average of $1,427 were Connecticut, Iowa, Louisiana, Massachusetts, New Hampshire, New Jersey, Ohio, Rhode Island, and Virginia. States with employee premium contributions that were smaller than the national average were Alaska, California, Colorado, Hawaii, Idaho, Kansas, Montana, North Carolina, North Dakota, Oregon, Utah, and Washington (Exhibit 4.20).
- The dollar amount of average employee contributions for employee-plus-one coverage varied by State, from $2,558 in Washington to $4,271 in Texas. States with employee premium contributions for employee-plus-one coverage that exceeded the national average of $3,634 were Louisiana, Rhode Island, Tennessee, and Texas. States with employee contributions for employee plus-one coverage that were smaller than the national average were Idaho, Illinois, Kansas, Nevada, South Carolina, Utah, Washington, and Wyoming (Exhibit 4.21).
- In 2018, the dollar amount of average family-coverage employee contributions varied by State, from $3,862 in Washington to $6,597 in Virginia. States with employee contributions for family coverage that exceeded the national average of $5,431 were District of Columbia, Louisiana, Maryland, and Virginia. States with employee contributions for family coverage that were smaller than the national average were Alaska, Indiana, Michigan, Utah, Washington, and West Virginia (Exhibit 4.22).
Employee Premium Contributions by Industry, 2018
- In 2018, enrollees working in other services paid a higher percentage of their single premiums (25.6 percent) than enrollees in any other industry group (Exhibit 4.23).
- Enrollees working in other services paid a significantly higher percentage of employee-plus-one premiums (33.8 percent) than enrollees in any other industry group except construction (31.9 percent) (Exhibit 4.24).
- Enrollees working in other services paid a significantly higher percentage of family premiums (33.9 percent) than enrollees in any other industry group except agriculture, fisheries, and forestry (36.6 percent) and retail trade (31.7 percent) (Exhibit 4.25).
Employee Premium Contributions by Selected Employer Characteristics, 2018
- In 2018, employee premium contributions were lowest among enrollees working for nonprofit employers and lower among enrollees working for for-profit incorporated employers than among enrollees working for for-profit unincorporated employers for all coverage types (Exhibits 4.26, 4.27, and 4.28).
- Enrolled employees in firms that were 20 years old or older paid lower percentages of premiums for all coverage types (20.7 percent, 26.1 percent, and 26.6 percent for single, employee-plus-one, and family coverage, respectively) than enrolled employees in the other three firm-age categories (0-4, 5-9, and 10-19 years) (Exhibits 4.26, 4.27, and 4.28).
- Employees in firms with two or more locations contributed a lower percentage of premiums for employee-plus-one and family coverage than those with a single location (Exhibits 4.27 and 4.28).
- Enrollees in establishments where less than 25 percent of employees worked full time paid a higher percentage of premiums for single and family coverage than enrollees in establishments with 25 percent or more full-time employees (Exhibits 4.26 and 4.28).
Employee Premium Contributions in Predominantly Low Wage vs. Higher Wage Establishments, 2005 to 2018
- In 2018, enrollees in establishments that were predominantly low wage (50 percent or more of employees earned less than $12.00 per hour) contributed a larger percentage of their premiums than those in higher wage establishments. Employees in low-wage establishments contributed 25.4 percent, 30.5 percent, and 35.8 percent of their premiums for single, employee-plus-one, and family coverage, respectively. In higher wage establishments, the percentages were 20.7 percent, 26.8 percent, and 27.2 percent (Exhibits 4.29, 4.31, and 4.33).
- Enrolled employees in predominantly low-wage establishments contributed a larger percentage of their premiums for single, employee-plus-one, and family coverage than those in higher wage establishments in all years between 2005 and 2018 (Exhibits 4.29, 4.31, and 4.33).
- In 2018, enrollees in low-wage establishments had higher premium contributions for single and family coverage than their counterparts in higher wage establishments. Average employee contributions were $1,583 and $6,441 for single and family coverage, respectively, in predominantly low-wage establishments and $1,405 and $5,360 in higher wage establishments (Exhibits 4.30 and 4.34).
Distributions of Employee Contributions, Overall and by Firm Size, 2018
- In 2018, the average employee premium contribution was about 14 to 19 percent higher than the median (50th percentile) employee premium contribution for all three types of coverage: single coverage ($1,427 vs. $1,200), employee-plus-one coverage ($3,634 vs. $3,200), and family coverage ($5,431 vs. $4,700) (Exhibit 4.35).
- In 2018, the employee premium contribution distribution for all three coverage types showed substantial variation as enrolled employees at the top end of the distribution (90th percentile) paid much larger amounts than those at the bottom end of the distribution (10th percentile):
- For single coverage, $2,800 vs. $0,
- For employee-plus-one coverage, $6,900 vs. $780, and
- For family coverage, $10,000 vs. $1,000 (Exhibit 4.35).
- In 2018, enrolled employees in firms with 100 or more employees had higher required contributions for all coverage types at the 10th and 25th percentiles of the distribution than enrolled employees in firms with fewer than 50 employees (Exhibit 4.35).
- Enrolled employees in small firms (fewer than 50 employees) had no required employee contribution at the 10th and 25th percentiles for all coverage types. Enrolled employees in firms with 50-99 employees had no required contributions at the 10th percentile for single and family coverage (Exhibit 4.35).
- At the 75th and 90th percentiles, employee contributions for all coverage types were lower for enrolled employees in firms with 100 or more employers than firms with fewer than 100 employees (Exhibit 4.35).
Return to Table of Contents
Exhibit 4.1 Average percentage (standard error) of premium contributed by employees for single, employee-plus-one, and family coverage, 2005‑2018
| Coverage |
2005 |
2006 |
2008 |
2009 |
2010 |
2011 |
2012 |
2013 |
2014 |
2015 |
2016 |
2017 |
2018 |
| Single |
18.1% |
19.1% |
20.1% |
20.5% |
20.7% |
20.9% |
20.8% |
21.0% |
21.2% |
21.1% |
21.7% |
22.2% |
21.3% |
| (Standard Error) |
(0.4%) |
(0.4%) |
(0.2%) |
(0.3%) |
(0.2%) |
(0.2%) |
(0.3%) |
(0.3%) |
(0.2%) |
(0.2%) |
(0.2%) |
(0.2%) |
(0.2%) |
| Plus One |
22.9% |
23.8% |
27.0% |
26.1% |
25.8% |
26.5% |
26.6% |
26.7% |
26.9% |
27.3% |
27.8% |
27.6% |
27.1% |
| (Standard Error) |
(0.4%) |
(0.4%) |
(0.3%) |
(0.3%) |
(0.3%) |
(0.3%) |
(0.4%) |
(0.2%) |
(0.3%) |
(0.3%) |
(0.3%) |
(0.3%) |
(0.3%) |
| Family |
24.1% |
25.4% |
27.6% |
26.7% |
26.8% |
26.4% |
27.4% |
27.6% |
27.1% |
27.2% |
28.0% |
27.9% |
27.8% |
| (Standard Error) |
(0.4%) |
(0.3%) |
(0.4%) |
(0.3%) |
(0.4%) |
(0.3%) |
(0.4%) |
(0.3%) |
(0.3%) |
(0.3%) |
(0.3%) |
(0.4%) |
(0.3%) |
|
Source: Medical Expenditure Panel Survey-Insurance Component, private-sector establishments, 2005‑2018.
Note: Medical Expenditure Panel Survey-Insurance Component estimates are not available for 2007.
|
Return to Table of Contents
Exhibit 4.2 Average annual employee contribution (in dollars) (standard error) for single, employee-plus-one, and family coverage, 2005‑2018
| Coverage |
2005 |
2006 |
2008 |
2009 |
2010 |
2011 |
2012 |
2013 |
2014 |
2015 |
2016 |
2017 |
2018 |
| Single |
$723 |
$788 |
$882 |
$957 |
$1,021 |
$1,090 |
$1,118 |
$1,170 |
$1,234 |
$1,255 |
$1,325 |
$1,415 |
$1,427 |
| (Standard Error) |
($14) |
($16) |
($6) |
($13) |
($14) |
($9) |
($14) |
($16) |
($13) |
($14) |
($13) |
($15) |
($14) |
| Plus One |
$1,759 |
$1,903 |
$2,303 |
$2,363 |
$2,498 |
$2,736 |
$2,824 |
$2,940 |
$3,097 |
$3,220 |
$3,376 |
$3,531 |
$3,634 |
| (Standard Error) |
($29) |
($24) |
($22) |
($27) |
($42) |
($36) |
($46) |
($23) |
($40) |
($35) |
($36) |
($39) |
($39) |
| Family |
$2,585 |
$2,890 |
$3,394 |
$3,474 |
$3,721 |
$3,962 |
$4,236 |
$4,421 |
$4,518 |
$4,710 |
$4,956 |
$5,218 |
$5,431 |
| (Standard Error) |
($38) |
($34) |
($54) |
($44) |
($53) |
($42) |
($69) |
($50) |
($48) |
($56) |
($56) |
($64) |
($63) |
|
Source: Medical Expenditure Panel Survey-Insurance Component, private-sector establishments, 2005‑2018.
Note: Medical Expenditure Panel Survey-Insurance Component estimates are not available for 2007.
|
Return to Table of Contents
Exhibit 4.3 Average annual employee contribution, employer contribution, and total premium (standard error) for single coverage, 2005‑2018
| Type of Premium |
2005 |
2006 |
2008 |
2009 |
2010 |
2011 |
2012 |
2013 |
2014 |
2015 |
2016 |
2017 |
2018 |
| Total Premium |
$3,991 |
$4,118 |
$4,386 |
$4,669 |
$4,940 |
$5,222 |
$5,384 |
$5,571 |
$5,832 |
$5,963 |
$6,101 |
$6,368 |
$6,715 |
| (Standard Error) |
($24) |
($25) |
($15) |
($21) |
($22) |
($26) |
($28) |
($23) |
($25) |
($26) |
($27) |
($28) |
($31) |
| Employer Contribution |
$3,268 |
$3,330 |
$3,505 |
$3,713 |
$3,918 |
$4,132 |
$4,267 |
$4,401 |
$4,598 |
$4,708 |
$4,776 |
$4,953 |
$5,288 |
| (Standard Error) |
($27) |
($28) |
($17) |
($25) |
($19) |
($25) |
($28) |
($21) |
($25) |
($26) |
($26) |
($29) |
($31) |
| Employee Contribution |
$723 |
$788 |
$882 |
$957 |
$1,021 |
$1,090 |
$1,118 |
$1,170 |
$1,234 |
$1,255 |
$1,325 |
$1,415 |
$1,427 |
| (Standard Error) |
($14) |
($16) |
($6) |
($13) |
($14) |
($9) |
($14) |
($16) |
($13) |
($14) |
($13) |
($15) |
($14) |
|
Source: Medical Expenditure Panel Survey-Insurance Component, private-sector establishments, 2005‑2018.
Note: Medical Expenditure Panel Survey-Insurance Component estimates are not available for 2007. The sum of employee and employer contributions may not exactly equal the total premium due to rounding.
|
Return to Table of Contents
Exhibit 4.4 Average annual employee contribution, employer contribution, and total premium (standard error) for employee-plus-one coverage, 2005‑2018
| Type of Premium |
2005 |
2006 |
2008 |
2009 |
2010 |
2011 |
2012 |
2013 |
2014 |
2015 |
2016 |
2017 |
2018 |
| Total Premium |
$7,671 |
$7,988 |
$8,535 |
$9,053 |
$9,664 |
$10,329 |
$10,621 |
$10,990 |
$11,503 |
$11,800 |
$12,124 |
$12,789 |
$13,425 |
| (Standard Error) |
($44) |
($48) |
($43) |
($34) |
($60) |
($105) |
($56) |
($54) |
($60) |
($58) |
($60) |
($70) |
($70) |
| Employer Contribution |
$5,911 |
$6,086 |
$6,231 |
$6,690 |
$7,167 |
$7,593 |
$7,797 |
$8,050 |
$8,406 |
$8,579 |
$8,748 |
$9,258 |
$9,791 |
| (Standard Error) |
($51) |
($59) |
($43) |
($44) |
($40) |
($95) |
($45) |
($55) |
($65) |
($57) |
($61) |
($75) |
($70) |
| Employee Contribution |
$1,759 |
$1,903 |
$2,303 |
$2,363 |
$2,498 |
$2,736 |
$2,824 |
$2,940 |
$3,097 |
$3,220 |
$3,376 |
$3,531 |
$3,634 |
| (Standard Error) |
($29) |
($24) |
($22) |
($27) |
($42) |
($36) |
($46) |
($23) |
($40) |
($35) |
($36) |
($39) |
($39) |
|
Source: Medical Expenditure Panel Survey-Insurance Component, private-sector establishments, 2005‑2018.
Note: Medical Expenditure Panel Survey-Insurance Component estimates are not available for 2007. The sum of employee and employer contributions may not exactly equal the total premium due to rounding.
|
Return to Table of Contents
Exhibit 4.5 Average annual employee contribution, employer contribution, and total premium (standard error) for family coverage, 2005‑2018
| Type of Premium |
2005 |
2006 |
2008 |
2009 |
2010 |
2011 |
2012 |
2013 |
2014 |
2015 |
2016 |
2017 |
2018 |
| Total Premium |
$10,728 |
$11,381 |
$12,298 |
$13,027 |
$13,871 |
$15,022 |
$15,473 |
$16,029 |
$16,655 |
$17,322 |
$17,710 |
$18,687 |
$19,565 |
| (Standard Error) |
($41) |
($32) |
($81) |
($25) |
($75) |
($98) |
($95) |
($61) |
($79) |
($95) |
($84) |
($105) |
($104) |
| Employer Contribution |
$8,143 |
$8,491 |
$8,904 |
$9,553 |
$10,150 |
$11,060 |
$11,238 |
$11,608 |
$12,137 |
$12,612 |
$12,754 |
$13,469 |
$14,134 |
| (Standard Error) |
($52) |
($30) |
($77) |
($48) |
($94) |
($98) |
($74) |
($48) |
($82) |
($94) |
($90) |
($113) |
($110) |
| Employee Contribution |
$2,585 |
$2,890 |
$3,394 |
$3,474 |
$3,721 |
$3,962 |
$4,236 |
$4,421 |
$4,518 |
$4,710 |
$4,956 |
$5,218 |
$5,431 |
| (Standard Error) |
($38) |
($34) |
($54) |
($44) |
($53) |
($42) |
($69) |
($50) |
($48) |
($56) |
($56) |
($64) |
($63) |
|
Source: Medical Expenditure Panel Survey-Insurance Component, private-sector establishments, 2005‑2018.
Note: Medical Expenditure Panel Survey-Insurance Component estimates are not available for 2007. The sum of employee and employer contributions may not exactly equal the total premium due to rounding.
|
Return to Table of Contents
Exhibit 4.6 Average percentage (standard error) of premium contributed by employees for single coverage by firm size, 2005‑2018
| Number of Employees |
2005 |
2006 |
2008 |
2009 |
2010 |
2011 |
2012 |
2013 |
2014 |
2015 |
2016 |
2017 |
2018 |
| U.S. |
18.1% |
19.1% |
20.1% |
20.5% |
20.7% |
20.9% |
20.8% |
21.0% |
21.2% |
21.1% |
21.7% |
22.2% |
21.3% |
| (Standard Error) |
(0.4%) |
(0.4%) |
(0.2%) |
(0.3%) |
(0.2%) |
(0.2%) |
(0.3%) |
(0.3%) |
(0.2%) |
(0.2%) |
(0.2%) |
(0.2%) |
(0.2%) |
| <50 |
15.5% |
16.5% |
17.6% |
17.9% |
18.3% |
18.3% |
17.9% |
18.6% |
17.6% |
17.9% |
20.0% |
20.0% |
20.3% |
| (Standard Error) |
(0.6%) |
(0.7%) |
(0.5%) |
(0.3%) |
(0.6%) |
(0.4%) |
(0.4%) |
(0.4%) |
(0.5%) |
(0.5%) |
(0.5%) |
(0.5%) |
(0.6%) |
| 50-99 |
21.4% |
18.2% |
20.4% |
19.4% |
22.0% |
22.7% |
20.9% |
21.5% |
22.0% |
21.8% |
24.3% |
21.9% |
24.4% |
| (Standard Error) |
(1.5%) |
(1.0%) |
(0.9%) |
(1.3%) |
(0.8%) |
(1.2%) |
(0.7%) |
(1.0%) |
(1.0%) |
(1.1%) |
(1.0%) |
(0.9%) |
(0.9%) |
| 100+ |
18.7% |
20.1% |
20.9% |
21.4% |
21.3% |
21.5% |
21.6% |
21.7% |
22.0% |
21.8% |
21.9% |
22.8% |
21.2% |
| (Standard Error) |
(0.3%) |
(0.4%) |
(0.2%) |
(0.4%) |
(0.4%) |
(0.2%) |
(0.3%) |
(0.2%) |
(0.2%) |
(0.3%) |
(0.2%) |
(0.3%) |
(0.2%) |
|
Source: Medical Expenditure Panel Survey-Insurance Component, private-sector establishments, 2005‑2018.
Note: Medical Expenditure Panel Survey-Insurance Component estimates are not available for 2007.
|
Return to Table of Contents
Exhibit 4.7 Average annual employee contribution (in dollars) (standard error) for single coverage, by firm size, 2005‑2018
| Number of Employees |
2005 |
2006 |
2008 |
2009 |
2010 |
2011 |
2012 |
2013 |
2014 |
2015 |
2016 |
2017 |
2018 |
| <50 |
$641 |
$705 |
$794 |
$834 |
$907 |
$960 |
$979 |
$1,045 |
$1,035 |
$1,065 |
$1,216 |
$1,287 |
$1,351 |
| (Standard Error) |
($20) |
($26) |
($22) |
($12) |
($29) |
($22) |
($20) |
($27) |
($30) |
($29) |
($32) |
($34) |
($39) |
| 50-99 |
$846 |
$737 |
$861 |
$896 |
$1,035 |
$1,101 |
$1,096 |
$1,145 |
$1,220 |
$1,230 |
$1,393 |
$1,349 |
$1,534 |
| (Standard Error) |
($72) |
($40) |
($36) |
($57) |
($34) |
($64) |
($37) |
($59) |
($57) |
($65) |
($60) |
($50) |
($51) |
| 100+ |
$737 |
$821 |
$912 |
$1,000 |
$1,054 |
$1,127 |
$1,159 |
$1,209 |
$1,287 |
$1,307 |
$1,343 |
$1,451 |
$1,433 |
| (Standard Error) |
($14) |
($19) |
($11) |
($16) |
($20) |
($9) |
($16) |
($13) |
($15) |
($17) |
($15) |
($18) |
($16) |
|
Source: Medical Expenditure Panel Survey-Insurance Component, private-sector establishments, 2005‑2018.
Note: Medical Expenditure Panel Survey-Insurance Component estimates are not available for 2007.
|
Return to Table of Contents
Exhibit 4.8 Average percentage (standard error) of premium contributed by employees for employee-plus-one coverage, by firm size, 2005‑2018
| Number of Employees |
2005 |
2006 |
2008 |
2009 |
2010 |
2011 |
2012 |
2013 |
2014 |
2015 |
2016 |
2017 |
2018 |
| U.S. |
22.9% |
23.8% |
27.0% |
26.1% |
25.8% |
26.5% |
26.6% |
26.7% |
26.9% |
27.3% |
27.8% |
27.6% |
27.1% |
| (Standard Error) |
(0.4%) |
(0.4%) |
(0.3%) |
(0.3%) |
(0.3%) |
(0.3%) |
(0.4%) |
(0.2%) |
(0.3%) |
(0.3%) |
(0.3%) |
(0.3%) |
(0.3%) |
| <50 |
25.7% |
26.7% |
28.3% |
29.0% |
28.8% |
28.7% |
28.5% |
28.2% |
28.8% |
29.6% |
29.4% |
29.9% |
30.8% |
| (Standard Error) |
(1.4%) |
(0.8%) |
(0.8%) |
(1.0%) |
(0.8%) |
(0.8%) |
(0.9%) |
(1.0%) |
(0.8%) |
(0.9%) |
(0.9%) |
(1.0%) |
(0.9%) |
| 50-99 |
30.1% |
31.1% |
34.4% |
32.8% |
33.3% |
33.2% |
33.3% |
34.0% |
33.4% |
34.6% |
35.8% |
36.5% |
37.6% |
| (Standard Error) |
(2.4%) |
(1.6%) |
(1.1%) |
(0.9%) |
(1.5%) |
(0.7%) |
(0.8%) |
(1.0%) |
(1.4%) |
(1.5%) |
(1.3%) |
(1.3%) |
(1.3%) |
| 100+ |
21.9% |
22.8% |
26.2% |
25.1% |
24.8% |
25.7% |
25.8% |
26.0% |
26.2% |
26.4% |
27.0% |
26.7% |
25.9% |
| (Standard Error) |
(0.4%) |
(0.4%) |
(0.3%) |
(0.4%) |
(0.4%) |
(0.4%) |
(0.4%) |
(0.3%) |
(0.4%) |
(0.3%) |
(0.3%) |
(0.3%) |
(0.3%) |
|
Source: Medical Expenditure Panel Survey-Insurance Component, private-sector establishments, 2005‑2018.
Note: Medical Expenditure Panel Survey-Insurance Component estimates are not available for 2007.
|
Return to Table of Contents
Exhibit 4.9 Average annual employee contribution (in dollars) (standard error) for employee-plus-one coverage, by firm size, 2005‑2018
| Number of Employees |
2005 |
2006 |
2008 |
2009 |
2010 |
2011 |
2012 |
2013 |
2014 |
2015 |
2016 |
2017 |
2018 |
| <50 |
$2,016 |
$2,168 |
$2,442 |
$2,648 |
$2,836 |
$2,942 |
$3,004 |
$3,117 |
$3,275 |
$3,454 |
$3,479 |
$3,760 |
$4,017 |
| (Standard Error) |
($95) |
($66) |
($67) |
($114) |
($84) |
($84) |
($87) |
($107) |
($95) |
($101) |
($101) |
($130) |
($120) |
| 50-99 |
$2,300 |
$2,414 |
$2,894 |
$2,901 |
$3,056 |
$3,189 |
$3,389 |
$3,630 |
$3,619 |
$3,765 |
$4,077 |
$4,358 |
$4,732 |
| (Standard Error) |
($187) |
($104) |
($101) |
($55) |
($121) |
($68) |
($87) |
($86) |
($140) |
($174) |
($131) |
($176) |
($161) |
| 100+ |
$1,673 |
$1,823 |
$2,235 |
$2,270 |
$2,398 |
$2,670 |
$2,751 |
$2,862 |
$3,031 |
$3,144 |
$3,307 |
$3,445 |
$3,504 |
| (Standard Error) |
($23) |
($33) |
($33) |
($35) |
($46) |
($48) |
($49) |
($30) |
($46) |
($37) |
($40) |
($41) |
($43) |
|
Source: Medical Expenditure Panel Survey-Insurance Component, private-sector establishments, 2005‑2018.
Note: Medical Expenditure Panel Survey-Insurance Component estimates are not available for 2007.
|
Return to Table of Contents
Exhibit 4.10 Average percentage (standard error) of premium contributed by employees for family coverage, by firm size, 2005‑2018
| Number of Employees |
2005 |
2006 |
2008 |
2009 |
2010 |
2011 |
2012 |
2013 |
2014 |
2015 |
2016 |
2017 |
2018 |
| U.S. |
24.1% |
25.4% |
27.6% |
26.7% |
26.8% |
26.4% |
27.4% |
27.6% |
27.1% |
27.2% |
28.0% |
27.9% |
27.8% |
| (Standard Error) |
(0.4%) |
(0.3%) |
(0.4%) |
(0.3%) |
(0.4%) |
(0.3%) |
(0.4%) |
(0.3%) |
(0.3%) |
(0.3%) |
(0.3%) |
(0.4%) |
(0.3%) |
| <50 |
27.6% |
28.0% |
29.6% |
30.1% |
31.3% |
29.4% |
30.1% |
28.6% |
28.4% |
28.8% |
27.4% |
30.7% |
32.0% |
| (Standard Error) |
(0.7%) |
(0.9%) |
(0.9%) |
(0.6%) |
(0.4%) |
(0.9%) |
(0.9%) |
(1.0%) |
(0.8%) |
(1.0%) |
(0.9%) |
(1.1%) |
(1.1%) |
| 50-99 |
33.1% |
32.3% |
33.3% |
33.0% |
34.2% |
33.0% |
31.6% |
34.9% |
33.1% |
33.7% |
35.9% |
32.4% |
37.9% |
| (Standard Error) |
(1.4%) |
(2.2%) |
(1.4%) |
(1.0%) |
(1.7%) |
(1.3%) |
(0.8%) |
(1.3%) |
(1.3%) |
(1.6%) |
(1.8%) |
(1.7%) |
(1.9%) |
| 100+ |
22.8% |
24.4% |
26.9% |
25.6% |
25.5% |
25.5% |
26.7% |
26.9% |
26.5% |
26.5% |
27.6% |
27.3% |
26.6% |
| (Standard Error) |
(0.5%) |
(0.2%) |
(0.5%) |
(0.4%) |
(0.5%) |
(0.4%) |
(0.3%) |
(0.3%) |
(0.3%) |
(0.3%) |
(0.3%) |
(0.4%) |
(0.3%) |
|
Source: Medical Expenditure Panel Survey-Insurance Component, private-sector establishments, 2005‑2018.
Note: Medical Expenditure Panel Survey-Insurance Component estimates are not available for 2007.
|
Return to Table of Contents
Exhibit 4.11 Average annual employee contribution (in dollars) (standard error) for family coverage, by firm size, 2005‑2018
| Number of Employees |
2005 |
2006 |
2008 |
2009 |
2010 |
2011 |
2012 |
2013 |
2014 |
2015 |
2016 |
2017 |
2018 |
| <50 |
$2,930 |
$3,101 |
$3,458 |
$3,630 |
$4,117 |
$4,144 |
$4,366 |
$4,228 |
$4,426 |
$4,587 |
$4,510 |
$5,413 |
$5,854 |
| (Standard Error) |
($62) |
($110) |
($79) |
($60) |
($63) |
($148) |
($135) |
($155) |
($122) |
($156) |
($146) |
($188) |
($188) |
| 50-99 |
$3,511 |
$3,536 |
$3,852 |
$4,102 |
$4,455 |
$4,669 |
$4,866 |
$5,360 |
$5,206 |
$5,502 |
$5,821 |
$5,738 |
$6,973 |
| (Standard Error) |
($176) |
($239) |
($168) |
($128) |
($196) |
($143) |
($150) |
($201) |
($220) |
($255) |
($330) |
($317) |
($336) |
| 100+ |
$2,455 |
$2,801 |
$3,348 |
$3,393 |
$3,588 |
$3,882 |
$4,169 |
$4,387 |
$4,483 |
$4,671 |
$4,971 |
$5,154 |
$5,277 |
| (Standard Error) |
($46) |
($28) |
($63) |
($58) |
($60) |
($62) |
($77) |
($53) |
($54) |
($62) |
($62) |
($70) |
($68) |
|
Source: Medical Expenditure Panel Survey-Insurance Component, private-sector establishments, 2005‑2018.
Note: Medical Expenditure Panel Survey-Insurance Component estimates are not available for 2007.
|
Return to Table of Contents
Exhibit 4.12 Average percentage (standard error) of premium contributed by employees for single, employee-plus-one, and family coverage, by firm size, 2018
| Number of Employees |
Single |
Employee-Plus-One |
Family |
| United States |
21.3% |
27.1% |
27.8% |
| (Standard Error) |
(0.2%) |
(0.3%) |
(0.3%) |
| Firm size in 3 categories |
|
|
|
| <50 |
20.3% |
30.8% |
32.0% |
| (Standard Error) |
(0.6%) |
(0.9%) |
(1.1%) |
| 50-99 |
24.4% |
37.6% |
37.9% |
| (Standard Error) |
(0.9%) |
(1.3%) |
(1.9%) |
| 100+ |
21.2% |
25.9% |
26.6% |
| (Standard Error) |
(0.2%) |
(0.3%) |
(0.3%) |
| Firm size in 5 categories |
|
|
|
| <10 |
17.7% |
21.5% |
23.2% |
| (Standard Error) |
(1.1%) |
(1.8%) |
(1.9%) |
| 10-24 |
20.1% |
34.9% |
34.2% |
| (Standard Error) |
(1.0%) |
(1.6%) |
(1.9%) |
| 25-99 |
23.7% |
36.4% |
37.7% |
| (Standard Error) |
(0.6%) |
(1.0%) |
(1.3%) |
| 100-999 |
21.6% |
30.4% |
30.6% |
| (Standard Error) |
(0.5%) |
(0.7%) |
(0.9%) |
| 1,000+ |
21.0% |
24.5% |
25.4% |
| (Standard Error) |
(0.3%) |
(0.3%) |
(0.4%) |
|
Source: Medical Expenditure Panel Survey-Insurance Component, private-sector establishments, 2018.
|
Return to Table of Contents
Exhibit 4.13 Average premium (in dollars) (standard error) contributed by employees for single, employee-plus-one, and family coverage, by firm size, 2018
| Number of Employees |
Single |
Employee-Plus-One |
Family |
| United States |
$1,427 |
$3,634 |
$5,431 |
| (Standard Error) |
($14) |
($39) |
($63) |
| Firm size in 3 categories |
|
|
|
| <50 |
$1,351 |
$4,017 |
$5,854 |
| (Standard Error) |
($39) |
($120) |
($188) |
| 50-99 |
$1,534 |
$4,732 |
$6,973 |
| (Standard Error) |
($51) |
($161) |
($336) |
| 100+ |
$1,433 |
$3,504 |
$5,277 |
| (Standard Error) |
($16) |
($43) |
($68) |
| Firm size in 5 categories |
|
|
|
| <10 |
$1,237 |
$2,885 |
$4,163 |
| (Standard Error) |
($74) |
($242) |
($336) |
| 10-24 |
$1,338 |
$4,471 |
$6,489 |
| (Standard Error) |
($75) |
($210) |
($343) |
| 25-99 |
$1,504 |
$4,644 |
$6,852 |
| (Standard Error) |
($36) |
($116) |
($220) |
| 100-999 |
$1,449 |
$4,131 |
$5,941 |
| (Standard Error) |
($32) |
($91) |
($169) |
| 1,000+ |
$1,427 |
$3,317 |
$5,059 |
| (Standard Error) |
($19) |
($48) |
($71) |
|
Source: Medical Expenditure Panel Survey-Insurance Component, private-sector establishments, 2018.
|
Return to Table of Contents
Exhibit 4.14 Percentage (standard error) of single coverage enrollees with no employee premium contribution, overall and by detailed firm size, 2005‑2018
| Number of Employees |
2005 |
2006 |
2008 |
2009 |
2010 |
2011 |
2012 |
2013 |
2014 |
2015 |
2016 |
2017 |
2018 |
| U.S. |
23.1% |
21.9% |
22.0% |
20.6% |
18.3% |
17.3% |
17.1% |
16.6% |
15.6% |
15.8% |
13.5% |
13.4% |
13.2% |
| (Standard Error) |
(0.8%) |
(0.9%) |
(0.4%) |
(0.5%) |
(0.7%) |
(0.6%) |
(0.6%) |
(0.6%) |
(0.4%) |
(0.5%) |
(0.5%) |
(0.4%) |
(0.4%) |
| <10 |
67.0% |
65.1% |
63.0% |
61.4% |
58.8% |
58.6% |
60.0% |
59.9% |
60.6% |
60.5% |
57.9% |
52.3% |
51.8% |
| (Standard Error) |
(1.4%) |
(2.0%) |
(1.4%) |
(1.2%) |
(1.6%) |
(1.1%) |
(1.6%) |
(2.0%) |
(1.6%) |
(1.8%) |
(1.9%) |
(2.0%) |
(2.0%) |
| 10-24 |
49.1% |
49.4% |
46.0% |
45.4% |
43.3% |
38.9% |
43.5% |
41.2% |
43.5% |
44.2% |
36.9% |
38.2% |
39.2% |
| (Standard Error) |
(1.6%) |
(2.6%) |
(1.6%) |
(1.4%) |
(1.8%) |
(1.5%) |
(1.4%) |
(1.3%) |
(1.9%) |
(1.9%) |
(1.8%) |
(2.1%) |
(2.0%) |
| 25-99 |
36.7% |
34.7% |
34.0% |
33.1% |
29.2% |
30.6% |
27.7% |
27.6% |
27.2% |
27.5% |
22.9% |
23.1% |
20.8% |
| (Standard Error) |
(1.8%) |
(1.9%) |
(1.1%) |
(1.6%) |
(1.8%) |
(1.7%) |
(1.4%) |
(1.3%) |
(1.4%) |
(1.6%) |
(1.2%) |
(1.3%) |
(1.2%) |
| 100-999 |
22.2% |
20.0% |
21.4% |
17.7% |
16.7% |
15.2% |
16.5% |
14.4% |
14.9% |
13.9% |
13.4% |
14.3% |
12.6% |
| (Standard Error) |
(1.6%) |
(2.0%) |
(1.1%) |
(1.0%) |
(1.3%) |
(1.4%) |
(1.0%) |
(0.8%) |
(1.2%) |
(1.1%) |
(1.3%) |
(1.2%) |
(1.0%) |
| 1,000+ |
8.2% |
7.7% |
8.3% |
8.9% |
6.5% |
5.7% |
5.3% |
5.2% |
3.7% |
4.9% |
4.1% |
3.9% |
4.9% |
| (Standard Error) |
(0.6%) |
(0.5%) |
(0.4%) |
(0.7%) |
(0.8%) |
(0.7%) |
(0.4%) |
(0.8%) |
(0.4%) |
(0.4%) |
(0.5%) |
(0.4%) |
(0.4%) |
|
Source: Medical Expenditure Panel Survey-Insurance Component, private-sector establishments, 2005‑2018.
Note: Medical Expenditure Panel Survey-Insurance Component estimates are not available for 2007.
|
Return to Table of Contents
Exhibit 4.15 Percentage (standard error) of employee-plus-one coverage enrollees with no employee premium contribution, overall and by detailed firm size, 2005‑2018
| Number of Employees |
2005 |
2006 |
2008 |
2009 |
2010 |
2011 |
2012 |
2013 |
2014 |
2015 |
2016 |
2017 |
2018 |
| U.S. |
12.7% |
11.6% |
9.4% |
10.3% |
9.8% |
7.9% |
7.7% |
6.9% |
7.8% |
7.6% |
7.4% |
7.3% |
7.1% |
| (Standard Error) |
(0.5%) |
(0.7%) |
(0.3%) |
(0.7%) |
(0.9%) |
(0.5%) |
(0.3%) |
(0.4%) |
(0.4%) |
(0.5%) |
(0.5%) |
(0.4%) |
(0.4%) |
| <10 |
62.7% |
49.5% |
52.1% |
47.9% |
50.1% |
46.6% |
54.7% |
49.0% |
48.3% |
48.3% |
48.2% |
49.7% |
49.9% |
| (Standard Error) |
(1.7%) |
(3.1%) |
(2.8%) |
(1.7%) |
(2.0%) |
(2.3%) |
(2.1%) |
(3.3%) |
(2.7%) |
(3.1%) |
(3.2%) |
(3.4%) |
(3.3%) |
| 10-24 |
32.5% |
30.8% |
29.0% |
28.8% |
25.3% |
29.1% |
24.0% |
24.5% |
24.3% |
23.1% |
21.8% |
22.4% |
18.9% |
| (Standard Error) |
(2.9%) |
(3.1%) |
(2.0%) |
(1.4%) |
(2.4%) |
(1.9%) |
(2.8%) |
(3.0%) |
(2.2%) |
(2.3%) |
(2.1%) |
(2.6%) |
(2.1%) |
| 25-99 |
14.7% |
17.1% |
13.8% |
12.3% |
12.4% |
12.8% |
10.9% |
10.0% |
12.1% |
13.9% |
10.1% |
11.2% |
9.8% |
| (Standard Error) |
(2.2%) |
(1.5%) |
(1.4%) |
(1.5%) |
(1.3%) |
(1.0%) |
(0.7%) |
(0.7%) |
(1.5%) |
(1.5%) |
(1.1%) |
(1.5%) |
(1.2%) |
| 100-999 |
10.2% |
10.5% |
7.1% |
8.3% |
6.8% |
5.9% |
5.0% |
5.6% |
5.8% |
4.9% |
5.0% |
5.5% |
5.4% |
| (Standard Error) |
(0.8%) |
(1.4%) |
(0.8%) |
(1.5%) |
(0.9%) |
(1.0%) |
(1.0%) |
(0.6%) |
(1.1%) |
(0.7%) |
(1.0%) |
(0.8%) |
(0.8%) |
| 1,000+ |
7.6% |
6.9% |
4.8% |
6.6% |
6.2% |
3.7% |
3.7% |
3.3% |
4.4% |
4.3% |
4.6% |
4.3% |
4.2% |
| (Standard Error) |
(0.8%) |
(0.8%) |
(0.4%) |
(0.9%) |
(1.2%) |
(0.7%) |
(0.5%) |
(0.4%) |
(0.5%) |
(0.6%) |
(0.7%) |
(0.5%) |
(0.4%) |
|
Source: Medical Expenditure Panel Survey-Insurance Component, private-sector establishments, 2005‑2018.
Note: Medical Expenditure Panel Survey-Insurance Component estimates are not available for 2007.
|
Return to Table of Contents
Exhibit 4.16 Percentage (standard error) of family coverage enrollees with no employee premium contribution, overall and by detailed firm size, 2005‑2018
| Number of Employees |
2005 |
2006 |
2008 |
2009 |
2010 |
2011 |
2012 |
2013 |
2014 |
2015 |
2016 |
2017 |
2018 |
| U.S. |
13.4% |
12.6% |
10.7% |
11.4% |
10.4% |
9.7% |
8.1% |
7.9% |
9.2% |
8.9% |
8.3% |
8.8% |
7.7% |
| (Standard Error) |
(0.5%) |
(0.4%) |
(0.4%) |
(0.7%) |
(0.5%) |
(0.5%) |
(0.4%) |
(0.6%) |
(0.5%) |
(0.5%) |
(0.5%) |
(0.6%) |
(0.5%) |
| <10 |
58.7% |
51.7% |
57.3% |
54.2% |
51.4% |
53.2% |
50.9% |
53.0% |
53.6% |
54.4% |
52.9% |
52.0% |
50.2% |
| (Standard Error) |
(1.1%) |
(3.2%) |
(2.3%) |
(1.4%) |
(0.9%) |
(1.3%) |
(2.7%) |
(3.5%) |
(2.2%) |
(2.6%) |
(2.7%) |
(2.8%) |
(3.2%) |
| 10-24 |
32.9% |
34.1% |
29.5% |
31.0% |
29.2% |
29.8% |
29.6% |
28.2% |
27.4% |
29.5% |
35.8% |
27.3% |
26.4% |
| (Standard Error) |
(1.8%) |
(2.5%) |
(2.8%) |
(1.5%) |
(1.6%) |
(1.4%) |
(2.8%) |
(2.6%) |
(2.2%) |
(2.6%) |
(2.9%) |
(2.6%) |
(2.5%) |
| 25-99 |
15.9% |
20.5% |
17.4% |
15.1% |
15.3% |
16.9% |
13.4% |
17.0% |
17.7% |
17.9% |
18.6% |
19.5% |
13.9% |
| (Standard Error) |
(1.7%) |
(1.8%) |
(2.1%) |
(1.9%) |
(1.9%) |
(1.8%) |
(1.0%) |
(1.7%) |
(2.0%) |
(2.0%) |
(2.3%) |
(2.3%) |
(1.7%) |
| 100-999 |
11.7% |
10.3% |
9.0% |
9.1% |
7.6% |
9.6% |
6.3% |
7.0% |
9.6% |
8.7% |
5.8% |
8.7% |
7.6% |
| (Standard Error) |
(2.0%) |
(1.2%) |
(1.0%) |
(1.6%) |
(1.2%) |
(1.6%) |
(0.9%) |
(1.4%) |
(1.3%) |
(1.5%) |
(0.9%) |
(1.7%) |
(1.2%) |
| 1,000+ |
7.7% |
6.3% |
4.6% |
5.9% |
5.1% |
4.0% |
3.3% |
2.0% |
3.4% |
3.3% |
2.7% |
3.1% |
2.9% |
| (Standard Error) |
(0.7%) |
(0.5%) |
(0.6%) |
(0.7%) |
(0.9%) |
(0.7%) |
(0.5%) |
(0.3%) |
(0.6%) |
(0.5%) |
(0.6%) |
(0.6%) |
(0.5%) |
|
Source: Medical Expenditure Panel Survey-Insurance Component, private-sector establishments, 2005‑2018.
Note: Medical Expenditure Panel Survey-Insurance Component estimates are not available for 2007.
|
Return to Table of Contents
Exhibit 4.17 Average percentage (standard error) of premium contributed by employees for single coverage, by State, 2018
| Alabama |
23.9% |
Kentucky |
24.4% |
North Dakota |
18.8%* |
| (Standard Error) |
(1.4%) |
(Standard Error) |
(2.8%) |
(Standard Error) |
(1.0%) |
| Alaska |
13.7%* |
Louisiana |
24.2%* |
Ohio |
24.0%* |
| (Standard Error) |
(1.2%) |
(Standard Error) |
(1.4%) |
(Standard Error) |
(1.2%) |
| Arizona |
25.0%* |
Maine |
21.3% |
Oklahoma |
19.5% |
| (Standard Error) |
(1.4%) |
(Standard Error) |
(1.8%) |
(Standard Error) |
(1.3%) |
| Arkansas |
23.0% |
Maryland |
23.7% |
Oregon |
16.5%* |
| (Standard Error) |
(1.3%) |
(Standard Error) |
(1.5%) |
(Standard Error) |
(1.0%) |
| California |
18.4%* |
Massachusetts |
25.6%* |
Pennsylvania |
20.0% |
| (Standard Error) |
(0.7%) |
(Standard Error) |
(1.5%) |
(Standard Error) |
(0.9%) |
| Colorado |
20.6% |
Michigan |
22.7% |
Rhode Island |
25.8%* |
| (Standard Error) |
(1.1%) |
(Standard Error) |
(1.1%) |
(Standard Error) |
(1.1%) |
| Connecticut |
23.0% |
Minnesota |
23.2% |
South Carolina |
21.3% |
| (Standard Error) |
(1.1%) |
(Standard Error) |
(1.1%) |
(Standard Error) |
(2.1%) |
| Delaware |
19.6% |
Mississippi |
22.8% |
South Dakota |
22.2% |
| (Standard Error) |
(1.0%) |
(Standard Error) |
(1.4%) |
(Standard Error) |
(0.9%) |
| District of Columbia |
18.9%* |
Missouri |
21.1% |
Tennessee |
23.6% |
| (Standard Error) |
(1.0%) |
(Standard Error) |
(1.1%) |
(Standard Error) |
(1.3%) |
| Florida |
22.1% |
Montana |
16.2%* |
Texas |
21.4% |
| (Standard Error) |
(1.0%) |
(Standard Error) |
(1.3%) |
(Standard Error) |
(0.9%) |
| Georgia |
21.7% |
Nebraska |
20.3% |
Utah |
19.3% |
| (Standard Error) |
(1.0%) |
(Standard Error) |
(1.3%) |
(Standard Error) |
(1.2%) |
| Hawaii |
11.7%* |
Nevada |
22.5% |
Vermont |
21.0% |
| (Standard Error) |
(1.2%) |
(Standard Error) |
(1.9%) |
(Standard Error) |
(1.2%) |
| Idaho |
19.4% |
New Hampshire |
21.8% |
Virginia |
26.3%* |
| (Standard Error) |
(1.6%) |
(Standard Error) |
(1.7%) |
(Standard Error) |
(1.9%) |
| Illinois |
21.7% |
New Jersey |
21.3% |
Washington |
14.4%* |
| (Standard Error) |
(1.1%) |
(Standard Error) |
(1.1%) |
(Standard Error) |
(1.1%) |
| Indiana |
20.4% |
New Mexico |
23.5% |
West Virginia |
19.6% |
| (Standard Error) |
(1.1%) |
(Standard Error) |
(2.3%) |
(Standard Error) |
(1.2%) |
| Iowa |
23.4%* |
New York |
20.4% |
Wisconsin |
23.4% |
| (Standard Error) |
(1.1%) |
(Standard Error) |
(1.1%) |
(Standard Error) |
(1.1%) |
| Kansas |
20.0% |
North Carolina |
20.4% |
Wyoming |
20.4% |
| (Standard Error) |
(1.0%) |
(Standard Error) |
(0.9%) |
(Standard Error) |
(1.9%) |
|
Source: Medical Expenditure Panel Survey-Insurance Component, private-sector establishments, 2018.
Note: * Statistically different from the national average of 21.3 percent at p < 0.05. Note that the standard error on the national estimate of 21.3 percent is 0.22.
|
Return to Table of Contents
Exhibit 4.18 Average percentage (standard error) of premium contributed by employees for employee-plus-one coverage, by State, 2018
| Alabama |
28.7% |
Kentucky |
28.2% |
North Dakota |
27.3% |
| (Standard Error) |
(1.5%) |
(Standard Error) |
(2.1%) |
(Standard Error) |
(1.3%) |
| Alaska |
21.9%* |
Louisiana |
32.3%* |
Ohio |
25.6% |
| (Standard Error) |
(1.2%) |
(Standard Error) |
(1.9%) |
(Standard Error) |
(1.3%) |
| Arizona |
30.2% |
Maine |
28.8% |
Oklahoma |
28.8% |
| (Standard Error) |
(2.2%) |
(Standard Error) |
(1.2%) |
(Standard Error) |
(1.7%) |
| Arkansas |
32.4%* |
Maryland |
28.8% |
Oregon |
26.4% |
| (Standard Error) |
(1.7%) |
(Standard Error) |
(1.5%) |
(Standard Error) |
(1.6%) |
| California |
26.4% |
Massachusetts |
26.7% |
Pennsylvania |
24.6% |
| (Standard Error) |
(0.9%) |
(Standard Error) |
(1.8%) |
(Standard Error) |
(1.3%) |
| Colorado |
26.9% |
Michigan |
24.8% |
Rhode Island |
29.0% |
| (Standard Error) |
(1.5%) |
(Standard Error) |
(1.4%) |
(Standard Error) |
(1.2%) |
| Connecticut |
25.5% |
Minnesota |
28.3% |
South Carolina |
25.0% |
| (Standard Error) |
(1.3%) |
(Standard Error) |
(1.8%) |
(Standard Error) |
(1.2%) |
| Delaware |
28.5% |
Mississippi |
28.1% |
South Dakota |
27.6% |
| (Standard Error) |
(2.0%) |
(Standard Error) |
(1.6%) |
(Standard Error) |
(1.2%) |
| District of Columbia |
26.7% |
Missouri |
27.1% |
Tennessee |
33.1%* |
| (Standard Error) |
(1.5%) |
(Standard Error) |
(1.5%) |
(Standard Error) |
(1.7%) |
| Florida |
29.6% |
Montana |
24.6% |
Texas |
31.4%* |
| (Standard Error) |
(1.4%) |
(Standard Error) |
(2.2%) |
(Standard Error) |
(1.5%) |
| Georgia |
28.2% |
Nebraska |
27.3% |
Utah |
25.6% |
| (Standard Error) |
(1.4%) |
(Standard Error) |
(1.4%) |
(Standard Error) |
(1.3%) |
| Hawaii |
24.0% |
Nevada |
27.9% |
Vermont |
25.3% |
| (Standard Error) |
(4.1%) |
(Standard Error) |
(1.7%) |
(Standard Error) |
(1.4%) |
| Idaho |
26.0% |
New Hampshire |
27.4% |
Virginia |
31.0% |
| (Standard Error) |
(2.0%) |
(Standard Error) |
(1.9%) |
(Standard Error) |
(2.2%) |
| Illinois |
24.4%* |
New Jersey |
24.4% |
Washington |
20.4%* |
| (Standard Error) |
(1.3%) |
(Standard Error) |
(1.5%) |
(Standard Error) |
(1.7%) |
| Indiana |
24.8% |
New Mexico |
29.6% |
West Virginia |
23.4%* |
| (Standard Error) |
(1.7%) |
(Standard Error) |
(2.7%) |
(Standard Error) |
(1.8%) |
| Iowa |
28.3% |
New York |
23.5%* |
Wisconsin |
24.2%* |
| (Standard Error) |
(1.2%) |
(Standard Error) |
(1.3%) |
(Standard Error) |
(1.3%) |
| Kansas |
24.7%* |
North Carolina |
29.6% |
Wyoming |
24.1% |
| (Standard Error) |
(1.2%) |
(Standard Error) |
(1.4%) |
(Standard Error) |
(1.7%) |
|
Source: Medical Expenditure Panel Survey-Insurance Component, private-sector establishments, 2018.
Note: * Statistically different from the national average of 27.1 percent at p < 0.05. Note that the standard error on the national estimate of 27.1 percent is 0.29.
|
Return to Table of Contents
Exhibit 4.19 Average percentage (standard error) of premium contributed by employees for family coverage, by State, 2018
| Alabama |
29.3% |
Kentucky |
27.9% |
North Dakota |
28.7% |
| (Standard Error) |
(2.0%) |
(Standard Error) |
(2.2%) |
(Standard Error) |
(1.5%) |
| Alaska |
20.8%* |
Louisiana |
32.6%* |
Ohio |
25.5%* |
| (Standard Error) |
(1.4%) |
(Standard Error) |
(1.8%) |
(Standard Error) |
(1.0%) |
| Arizona |
30.7% |
Maine |
27.5% |
Oklahoma |
28.3% |
| (Standard Error) |
(2.3%) |
(Standard Error) |
(1.3%) |
(Standard Error) |
(1.6%) |
| Arkansas |
31.8% |
Maryland |
32.1%* |
Oregon |
31.2% |
| (Standard Error) |
(2.1%) |
(Standard Error) |
(1.8%) |
(Standard Error) |
(2.6%) |
| California |
27.5% |
Massachusetts |
26.1% |
Pennsylvania |
25.2% |
| (Standard Error) |
(1.3%) |
(Standard Error) |
(1.5%) |
(Standard Error) |
(1.3%) |
| Colorado |
27.1% |
Michigan |
23.5%* |
Rhode Island |
29.5% |
| (Standard Error) |
(1.4%) |
(Standard Error) |
(1.3%) |
(Standard Error) |
(1.5%) |
| Connecticut |
25.8% |
Minnesota |
32.0% |
South Carolina |
27.5% |
| (Standard Error) |
(1.2%) |
(Standard Error) |
(2.3%) |
(Standard Error) |
(2.1%) |
| Delaware |
28.4% |
Mississippi |
32.7%* |
South Dakota |
29.4% |
| (Standard Error) |
(1.7%) |
(Standard Error) |
(1.6%) |
(Standard Error) |
(1.2%) |
| District of Columbia |
29.1% |
Missouri |
26.0% |
Tennessee |
31.2%* |
| (Standard Error) |
(1.5%) |
(Standard Error) |
(1.5%) |
(Standard Error) |
(1.5%) |
| Florida |
31.2%* |
Montana |
26.6% |
Texas |
30.6%* |
| (Standard Error) |
(1.4%) |
(Standard Error) |
(3.4%) |
(Standard Error) |
(1.3%) |
| Georgia |
31.5%* |
Nebraska |
28.5% |
Utah |
25.4% |
| (Standard Error) |
(1.4%) |
(Standard Error) |
(2.3%) |
(Standard Error) |
(1.6%) |
| Hawaii |
30.6% |
Nevada |
34.1%* |
Vermont |
26.5% |
| (Standard Error) |
(2.4%) |
(Standard Error) |
(2.9%) |
(Standard Error) |
(1.7%) |
| Idaho |
29.6% |
New Hampshire |
27.0% |
Virginia |
33.8%* |
| (Standard Error) |
(2.0%) |
(Standard Error) |
(1.8%) |
(Standard Error) |
(1.6%) |
| Illinois |
26.4% |
New Jersey |
28.0% |
Washington |
20.6%* |
| (Standard Error) |
(2.1%) |
(Standard Error) |
(1.9%) |
(Standard Error) |
(2.4%) |
| Indiana |
23.3%* |
New Mexico |
26.4% |
West Virginia |
21.1%* |
| (Standard Error) |
(1.9%) |
(Standard Error) |
(1.5%) |
(Standard Error) |
(2.5%) |
| Iowa |
28.3% |
New York |
22.9%* |
Wisconsin |
25.3% |
| (Standard Error) |
(1.4%) |
(Standard Error) |
(1.7%) |
(Standard Error) |
(2.1%) |
| Kansas |
27.9% |
North Carolina |
32.7%* |
Wyoming |
26.9% |
| (Standard Error) |
(1.2%) |
(Standard Error) |
(1.8%) |
(Standard Error) |
(2.2%) |
|
Source: Medical Expenditure Panel Survey-Insurance Component, private-sector establishments, 2018.
Note: * Statistically different from the national average of 27.8 percent at p < 0.05. Note that the standard error on the national estimate of 27.8 percent is 0.32.
|
Return to Table of Contents
Exhibit 4.20 Average annual employee contribution (in dollars) (standard error) for single coverage, by State, 2018
| Alabama |
$1,453 |
Kentucky |
$1,633 |
North Dakota |
$1,246* |
| (Standard Error) |
($90) |
(Standard Error) |
($226) |
(Standard Error) |
($62) |
| Alaska |
$1,154* |
Louisiana |
$1,584* |
Ohio |
$1,632* |
| (Standard Error) |
($97) |
(Standard Error) |
($76) |
(Standard Error) |
($84) |
| Arizona |
$1,554 |
Maine |
$1,461 |
Oklahoma |
$1,293 |
| (Standard Error) |
($82) |
(Standard Error) |
($116) |
(Standard Error) |
($83) |
| Arkansas |
$1,375 |
Maryland |
$1,588 |
Oregon |
$1,061* |
| (Standard Error) |
($77) |
(Standard Error) |
($84) |
(Standard Error) |
($71) |
| California |
$1,202* |
Massachusetts |
$1,903* |
Pennsylvania |
$1,351 |
| (Standard Error) |
($44) |
(Standard Error) |
($95) |
(Standard Error) |
($71) |
| Colorado |
$1,289* |
Michigan |
$1,433 |
Rhode Island |
$1,807* |
| (Standard Error) |
($65) |
(Standard Error) |
($77) |
(Standard Error) |
($86) |
| Connecticut |
$1,672* |
Minnesota |
$1,575 |
South Carolina |
$1,427 |
| (Standard Error) |
($88) |
(Standard Error) |
($76) |
(Standard Error) |
($147) |
| Delaware |
$1,340 |
Mississippi |
$1,365 |
South Dakota |
$1,541 |
| (Standard Error) |
($64) |
(Standard Error) |
($80) |
(Standard Error) |
($61) |
| District of Columbia |
$1,369 |
Missouri |
$1,403 |
Tennessee |
$1,410 |
| (Standard Error) |
($69) |
(Standard Error) |
($77) |
(Standard Error) |
($79) |
| Florida |
$1,472 |
Montana |
$1,115* |
Texas |
$1,413 |
| (Standard Error) |
($60) |
(Standard Error) |
($88) |
(Standard Error) |
($63) |
| Georgia |
$1,476 |
Nebraska |
$1,388 |
Utah |
$1,183* |
| (Standard Error) |
($64) |
(Standard Error) |
($72) |
(Standard Error) |
($82) |
| Hawaii |
$755* |
Nevada |
$1,355 |
Vermont |
$1,456 |
| (Standard Error) |
($78) |
(Standard Error) |
($98) |
(Standard Error) |
($80) |
| Idaho |
$1,199* |
New Hampshire |
$1,618* |
Virginia |
$1,746* |
| (Standard Error) |
($98) |
(Standard Error) |
($93) |
(Standard Error) |
($119) |
| Illinois |
$1,548 |
New Jersey |
$1,598* |
Washington |
$955* |
| (Standard Error) |
($68) |
(Standard Error) |
($80) |
(Standard Error) |
($73) |
| Indiana |
$1,383 |
New Mexico |
$1,558 |
West Virginia |
$1,353 |
| (Standard Error) |
($64) |
(Standard Error) |
($180) |
(Standard Error) |
($81) |
| Iowa |
$1,592* |
New York |
$1,578 |
Wisconsin |
$1,596 |
| (Standard Error) |
($73) |
(Standard Error) |
($79) |
(Standard Error) |
($85) |
| Kansas |
$1,255* |
North Carolina |
$1,295* |
Wyoming |
$1,385 |
| (Standard Error) |
($59) |
(Standard Error) |
($53) |
(Standard Error) |
($125) |
|
Source: Medical Expenditure Panel Survey-Insurance Component, private-sector establishments, 2018.
Note: * Statistically different from the national average of $1,427 at p < 0.05. Note that the standard error on the national estimate of $1,427 is $14.45.
|
Return to Table of Contents
Exhibit 4.21 Average annual employee contribution (in dollars) (standard error) for employee-plus-one coverage, by State, 2018
| Alabama |
$3,530 |
Kentucky |
$3,703 |
North Dakota |
$3,379 |
| (Standard Error) |
($164) |
(Standard Error) |
($324) |
(Standard Error) |
($155) |
| Alaska |
$3,524 |
Louisiana |
$4,195* |
Ohio |
$3,525 |
| (Standard Error) |
($194) |
(Standard Error) |
($213) |
(Standard Error) |
($191) |
| Arizona |
$3,857 |
Maine |
$3,896 |
Oklahoma |
$3,764 |
| (Standard Error) |
($262) |
(Standard Error) |
($223) |
(Standard Error) |
($210) |
| Arkansas |
$3,840 |
Maryland |
$3,813 |
Oregon |
$3,364 |
| (Standard Error) |
($204) |
(Standard Error) |
($202) |
(Standard Error) |
($229) |
| California |
$3,498 |
Massachusetts |
$4,035 |
Pennsylvania |
$3,481 |
| (Standard Error) |
($128) |
(Standard Error) |
($217) |
(Standard Error) |
($191) |
| Colorado |
$3,390 |
Michigan |
$3,383 |
Rhode Island |
$4,066* |
| (Standard Error) |
($208) |
(Standard Error) |
($186) |
(Standard Error) |
($191) |
| Connecticut |
$3,486 |
Minnesota |
$3,832 |
South Carolina |
$3,222* |
| (Standard Error) |
($301) |
(Standard Error) |
($229) |
(Standard Error) |
($188) |
| Delaware |
$3,784 |
Mississippi |
$3,185 |
South Dakota |
$3,643 |
| (Standard Error) |
($246) |
(Standard Error) |
($274) |
(Standard Error) |
($177) |
| District of Columbia |
$4,002 |
Missouri |
$3,490 |
Tennessee |
$4,023* |
| (Standard Error) |
($219) |
(Standard Error) |
($195) |
(Standard Error) |
($183) |
| Florida |
$3,930 |
Montana |
$3,232 |
Texas |
$4,271* |
| (Standard Error) |
($187) |
(Standard Error) |
($266) |
(Standard Error) |
($204) |
| Georgia |
$3,724 |
Nebraska |
$3,596 |
Utah |
$3,196* |
| (Standard Error) |
($197) |
(Standard Error) |
($178) |
(Standard Error) |
($185) |
| Hawaii |
$3,068 |
Nevada |
$3,219* |
Vermont |
$3,507 |
| (Standard Error) |
($463) |
(Standard Error) |
($200) |
(Standard Error) |
($187) |
| Idaho |
$3,165* |
New Hampshire |
$4,066 |
Virginia |
$4,002 |
| (Standard Error) |
($213) |
(Standard Error) |
($280) |
(Standard Error) |
($244) |
| Illinois |
$3,302* |
New Jersey |
$3,615 |
Washington |
$2,558* |
| (Standard Error) |
($163) |
(Standard Error) |
($252) |
(Standard Error) |
($276) |
| Indiana |
$3,422 |
New Mexico |
$3,776 |
West Virginia |
$3,222 |
| (Standard Error) |
($226) |
(Standard Error) |
($413) |
(Standard Error) |
($245) |
| Iowa |
$3,688 |
New York |
$3,597 |
Wisconsin |
$3,468 |
| (Standard Error) |
($192) |
(Standard Error) |
($187) |
(Standard Error) |
($180) |
| Kansas |
$3,292* |
North Carolina |
$3,537 |
Wyoming |
$3,036* |
| (Standard Error) |
($152) |
(Standard Error) |
($175) |
(Standard Error) |
($248) |
|
Source: Medical Expenditure Panel Survey-Insurance Component, private-sector establishments, 2018.
Note: * Statistically different from the national average of $3,634 at p < 0.05. Note that the standard error on the national estimate of $3,634 is $39.15.
|
Return to Table of Contents
Exhibit 4.22 Average annual employee contribution (in dollars) (standard error) for family coverage, by State, 2018
| Alabama |
$5,278 |
Kentucky |
$5,382 |
North Dakota |
$4,982 |
| (Standard Error) |
($351) |
(Standard Error) |
($498) |
(Standard Error) |
($262) |
| Alaska |
$4,501* |
Louisiana |
$6,288* |
Ohio |
$5,016 |
| (Standard Error) |
($320) |
(Standard Error) |
($306) |
(Standard Error) |
($211) |
| Arizona |
$5,786 |
Maine |
$5,375 |
Oklahoma |
$5,306 |
| (Standard Error) |
($399) |
(Standard Error) |
($270) |
(Standard Error) |
($310) |
| Arkansas |
$5,728 |
Maryland |
$6,177* |
Oregon |
$5,913 |
| (Standard Error) |
($382) |
(Standard Error) |
($348) |
(Standard Error) |
($458) |
| California |
$5,376 |
Massachusetts |
$5,693 |
Pennsylvania |
$5,111 |
| (Standard Error) |
($246) |
(Standard Error) |
($236) |
(Standard Error) |
($303) |
| Colorado |
$4,963 |
Michigan |
$4,280* |
Rhode Island |
$5,493 |
| (Standard Error) |
($246) |
(Standard Error) |
($244) |
(Standard Error) |
($310) |
| Connecticut |
$5,352 |
Minnesota |
$6,190 |
South Carolina |
$5,301 |
| (Standard Error) |
($308) |
(Standard Error) |
($499) |
(Standard Error) |
($435) |
| Delaware |
$5,715 |
Mississippi |
$5,680 |
South Dakota |
$5,810 |
| (Standard Error) |
($322) |
(Standard Error) |
($349) |
(Standard Error) |
($245) |
| District of Columbia |
$6,358* |
Missouri |
$5,003 |
Tennessee |
$5,514 |
| (Standard Error) |
($309) |
(Standard Error) |
($296) |
(Standard Error) |
($249) |
| Florida |
$5,908 |
Montana |
$5,208 |
Texas |
$5,964 |
| (Standard Error) |
($289) |
(Standard Error) |
($514) |
(Standard Error) |
($276) |
| Georgia |
$5,846 |
Nebraska |
$5,414 |
Utah |
$4,594* |
| (Standard Error) |
($250) |
(Standard Error) |
($417) |
(Standard Error) |
($306) |
| Hawaii |
$5,475 |
Nevada |
$6,252 |
Vermont |
$5,334 |
| (Standard Error) |
($455) |
(Standard Error) |
($551) |
(Standard Error) |
($337) |
| Idaho |
$5,211 |
New Hampshire |
$5,535 |
Virginia |
$6,597* |
| (Standard Error) |
($382) |
(Standard Error) |
($372) |
(Standard Error) |
($340) |
| Illinois |
$5,378 |
New Jersey |
$6,253 |
Washington |
$3,862* |
| (Standard Error) |
($450) |
(Standard Error) |
($422) |
(Standard Error) |
($469) |
| Indiana |
$4,551* |
New Mexico |
$4,723 |
West Virginia |
$4,371* |
| (Standard Error) |
($320) |
(Standard Error) |
($372) |
(Standard Error) |
($464) |
| Iowa |
$5,143 |
New York |
$5,006 |
Wisconsin |
$4,952 |
| (Standard Error) |
($247) |
(Standard Error) |
($320) |
(Standard Error) |
($422) |
| Kansas |
$5,248 |
North Carolina |
$5,948 |
Wyoming |
$5,205 |
| (Standard Error) |
($227) |
(Standard Error) |
($309) |
(Standard Error) |
($359) |
|
Source: Medical Expenditure Panel Survey-Insurance Component, private-sector establishments, 2018.
Note: * Statistically different from the national average of $5,431 at p < 0.05. Note that the standard error on the national estimate of $5,431 is $63.16.
|
Return to Table of Contents
Exhibit 4.23 Average percentage (standard error) of premium contributed by employees for single coverage, overall and by industry, 2018
| Industry |
Percentage |
| United States |
21.3% |
| (Standard Error) |
(0.2%) |
| Agriculture, fisheries, forestry |
17.2% |
| (Standard Error) |
(3.6%) |
| Mining and manufacturing |
21.4% |
| (Standard Error) |
(0.5%) |
| Construction |
22.2% |
| (Standard Error) |
(1.1%) |
| Utilities and transportation |
20.3% |
| (Standard Error) |
(0.9%) |
| Wholesale trade |
20.3% |
| (Standard Error) |
(0.8%) |
| Financial services and real estate |
19.3% |
| (Standard Error) |
(0.6%) |
| Retail trade |
23.4% |
| (Standard Error) |
(0.7%) |
| Professional services |
19.5% |
| (Standard Error) |
(0.3%) |
| Other services |
25.6% |
| (Standard Error) |
(0.7%) |
|
Source: Medical Expenditure Panel Survey-Insurance Component, private-sector establishments, 2018.
|
Return to Table of Contents
Exhibit 4.24 Average percentage (standard error) of premium contributed by employees for employee-plus-one coverage, overall and by industry, 2018
| Industry |
Percentage |
| United States |
27.1% |
| (Standard Error) |
(0.3%) |
| Agriculture, fisheries, forestry |
26.7% |
| (Standard Error) |
(3.3%) |
| Mining and manufacturing |
24.4% |
| (Standard Error) |
(0.6%) |
| Construction |
31.9% |
| (Standard Error) |
(1.5%) |
| Utilities and transportation |
24.2% |
| (Standard Error) |
(1.0%) |
| Wholesale trade |
26.8% |
| (Standard Error) |
(0.9%) |
| Financial services and real estate |
26.0% |
| (Standard Error) |
(0.8%) |
| Retail trade |
27.9% |
| (Standard Error) |
(1.1%) |
| Professional services |
26.1% |
| (Standard Error) |
(0.5%) |
| Other services |
33.8% |
| (Standard Error) |
(0.9%) |
|
Source: Medical Expenditure Panel Survey-Insurance Component, private-sector establishments, 2018.
|
Return to Table of Contents
Exhibit 4.25 Average percentage (standard error) of premium contributed by employees for family coverage, overall and by industry, 2018
| Industry |
Percentage |
| United States |
27.8% |
| (Standard Error) |
(0.3%) |
| Agriculture, fisheries, forestry |
36.6% |
| (Standard Error) |
(8.5%) |
| Mining and manufacturing |
24.3% |
| (Standard Error) |
(0.7%) |
| Construction |
27.7% |
| (Standard Error) |
(1.9%) |
| Utilities and transportation |
23.7% |
| (Standard Error) |
(1.3%) |
| Wholesale trade |
26.9% |
| (Standard Error) |
(1.1%) |
| Financial services and real estate |
27.4% |
| (Standard Error) |
(0.8%) |
| Retail trade |
31.7% |
| (Standard Error) |
(1.3%) |
| Professional services |
27.6% |
| (Standard Error) |
(0.5%) |
| Other services |
33.9% |
| (Standard Error) |
(1.0%) |
|
Source: Medical Expenditure Panel Survey-Insurance Component, private-sector establishments, 2018.
|
Return to Table of Contents
Exhibit 4.26 Average percentage (standard error) of premium contributed by employees for single coverage, overall and by selected characteristics, 2018
| Employer Characteristics |
Percentage |
| United States |
21.3% |
| (Standard Error) |
(0.2%) |
| Ownership: For Profit Inc. |
21.9% |
| (Standard Error) |
(0.3%) |
| Ownership: For Profit Uninc. |
23.8% |
| (Standard Error) |
(0.6%) |
| Ownership: Nonprofit |
17.2% |
| (Standard Error) |
(0.5%) |
| Firm Age: 0-4 Years |
24.4% |
| (Standard Error) |
(1.6%) |
| Firm Age: 5-9 Years |
23.7% |
| (Standard Error) |
(1.4%) |
| Firm Age: 10-19 Years |
23.7% |
| (Standard Error) |
(0.7%) |
| Firm Age: 20+ Years |
20.7% |
| (Standard Error) |
(0.2%) |
| # of Locations: 2+ Locations |
21.1% |
| (Standard Error) |
(0.2%) |
| # of Locations: 1 Location |
21.6% |
| (Standard Error) |
(0.4%) |
| % Full Time: 0-24% |
26.3% |
| (Standard Error) |
(1.0%) |
| % Full Time: 25-49% |
23.0% |
| (Standard Error) |
(0.8%) |
| % Full Time: 50-74% |
22.6% |
| (Standard Error) |
(0.7%) |
| % Full Time: 75%+ |
20.9% |
| (Standard Error) |
(0.2%) |
| % Low Wage: 50%+ |
25.4% |
| (Standard Error) |
(0.8%) |
| % Low Wage: <50% |
20.7% |
| (Standard Error) |
(0.2%) |
|
Source: Medical Expenditure Panel Survey-Insurance Component, private-sector establishments, 2018.
Note: "% Full Time" refers to the percentage of the establishment's workforce that worked full time in 2018. "% Low Wage" refers to the percentage of the establishment's workforce that earned less than $12.00 per hour in 2018.
|
Return to Table of Contents
Exhibit 4.27 Average percentage (standard error) of premium contributed by employees for employee-plus-one coverage, overall and by selected characteristics, 2018
| Employer Characteristics |
Percentage |
| United States |
27.1% |
| (Standard Error) |
(0.3%) |
| Ownership: For Profit Inc. |
27.3% |
| (Standard Error) |
(0.3%) |
| Ownership: For Profit Uninc. |
30.2% |
| (Standard Error) |
(0.8%) |
| Ownership: Nonprofit |
24.3% |
| (Standard Error) |
(0.8%) |
| Firm Age: 0-4 Years |
32.6% |
| (Standard Error) |
(2.0%) |
| Firm Age: 5-9 Years |
34.4% |
| (Standard Error) |
(1.8%) |
| Firm Age: 10-19 Years |
32.1% |
| (Standard Error) |
(1.1%) |
| Firm Age: 20+ Years |
26.1% |
| (Standard Error) |
(0.3%) |
| # of Locations: 2+ Locations |
25.6% |
| (Standard Error) |
(0.3%) |
| # of Locations: 1 Location |
32.2% |
| (Standard Error) |
(0.6%) |
| % Full Time: 0-24% |
30.1% |
| (Standard Error) |
(1.8%) |
| % Full Time: 25-49% |
29.1% |
| (Standard Error) |
(1.4%) |
| % Full Time: 50-74% |
26.4% |
| (Standard Error) |
(1.1%) |
| % Full Time: 75%+ |
27.0% |
| (Standard Error) |
(0.3%) |
| % Low Wage: 50%+ |
30.5% |
| (Standard Error) |
(1.3%) |
| % Low Wage: <50% |
26.8% |
| (Standard Error) |
(0.3%) |
|
Source: Medical Expenditure Panel Survey-Insurance Component, private-sector establishments, 2018.
Note: "% Full Time" refers to the percentage of the establishment's workforce that worked full time in 2018. "% Low Wage" refers to the percentage of the establishment's workforce that earned less than $12.00 per hour in 2018.
|
Return to Table of Contents
Exhibit 4.28 Average percentage (standard error) of premium contributed by employees for family coverage, overall and by selected characteristics, 2018
| Employer Characteristics |
Percentage |
| United States |
27.8% |
| (Standard Error) |
(0.3%) |
| Ownership: For Profit Inc. |
28.1% |
| (Standard Error) |
(0.4%) |
| Ownership: For Profit Uninc. |
30.8% |
| (Standard Error) |
(1.0%) |
| Ownership: Nonprofit |
24.7% |
| (Standard Error) |
(0.7%) |
| Firm Age: 0-4 Years |
35.3% |
| (Standard Error) |
(2.0%) |
| Firm Age: 5-9 Years |
37.2% |
| (Standard Error) |
(2.7%) |
| Firm Age: 10-19 Years |
33.8% |
| (Standard Error) |
(1.2%) |
| Firm Age: 20+ Years |
26.6% |
| (Standard Error) |
(0.3%) |
| # of Locations: 2+ Locations |
26.3% |
| (Standard Error) |
(0.3%) |
| # of Locations: 1 Location |
32.6% |
| (Standard Error) |
(0.9%) |
| % Full Time: 0-24% |
34.9% |
| (Standard Error) |
(2.1%) |
| % Full Time: 25-49% |
29.8% |
| (Standard Error) |
(1.5%) |
| % Full Time: 50-74% |
29.0% |
| (Standard Error) |
(1.0%) |
| % Full Time: 75%+ |
27.5% |
| (Standard Error) |
(0.4%) |
| % Low Wage: 50%+ |
35.8% |
| (Standard Error) |
(1.5%) |
| % Low Wage: <50% |
27.2% |
| (Standard Error) |
(0.3%) |
|
Source: Medical Expenditure Panel Survey-Insurance Component, private-sector establishments, 2018.
Note: "% Full Time" refers to the percentage of the establishment's workforce that worked full time in 2018. "% Low Wage" refers to the percentage of the establishment's workforce that earned less than $12.00 per hour in 2018.
|
Return to Table of Contents
Exhibit 4.29 Average percentage (standard error) of premium contributed by enrolled employees for single coverage, by the percentage of the establishment's workforce that is low wage, 2005‑2018
| Low wage |
2005 |
2006 |
2008 |
2009 |
2010 |
2011 |
2012 |
2013 |
2014 |
2015 |
2016 |
2017 |
2018 |
| 50%+ Low-Wage Employees |
22.5% |
22.6% |
24.0% |
24.1% |
24.6% |
24.7% |
24.4% |
25.7% |
25.4% |
26.2% |
26.2% |
26.9% |
25.4% |
| (Standard Error) |
(1.0%) |
(0.5%) |
(0.5%) |
(0.3%) |
(0.5%) |
(0.8%) |
(0.4%) |
(0.6%) |
(0.5%) |
(0.8%) |
(0.5%) |
(0.6%) |
(0.8%) |
| <50% Low-Wage Employees |
17.3% |
18.4% |
19.3% |
19.8% |
19.9% |
20.2% |
20.1% |
20.1% |
20.4% |
20.4% |
21.1% |
21.6% |
20.7% |
| (Standard Error) |
(0.3%) |
(0.4%) |
(0.1%) |
(0.3%) |
(0.3%) |
(0.1%) |
(0.3%) |
(0.2%) |
(0.2%) |
(0.2%) |
(0.2%) |
(0.3%) |
(0.2%) |
|
Source: Medical Expenditure Panel Survey-Insurance Component, private-sector establishments, 2005‑2018.
Note: Medical Expenditure Panel Survey-Insurance Component estimates are not available for 2007. Wage levels in the MEPS-IC questionnaires have been adjusted to account for changing wages over time. In 2018, low-wage employees were defined as those earning less than $12.00 per hour.
|
Return to Table of Contents
Exhibit 4.30 Average total employee contribution (in dollars) (standard error) per enrolled employee for single coverage, by the percentage of the establishment's workforce that is low wage, 2005‑2018
| Low wage |
2005 |
2006 |
2008 |
2009 |
2010 |
2011 |
2012 |
2013 |
2014 |
2015 |
2016 |
2017 |
2018 |
| 50%+ Low-Wage Employees |
$840 |
$866 |
$1,004 |
$1,018 |
$1,132 |
$1,188 |
$1,213 |
$1,321 |
$1,420 |
$1,444 |
$1,450 |
$1,605 |
$1,583 |
| (Standard Error) |
($49) |
($18) |
($27) |
($13) |
($22) |
($35) |
($21) |
($37) |
($28) |
($49) |
($31) |
($42) |
($47) |
| <50% Low-Wage Employees |
$699 |
$771 |
$855 |
$943 |
$997 |
$1,070 |
$1,098 |
$1,140 |
$1,199 |
$1,228 |
$1,307 |
$1,386 |
$1,405 |
| (Standard Error) |
($12) |
($19) |
($4) |
($14) |
($16) |
($7) |
($18) |
($15) |
($14) |
($15) |
($14) |
($16) |
($15) |
|
Source: Medical Expenditure Panel Survey-Insurance Component, private-sector establishments, 2005‑2018.
Note: Medical Expenditure Panel Survey-Insurance Component estimates are not available for 2007. Wage levels in the MEPS-IC questionnaires have been adjusted to account for changing wages over time. In 2018, low-wage employees were defined as those earning less than $12.00 per hour.
|
Return to Table of Contents
Exhibit 4.31 Average percentage (standard error) of premium contributed by enrolled employees for employee-plus-one coverage, by the percentage of the establishment's workforce that is low wage, 2005‑2018
| Low wage |
2005 |
2006 |
2008 |
2009 |
2010 |
2011 |
2012 |
2013 |
2014 |
2015 |
2016 |
2017 |
2018 |
| 50%+ Low-Wage Employees |
27.7% |
27.1% |
30.9% |
28.6% |
30.9% |
33.3% |
30.9% |
32.4% |
32.1% |
33.8% |
34.4% |
34.2% |
30.5% |
| (Standard Error) |
(0.7%) |
(1.1%) |
(0.6%) |
(0.8%) |
(0.6%) |
(0.7%) |
(0.8%) |
(0.6%) |
(1.2%) |
(1.0%) |
(1.0%) |
(1.1%) |
(1.3%) |
| <50% Low-Wage Employees |
22.3% |
23.3% |
26.3% |
25.7% |
25.1% |
25.7% |
26.0% |
26.0% |
26.3% |
26.7% |
27.3% |
27.1% |
26.8% |
| (Standard Error) |
(0.4%) |
(0.4%) |
(0.3%) |
(0.3%) |
(0.4%) |
(0.3%) |
(0.4%) |
(0.2%) |
(0.4%) |
(0.3%) |
(0.3%) |
(0.3%) |
(0.3%) |
|
Source: Medical Expenditure Panel Survey-Insurance Component, private-sector establishments, 2005‑2018.
Note: Medical Expenditure Panel Survey-Insurance Component estimates are not available for 2007. Wage levels in the MEPS-IC questionnaires have been adjusted to account for changing wages over time. In 2018, low-wage employees were defined as those earning less than $12.00 per hour.
|
Return to Table of Contents
Exhibit 4.32 Average total employee contribution (in dollars) (standard error) per enrolled employee for employee-plus-one coverage, by the percentage of the establishment's workforce that is low wage, 2005‑2018
| Low wage |
2005 |
2006 |
2008 |
2009 |
2010 |
2011 |
2012 |
2013 |
2014 |
2015 |
2016 |
2017 |
2018 |
| 50%+ Low-Wage Employees |
$2,063 |
$1,949 |
$2,552 |
$2,323 |
$2,753 |
$3,115 |
$3,065 |
$3,246 |
$3,598 |
$3,819 |
$3,849 |
$4,030 |
$3,780 |
| (Standard Error) |
($48) |
($95) |
($76) |
($56) |
($70) |
($75) |
($81) |
($71) |
($172) |
($113) |
($110) |
($136) |
($151) |
| <50% Low-Wage Employees |
$1,717 |
$1,895 |
$2,260 |
$2,369 |
$2,459 |
$2,687 |
$2,791 |
$2,897 |
$3,032 |
$3,167 |
$3,335 |
$3,489 |
$3,621 |
| (Standard Error) |
($30) |
($25) |
($22) |
($31) |
($52) |
($36) |
($50) |
($26) |
($40) |
($36) |
($38) |
($40) |
($41) |
|
Source: Medical Expenditure Panel Survey-Insurance Component, private-sector establishments, 2005‑2018.
Note: Medical Expenditure Panel Survey-Insurance Component estimates are not available for 2007. Wage levels in the MEPS-IC questionnaires have been adjusted to account for changing wages over time. In 2018, low-wage employees were defined as those earning less than $12.00 per hour.
|
Return to Table of Contents
Exhibit 4.33 Average percentage (standard error) of premium contributed by enrolled employees for family coverage, by the percentage of the establishment's workforce that is low wage, 2005‑2018
| Low wage |
2005 |
2006 |
2008 |
2009 |
2010 |
2011 |
2012 |
2013 |
2014 |
2015 |
2016 |
2017 |
2018 |
| 50%+ Low-Wage Employees |
30.6% |
29.7% |
32.0% |
30.2% |
31.6% |
31.0% |
33.4% |
31.7% |
33.1% |
34.4% |
35.8% |
35.7% |
35.8% |
| (Standard Error) |
(1.0%) |
(0.8%) |
(0.9%) |
(1.0%) |
(0.7%) |
(0.7%) |
(0.6%) |
(0.8%) |
(0.7%) |
(0.9%) |
(0.9%) |
(1.0%) |
(1.5%) |
| <50% Low-Wage Employees |
23.4% |
24.8% |
27.0% |
26.2% |
26.3% |
25.9% |
26.7% |
27.1% |
26.5% |
26.7% |
27.5% |
27.4% |
27.2% |
| (Standard Error) |
(0.4%) |
(0.3%) |
(0.4%) |
(0.3%) |
(0.5%) |
(0.4%) |
(0.4%) |
(0.3%) |
(0.3%) |
(0.3%) |
(0.3%) |
(0.4%) |
(0.3%) |
|
Source: Medical Expenditure Panel Survey-Insurance Component, private-sector establishments, 2005‑2018.
Note: Medical Expenditure Panel Survey-Insurance Component estimates are not available for 2007. Wage levels in the MEPS-IC questionnaires have been adjusted to account for changing wages over time. In 2018, low-wage employees were defined as those earning less than $12.00 per hour.
|
Return to Table of Contents
Exhibit 4.34 Average total employee contribution (in dollars) (standard error) per enrolled employee for family coverage, by the percentage of the establishment's workforce that is low wage, 2005‑2018
| Low wage |
2005 |
2006 |
2008 |
2009 |
2010 |
2011 |
2012 |
2013 |
2014 |
2015 |
2016 |
2017 |
2018 |
| 50%+ Low-Wage Employees |
$3,049 |
$3,089 |
$3,764 |
$3,564 |
$4,014 |
$4,236 |
$4,735 |
$4,733 |
$5,276 |
$5,354 |
$5,978 |
$6,048 |
$6,441 |
| (Standard Error) |
($118) |
($103) |
($140) |
($121) |
($83) |
($108) |
($85) |
($106) |
($129) |
($171) |
($163) |
($178) |
($302) |
| <50% Low-Wage Employees |
$2,530 |
$2,861 |
$3,343 |
$3,461 |
$3,684 |
$3,928 |
$4,170 |
$4,384 |
$4,435 |
$4,658 |
$4,882 |
$5,156 |
$5,360 |
| (Standard Error) |
($45) |
($40) |
($45) |
($42) |
($65) |
($51) |
($86) |
($63) |
($52) |
($59) |
($59) |
($68) |
($64) |
|
Source: Medical Expenditure Panel Survey-Insurance Component, private-sector establishments, 2005‑2018.
Note: Medical Expenditure Panel Survey-Insurance Component estimates are not available for 2007. Wage levels in the MEPS-IC questionnaires have been adjusted to account for changing wages over time. In 2018, low-wage employees were defined as those earning less than $12.00 per hour.
|
Return to Table of Contents
Exhibit 4.35 Distributions of employee contribution (in dollars) (standard error) for single, employee-plus-one, and family coverage, overall and by firm size, 2018
| Coverage |
Estimate |
Total |
<50 employees |
50-99 employees |
100 or more employees |
| Single |
Average (mean) |
$1,427 |
$1,351 |
$1,534 |
$1,433 |
| (Standard Error) |
($14) |
($39) |
($51) |
($16) |
| 10 percentile |
$0 |
$0 |
$0 |
$300 |
| (Standard Error) |
($43) |
($79) |
($83) |
($27) |
| 25 percentile |
$640 |
$0 |
$520 |
$740 |
| (Standard Error) |
($18) |
($79) |
($61) |
($12) |
| 50 percentile (median) |
$1,200 |
$860 |
$1,400 |
$1,300 |
| (Standard Error) |
($18) |
($61) |
($48) |
($18) |
| 75 percentile |
$1,900 |
$2,200 |
$2,200 |
$1,800 |
| (Standard Error) |
($20) |
($65) |
($68) |
($19) |
| 90 percentile |
$2,800 |
$3,500 |
$3,100 |
$2,600 |
| (Standard Error) |
($33) |
($88) |
($94) |
($33) |
| Employee-plus-one |
Average (mean) |
$3,634 |
$4,017 |
$4,732 |
$3,504 |
| (Standard Error) |
($39) |
($120) |
($161) |
($43) |
| 10 percentile |
$780 |
$0 |
$610✝ |
$1,000 |
| (Standard Error) |
($82) |
($241) |
($337) |
($40) |
| 25 percentile |
$2,000 |
$0 |
$2,700 |
$2,100 |
| (Standard Error) |
($53) |
($241) |
($179) |
($49) |
| 50 percentile (median) |
$3,200 |
$3,400 |
$4,400 |
$3,100 |
| (Standard Error) |
($34) |
($130) |
($130) |
($40) |
| 75 percentile |
$4,700 |
$6,200 |
$6,500 |
$4,400 |
| (Standard Error) |
($51) |
($138) |
($248) |
($51) |
| 90 percentile |
$6,900 |
$9,100 |
$8,400 |
$6,400 |
| (Standard Error) |
($101) |
($234) |
($257) |
($127) |
| Family |
Average (mean) |
$5,431 |
$5,854 |
$6,973 |
$5,277 |
| (Standard Error) |
($63) |
($188) |
($336) |
($68) |
| 10 percentile |
$1,000 |
$0 |
$0 |
$1,600 |
| (Standard Error) |
($135) |
($369) |
($226) |
($112) |
| 25 percentile |
$2,900 |
$0 |
$3,200 |
$3,100 |
| (Standard Error) |
($70) |
($369) |
($525) |
($67) |
| 50 percentile (median) |
$4,700 |
$4,700 |
$6,000 |
$4,700 |
| (Standard Error) |
($49) |
($246) |
($386) |
($49) |
| 75 percentile |
$6,900 |
$9,600 |
$10,000 |
$6,500 |
| (Standard Error) |
($112) |
($265) |
($487) |
($106) |
| 90 percentile |
$10,000 |
$14,000 |
$14,000 |
$9,400 |
| (Standard Error) |
($199) |
($320) |
($667) |
($207) |
|
✝ Estimate does not meet standard of reliability or precision.
Source: Medical Expenditure Panel Survey-Insurance Component, private-sector establishments, 2018.
|
Return to Table of Contents
As healthcare costs in the United States have increased faster than the costs of other goods and services, employers have responded by increasing cost-sharing provisions such as deductibles, coinsurance rates, and copayments and by raising maximum out-of-pocket limits. A deductible is the amount an enrollee must pay before healthcare services are covered by the health plan. Coinsurance rates are the percentages of healthcare service expenses paid by the enrollee, and copayments are fixed dollar amounts paid by the enrollee for each healthcare service. The maximum out-of-pocket limit is the maximum amount the enrollee would pay for covered services in a given year.
High-deductible health plans, as defined in this chartbook, are plans with deductibles at or above annual thresholds set by the Internal Revenue Service for plans to qualify for Health Savings Accounts. In 2018, the thresholds were $1,350 for single coverage and $2,700 for family coverage.
Cost-sharing provisions may vary for different types of healthcare services. The deductibles reported in this section are general annual deductibles that must be met before many services are covered by the health plan. The reported coinsurance rates and copayments are cost-sharing measures for physician office visits to general practitioners.
When plans differentiate between in-network and out-of-network providers, the deductibles, coinsurance rates, and copayments reported in this section are for in-network providers. Reported maximum out-of-pocket payments refer to enrollee payments for all covered health services.
While large changes in the cost sharing provisions of employer-sponsored health plans occurred over the entire period from 2005 to 2018, few changes occurred from 2017 to 2018. For example, while the percentage of single-coverage enrollees in high-deductible plans rose from 16.8 percent in 2005 to 53.6 percent in 2018, there was no significant change in this percentage from 2017 to 2018. There was also no significant change in average individual deductible levels among single-coverage enrollees in a plan with a deductible from 2017 to 2018, making 2018 the first year without a significant increase in the 2005 to 2018 period.
This section presents information on trends from 2005 to 2018, overall and by firm size, in:
- The percentage of enrolled employees in plans with a deductible,
- The percentages of enrolled employees in plans that have coinsurance rates and copayments for physician office visits,
- The average deductibles, coinsurance rates, and copayments among enrolled employees in plans with these cost-sharing provisions,
- The percentage of single and family enrollees in plans with a maximum-out-of-pocket-limit and the average maximum-out of pocket limit in such plans,
- The percentage of single and family enrollees in high-deductible health plans, and
- The percentage of single and family enrollees in non-high-deductible health plans by plan type (exclusive providers, mixed providers with and without a gatekeeper, and any providers).
Finally, this section presents information on cost-sharing provisions by State for 2018.
Individual and Family Deductibles
- There was no significant change in the percentage of enrolled employees in a health insurance plan with a deductible from 2017 (87.5 percent) to 2018 (87.3 percent) (Exhibit 5.1).
- From 2005 to 2018, the percentage of enrollees in plans with deductibles increased from 63.9 percent to 87.3 percent (Exhibit 5.1).
- Among single-coverage enrollees with a deductible, average deductible levels did not increase significantly in 2018. This was the first year without a significant increase in the 2005 to 2018 period. However, the average deductible level did rise significantly for single-coverage enrollees in small firms, increasing from $2,136 in 2017 to $2,327 in 2018. The year 2018 was also the first time that average family deductibles did not rise significantly for family-coverage enrollees (Exhibits 5.2 and 5.3).
- Between 2005 and 2018, average individual deductibles rose from $652 to $1,846, and average family deductibles rose from $1,232 to $3,392 (Exhibits 5.2 and 5.3).
Differences by Firm Size
- In 2018, enrolled employees in large firms (100 or more employees) were more likely to be in a plan with a deductible than those in small (fewer than 50 employees) and medium (50 to 99 employees) firms (88.3 percent vs. 83.0 percent and 85.1 percent, respectively) (Exhibit 5.1).
- Among enrollees with deductibles, average individual deductibles in 2018 were higher in small ($2,327) and medium ($2,369) firms than in large firms ($1,692) (Exhibit 5.2).
- Family deductibles in 2018 were higher in medium firms ($4,755) than in small firms ($4,364) and both were higher than in large firms ($3,179) (Exhibit 5.3).
Deductibles by State
- In 2018, 87.3 percent of enrolled employees were in plans with a deductible. This figure was lower in four States: California, District of Columbia, Hawaii, and New York. It was not significantly different from the national average in 14 States: Alabama, Connecticut, Delaware, Illinois, Maryland, Massachusetts, Missouri, Nevada, New Jersey, North Carolina, Ohio, Rhode Island, Virginia, and West Virginia. In the remaining States, the percentage of enrolled employees in a plan with a deductible was higher than the national average (Exhibit 5.4).
- Among enrolled employees in plans with individual deductibles, the average deductible was $1,846 in 2018. Eleven states had individual deductibles that were higher than the national average: Arizona, Connecticut, Iowa, Maine, Minnesota, Montana, New Hampshire, North Carolina, South Dakota, Tennessee, and Vermont. Ten States had individual deductibles that were lower than the national average: Alabama, Arkansas, California, District of Columbia, Louisiana, Maryland, Massachusetts, New York, Oklahoma, and Utah (Exhibit 5.5).
- Among enrolled employees in plans with family deductibles, the average deductible was $3,392 in 2018. Seven States had family deductibles that were higher than the national average: Colorado, Maine, Minnesota, New Hampshire, Ohio, South Dakota, and Wyoming. Six States had family deductibles that were lower than the national average: Alabama, District of Columbia, Maryland, Massachusetts, New York, and Pennsylvania (Exhibit 5.6).
Coinsurance Rates for Physician Office Visits
- The percentage of enrolled employees in a health insurance plan with a physician office visit coinsurance rate did not change significantly from 2017 (37.6 percent) to 2018 (37.7 percent) (Exhibit 5.7).
- From 2005 to 2018, the percentage of enrolled employees in a plan with a physician visit coinsurance rate increased from 18.3 percent to 37.7 percent (Exhibit 5.7).
- Among enrolled employees in a plan with a physician office visit coinsurance rate, there was no significant change in average coinsurance rates for physician office visits between 2017 (20.1 percent) and 2018 (20.2 percent) (Exhibit 5.8).
- Average coinsurance rates increased from 18.3 percent in 2005 to 20.2 percent in 2018 (Exhibit 5.8).
Differences by Firm Size
- Enrolled employees in large firms (100 or more employees) were more likely to have plans with a physician office visit coinsurance rate than those in small (fewer than 50 employees) and medium (50 to 99 employees) firms in all years from 2005 to 2018. In 2018, 42.0 percent of enrollees in large firms had a physician office visit coinsurance rate compared with 22.4 percent and 21.3 percent in small and medium firms, respectively (Exhibit 5.7).
- Between 2005 and 2018, the percentage of enrolled employees in health plans with a physician visit coinsurance rate increased for all enrollees, regardless of firm size. However, the increase was larger among enrolled employees in large firms (22.5 percentage points) than in small and medium firms (8.4 percentage points and 4.5 percentage points, respectively) (Exhibit 5.7).
- Throughout the 2005 to 2018 period, average physician visit coinsurance rates for enrolled employees in large firms were lower than rates in small firms. They were also lower in large firms than in medium firms in every year from 2011 to 2018. In 2018, average physician visit coinsurance rates were 19.8 percent in large firms vs. 23.0 percent and 21.6 percent in small and medium firms, respectively (Exhibit 5.8).
Physician Visit Coinsurance Rates by State
- In 2018, 37.7 percent of enrolled employees in the United States had plans with a physician visit coinsurance rate. This percentage was lower in eight States: Alabama, California, District of Columbia, Hawaii, Indiana, Massachusetts, Pennsylvania, and Rhode Island. This percentage was higher than the national average in 11 States: Alaska, Colorado, Maine, Minnesota, Montana, North Dakota, Ohio, Tennessee, Washington, Wisconsin, and Wyoming (Exhibit 5.9).
- Among enrolled employees in plans with a physician visit coinsurance rate, the average coinsurance rate was 20.2 percent in 2018. The rate was lower in eight States: Delaware, District of Columbia, Hawaii, Illinois, Massachusetts, New Hampshire, North Dakota, and Rhode Island. The rate was higher in seven States: Alabama, Idaho, Mississippi, Montana, South Carolina, Tennessee, and Wyoming (Exhibit 5.10).
Copayments for Physician Office Visits
- There was no statistically significant change in the overall percentage of enrollees in a health insurance plan with a copayment for physician office visits from 2017 (59.2 percent) to 2018 (58.1 percent) (Exhibit 5.11).
- From 2005 to 2018, the percentage of enrollees with a copayment fell by 18.3 percentage points, from 76.4 percent in 2005 to 58.1 percent in 2018 (Exhibit 5.11).
- For enrolled employees in plans with a copayment for a physician office visit, there was no significant change in average copayments between 2017 ($26.50) and 2018 ($26.81) (Exhibit 5.12).
- From 2005 to 2018, average copayments increased from $18.76 to $26.81 (Exhibit 5.12).
Differences by Firm Size
- In 2018 and in almost all years from 2005 to 2017, the percentage of enrolled employees in plans with a copayment for a physician office visit was lower in large firms (100 or more employees) than in small (fewer than 50 employees) or medium (50 to 99 employees) firms (Exhibit 5.11).
- Between 2005 and 2018, the percentage of enrolled employees in health plans with a copayment for a physician office visit decreased for all enrollees, regardless of firm size. However, the decrease was more pronounced among enrolled employees in large firms (20.3 percentage points) than in small and medium firms (10.9 percentage points and 9.2 percentage points, respectively) (Exhibit 5.11).
- Throughout the 2005 to 2018 period, average copayments for enrolled employees in large firms were lower than in small and medium firms. In 2018, the average copayment for a physician office visit was $26.11 in large firms vs. $29.16 and $28.37 in small and medium firms, respectively (Exhibit 5.12).
Copayments for Physician Office Visits by State
- In 2018, 58.1 percent of enrolled employees in the United States had plans with a copayment for a physician office visit. This figure was lower in 12 States: Alaska, Colorado, Iowa, Maine, Minnesota, Montana, North Dakota, Ohio, Tennessee, Vermont, Wisconsin, and Wyoming. It was higher in six States: Alabama, California, District of Columbia, Hawaii, Massachusetts, and Mississippi (Exhibit 5.13).
- Among plans with a copayment for a physician office visit, the average copayment was $26.81 in 2018. This figure was lower in 12 States: California, District of Columbia, Hawaii, Maryland, Massachusetts, Nevada, New Mexico, North Dakota, Oregon, Pennsylvania, Rhode Island, and Vermont. It was higher in 12 States: Alabama, Arizona, Colorado, Connecticut, Idaho, Louisiana, Missouri, Nebraska, Oklahoma, South Dakota, Tennessee, and Texas (Exhibit 5.14).
Copayments for Specialist Physician Visits
- From 2017 to 2018, there was no significant change in the overall percentage of enrollees in a health insurance plan with a copayment for a specialist physician visit, but the 2018 rate (58.0 percent) was lower than in 2016 (60.8 percent) (Exhibit 5.15).
- For enrolled employees in plans with a copayment for a specialist physician visit, the average copayment increased from $40.29 in 2016 to $41.97 in 2017 and then to $43.36 in 2018 (Exhibit 5.16).
Copayments for Specialist Physician Visits by Firm Size
- In 2018, the percentage of enrolled employees in large firms who were in plans with a copayment for a specialist physician visit (54.9 percent) was lower than in small (69.5 percent) and medium firms (69.4 percent) (Exhibit 5.15).
- In 2018, the average copayment for enrolled employees in plans with a copayment for a specialist physician visit was lower in large firms ($41.40) than in small ($49.48) and medium ($48.22) firms (Exhibit 5.16).
Copayments for Specialist Physician Visits by State
- In 2018, 58.0 percent of enrolled employees in the United States had plans with a copayment for a specialist physician office visit. This figure was lower in 16 States: Alaska, Arkansas, Colorado, Connecticut, Iowa, Kansas, Maine, Minnesota, Montana, North Dakota, Ohio, Tennessee, Vermont, Washington, Wisconsin and Wyoming. It was higher in nine States: Alabama, California, District of Columbia, Hawaii, Massachusetts, Nevada, New Jersey, New York, and West Virginia (Exhibit 5.17).
- Among plans with specialist copayments, the average copayment was $43.36 in 2018. This figure was lower in 14 States: Alaska, California, District of Columbia, Hawaii, Idaho, Maryland, Massachusetts, Minnesota, North Dakota, Oregon, Rhode Island, South Dakota, Washington, and West Virginia. Specialist copayments were higher in 2018 in 10 States: Alabama, Arizona, Colorado, Florida, Georgia, Missouri, New Hampshire, North Carolina, South Carolina, and Texas (Exhibit 5.18).
Coinsurance Rates for a Specialist Physician Visit
- In 2018, 38.3 percent of enrolled employees in the United States had plans with a coinsurance rate for specialist physician office visits. This figure was higher in large firms (42.7 percent) than in small (22.6 percent) and medium firms (20.7 percent) (Exhibit 5.19).
- Among plans with a specialist coinsurance rate, the average coinsurance rate was 21.0 percent in 2018. This rate was lower in large firms (20.5 percent) than in small (24.9 percent) and medium firms (22.6 percent) (Exhibit 5.20).
Coinsurance Rates for a Specialist Physician Visit by State
- In 2018, 38.3 percent of enrolled employees in the United States had plans with a coinsurance rate for a specialist physician office visit. This figure was lower in 11 States: Alabama, California, District of Columbia, Hawaii, Indiana, Massachusetts, Nevada, New York, Pennsylvania, Rhode Island, and Vermont. It was higher in 14 States: Alaska, Colorado, Idaho, Louisiana, Maine, Minnesota, Montana, New Hampshire, North Dakota, Ohio, Tennessee, Washington, Wisconsin, and Wyoming (Exhibit 5.21).
- Among plans with specialist coinsurance, the average coinsurance rate was 21.0 percent in 2018. This figure was lower in eight States: Colorado, District of Columbia, Hawaii, Illinois, New Hampshire, New Mexico, North Dakota, and Wisconsin. It was higher in nine States: Alabama, Idaho, Montana, North Carolina, South Carolina, South Dakota, Tennessee, Vermont, and Wyoming (Exhibit 5.22).
Maximum Out-Of-Pocket Payment
- The percentage of single enrollees in a health insurance plan with a maximum out-of-pocket payment decreased from 2017 (93.4 percent) to 2018 (92.3 percent). Between 2005 and 2018, this percentage increased from 73.3 percent to 92.3 percent (Exhibit 5.23).
- From 2017 to 2018, the percentage of family enrollees in a plan with a family maximum out-of-pocket payment declined from 94.4 percent in 2017 to 93.3 percent in 2018 (p <0.10) (Exhibit 5.24).
- From 2005 to 2018, the percentage of family enrollees in a plan with a family maximum out-of-pocket payment increased by 22.8 percentage points, from 70.5 percent to 93.3 percent (Exhibit 5.24).
- For single enrollees in plans with an individual maximum out-of-pocket payment, the average maximum payment increased from $4,246 in 2017 to $4,416 in 2018. From 2005 to 2018, the individual maximum out-of-pocket payment almost doubled, rising from $2,274 to $4,416 (Exhibit 5.25).
- For family enrollees in a plan with a family maximum out-of-pocket payment, the average family maximum out-of-pocket payment increased from $8,183 in 2017 to $8,375 in 2018. From 2005 to 2018, the family maximum out-of-pocket payment increased from $4,745 to $8,375 (Exhibit 5.26).
Differences by Firm Size
- In all years from 2005 to 2018, the percentage of both single and family enrollees in a plan with a maximum out-of-pocket payment was higher in large firms (100 or more employees) than in small firms (fewer than 50 employees) (Exhibits 5.23 and 5.24).
- Also in all years from 2005 to 2018, average maximum individual out-of-pocket payments for single enrollees were lower in large firms than in small firms. They were also lower in large firms than in medium firms (50 to 99 employees) in most years in this period. In 2018, average maximum individual out-of-pocket payments were higher in small ($4,730) and medium ($4,813) firms than in large firms ($4,312) (Exhibit 5.25).
- In most years from 2005 to 2018, average maximum family out-of-pocket payments for family enrollees were lower in large firms than in small firms. In 2018, average family maximum out-of-pocket payments were higher in small firms ($9,025) and medium firms ($9,219) than in large firms ($8,240) (Exhibit 5.26).
High-Deductible Health Plans
- There was no significant change in the percentage of single or family enrollees in a high-deductible health plan between 2017 and 2018. This was the first year since 2008 that this percentage did not increase for single and family enrollees (Exhibits 5.27 and 5.28).
- In 2018, 53.6 percent of single enrollees and 50.7 percent of family enrollees were in a high-deductible health plan compared with 16.8 percent and 12.3 percent in 2005, respectively (Exhibits 5.27 and 5.28).
Differences by Firm Size
- In 2018, the percentage of single enrollees in high-deductible health plans was lower in large firms (51.2 percent) than in small (60.2 percent) and medium firms (62.5 percent). (This relationship by firm size was evident throughout the 2005 to 2018 period (Exhibit 5.27).
- In 2018, the percentage of family enrollees in high-deductible health plans was lower in large firms (49.2 percent) than in small (56.6 percent) and medium firms (60.0 percent). These relationships were evident in all years from 2005 to 2018, except for 2017 when there was no significant difference in this percentage between family enrollees in medium and large firms (Exhibit 5.28).
Non-High-Deductible Health Plans
- In 2018, single and family enrollees in non-high-deductible plans were more likely to be in a plan with a mixture of exclusive providers and any providers with no gatekeeper (for example, a preferred provider organization) or a plan with exclusive providers (for example, a health maintenance organization) than the other two plans type (for example, fee-for-service or indemnity plans that allow any providers and point-of-service plans with mixed providers and a gatekeeper). These last two plan types together accounted for only 5.8 percent of single enrollees and 5.1 percent of family enrollees in 2018, while non-high-deductible plans that had exclusive providers or a mixture of exclusive and any providers with no gatekeeper together accounted for 40.6 percent and 44.3 percent of all single and family enrollees, respectively (Exhibits 5.29 through 5.36).
- Between 2017 and 2018, there were no significant changes among single or family enrollees in enrollment shares across different non-high-deductible plan types (Exhibits 5.29 through 5.36).
- While there were no changes in enrollment shares in non-high-deductible plan types from 2017 to 2018, from 2005 to 2018, the percentage of single enrollees in a non-high-deductible plan with mixed providers and no gatekeeper decreased from 45.2 percent in 2005 to 27.5 percent in 2018. The percentage for family enrollees decreased from 51.6 percent in 2005 to 32.3 percent in 2018 (Exhibits 5.31 and 5.35).
- From 2005 to 2018, the percentage of single enrollees enrolled in a non-high-deductible plan with exclusive providers decreased from 22.9 percent in 2005 to 13.1 percent in 2018 and the percentage for family enrollees decreased from 21.1 percent to 12.0 percent (Exhibits 5.29 and 5.33).
- From 2005 to 2018, the percentage of single enrollees enrolled in a non-high-deductible health plan with mixed providers and a gatekeeper decreased from 9.5 percent in 2005 to 3.4 percent in 2018 and the percentage of single enrollees enrolled in a non-high-deductible health plan with any providers decreased from 5.5 percent in 2005 to 2.4 percent in 2018. The percentages of family enrollees in such plans experienced similar decreases (Exhibits 5.30, 5.32, 5.34, and 5.36).
Differences by Firm Size
- In all years from 2005 to 2018, the percentage of single enrollees enrolled in non-high-deductible health plans with exclusive providers was lower in large firms (100 or more employees) than in small firms (fewer than 50 employees). This finding was also true for family enrollees in most years from 2005 to 2018 (Exhibits 5.29 and 5.33).
- In all years from 2005 to 2018, the percentage of single and family enrollees enrolled in non-high-deductible health plans with mixed providers and no gatekeeper was higher in large firms (100 or more employees) than in small firms (fewer than 50 employees) and medium firms (50 to 99 employees) (Exhibits 5.31 and 5.35).
Return to Table of Contents
Exhibit 5.1 Percentage (standard error) of private-sector enrolled employees in a health insurance plan with a deductible, overall and by firm size, 2005‑2018
| Number of Employees |
2005 |
2006 |
2008 |
2009 |
2010 |
2011 |
2012 |
2013 |
2014 |
2015 |
2016 |
2017 |
2018 |
| U.S. |
63.9% |
66.4% |
70.7% |
73.8% |
77.5% |
77.8% |
79.6% |
81.3% |
83.9% |
85.4% |
84.5% |
87.5% |
87.3% |
| (Standard Error) |
(0.9%) |
(0.6%) |
(0.5%) |
(0.5%) |
(0.3%) |
(0.7%) |
(0.6%) |
(0.7%) |
(0.5%) |
(0.5%) |
(0.5%) |
(0.4%) |
(0.4%) |
| <50 |
65.5% |
66.6% |
70.9% |
73.5% |
75.7% |
76.3% |
79.5% |
79.5% |
80.8% |
82.1% |
81.7% |
82.3% |
83.0% |
| (Standard Error) |
(1.0%) |
(0.7%) |
(0.7%) |
(0.7%) |
(0.7%) |
(0.4%) |
(1.0%) |
(0.8%) |
(0.8%) |
(0.8%) |
(0.8%) |
(0.8%) |
(0.8%) |
| 50-99 |
61.1% |
67.9% |
70.3% |
70.6% |
78.2% |
79.6% |
80.3% |
78.0% |
82.4% |
85.3% |
82.5% |
83.7% |
85.1% |
| (Standard Error) |
(2.6%) |
(2.6%) |
(1.4%) |
(1.9%) |
(1.5%) |
(1.7%) |
(1.4%) |
(1.1%) |
(1.5%) |
(1.5%) |
(1.5%) |
(1.6%) |
(1.4%) |
| 100+ |
63.8% |
66.2% |
70.7% |
74.2% |
77.8% |
77.9% |
79.6% |
81.9% |
84.6% |
86.1% |
85.2% |
88.8% |
88.3% |
| (Standard Error) |
(1.0%) |
(0.8%) |
(0.6%) |
(0.6%) |
(0.3%) |
(1.0%) |
(0.7%) |
(0.7%) |
(0.6%) |
(0.6%) |
(0.6%) |
(0.4%) |
(0.5%) |
|
Source: Medical Expenditure Panel Survey-Insurance Component, private-sector establishments, 2005‑2018.
Note: Medical Expenditure Panel Survey-Insurance Component estimates are not available for 2007.
|
Return to Table of Contents
Exhibit 5.2 Average individual deductible (in dollars) (standard error) per employee enrolled with single coverage in a health insurance plan with a deductible, overall and by firm size, 2005‑2018
| Number of Employees |
2005 |
2006 |
2008 |
2009 |
2010 |
2011 |
2012 |
2013 |
2014 |
2015 |
2016 |
2017 |
2018 |
| U.S. |
$652 |
$714 |
$869 |
$917 |
$1,025 |
$1,123 |
$1,167 |
$1,273 |
$1,353 |
$1,541 |
$1,696 |
$1,808 |
$1,846 |
| (Standard Error) |
($11) |
($9) |
($7) |
($9) |
($18) |
($12) |
($8) |
($20) |
($13) |
($16) |
($16) |
($17) |
($17) |
| <50 |
$929 |
$1,007 |
$1,177 |
$1,283 |
$1,447 |
$1,561 |
$1,628 |
$1,695 |
$1,777 |
$1,964 |
$2,105 |
$2,136 |
$2,327 |
| (Standard Error) |
($20) |
($20) |
($13) |
($24) |
($21) |
($26) |
($25) |
($24) |
($28) |
($35) |
($34) |
($35) |
($36) |
| 50-99 |
$836 |
$855 |
$1,149 |
$1,249 |
$1,522 |
$1,543 |
$1,622 |
$1,755 |
$1,744 |
$2,008 |
$2,173 |
$2,361 |
$2,369 |
| (Standard Error) |
($67) |
($71) |
($62) |
($46) |
($57) |
($49) |
($64) |
($49) |
($59) |
($62) |
($64) |
($85) |
($65) |
| 100+ |
$539 |
$605 |
$740 |
$774 |
$852 |
$951 |
$989 |
$1,106 |
$1,205 |
$1,383 |
$1,558 |
$1,681 |
$1,692 |
| (Standard Error) |
($9) |
($12) |
($8) |
($7) |
($20) |
($14) |
($10) |
($19) |
($14) |
($18) |
($18) |
($20) |
($19) |
|
Source: Medical Expenditure Panel Survey-Insurance Component, private-sector establishments, 2005‑2018.
Note: Medical Expenditure Panel Survey-Insurance Component estimates are not available for 2007. In 2015, the methodology
for calibrating the upper edit bound for the individual deductible amount changed, causing the average individual deductible per
employee enrolled with single coverage in a health insurance plan with a deductible to increase by about 5 percent at the national
level in 2015 relative to the earlier methodology.
|
Return to Table of Contents
Exhibit 5.3 Average family deductible (in dollars) (standard error) per employee enrolled with family coverage in a health insurance plan with a deductible, overall and by firm size, 2005‑2018
| Number of Employees |
2005 |
2006 |
2008 |
2009 |
2010 |
2011 |
2012 |
2013 |
2014 |
2015 |
2016 |
2017 |
2018 |
| U.S. |
$1,232 |
$1,351 |
$1,658 |
$1,761 |
$1,975 |
$2,220 |
$2,322 |
$2,491 |
$2,640 |
$2,915 |
$3,069 |
$3,396 |
$3,392 |
| (Standard Error) |
($25) |
($14) |
($21) |
($20) |
($33) |
($31) |
($26) |
($23) |
($28) |
($32) |
($37) |
($48) |
($37) |
| <50 |
$1,899 |
$1,923 |
$2,389 |
$2,652 |
$2,857 |
$3,329 |
$3,515 |
$3,761 |
$3,810 |
$4,090 |
$3,940 |
$4,447 |
$4,364 |
| (Standard Error) |
($133) |
($58) |
($56) |
($50) |
($42) |
($57) |
($71) |
($56) |
($71) |
($88) |
($98) |
($126) |
($97) |
| 50-99 |
$1,534 |
$1,649 |
$2,173 |
$2,362 |
$3,040 |
$3,349 |
$3,523 |
$3,634 |
$3,404 |
$3,875 |
$3,840 |
$4,218 |
$4,755 |
| (Standard Error) |
($98) |
($81) |
($93) |
($113) |
($101) |
($138) |
($113) |
($157) |
($112) |
($148) |
($174) |
($216) |
($172) |
| 100+ |
$1,082 |
$1,215 |
$1,488 |
$1,552 |
$1,734 |
$1,954 |
$2,038 |
$2,215 |
$2,408 |
$2,676 |
$2,887 |
$3,195 |
$3,179 |
| (Standard Error) |
($17) |
($23) |
($23) |
($21) |
($33) |
($37) |
($31) |
($18) |
($31) |
($34) |
($41) |
($53) |
($40) |
|
Source: Medical Expenditure Panel Survey-Insurance Component, private-sector establishments, 2005‑2018.
Note: Medical Expenditure Panel Survey-Insurance Component estimates are not available for 2007.
|
Return to Table of Contents
Exhibit 5.4 Percentage (standard error) of private-sector enrolled employees in a health insurance plan with a deductible, overall and by State, 2018
| Alabama |
87.8% |
Kentucky |
92.6%* |
North Dakota |
94.4%* |
| (Standard Error) |
(2.9%) |
(Standard Error) |
(2.0%) |
(Standard Error) |
(1.5%) |
| Alaska |
94.3%* |
Louisiana |
94.4%* |
Ohio |
90.3% |
| (Standard Error) |
(1.7%) |
(Standard Error) |
(1.2%) |
(Standard Error) |
(2.0%) |
| Arizona |
93.1%* |
Maine |
98.1%* |
Oklahoma |
93.3%* |
| (Standard Error) |
(1.8%) |
(Standard Error) |
(0.6%) |
(Standard Error) |
(1.5%) |
| Arkansas |
94.4%* |
Maryland |
83.2% |
Oregon |
93.0%* |
| (Standard Error) |
(1.5%) |
(Standard Error) |
(2.6%) |
(Standard Error) |
(1.6%) |
| California |
67.4%* |
Massachusetts |
83.9% |
Pennsylvania |
90.4%* |
| (Standard Error) |
(2.0%) |
(Standard Error) |
(2.4%) |
(Standard Error) |
(1.4%) |
| Colorado |
93.0%* |
Michigan |
94.0%* |
Rhode Island |
89.6% |
| (Standard Error) |
(1.6%) |
(Standard Error) |
(1.3%) |
(Standard Error) |
(1.6%) |
| Connecticut |
87.9% |
Minnesota |
95.9%* |
South Carolina |
95.3%* |
| (Standard Error) |
(2.2%) |
(Standard Error) |
(1.0%) |
(Standard Error) |
(1.7%) |
| Delaware |
90.4% |
Mississippi |
94.1%* |
South Dakota |
98.5%* |
| (Standard Error) |
(1.9%) |
(Standard Error) |
(1.7%) |
(Standard Error) |
(0.7%) |
| District of Columbia |
64.6%* |
Missouri |
86.5%* |
Tennessee |
94.3%* |
| (Standard Error) |
(2.8%) |
(Standard Error) |
(4.1%) |
(Standard Error) |
(1.5%) |
| Florida |
90.8%* |
Montana |
95.0%* |
Texas |
93.6%* |
| (Standard Error) |
(1.5%) |
(Standard Error) |
(2.2%) |
(Standard Error) |
(0.8%) |
| Georgia |
95.4%* |
Nebraska |
97.8%* |
Utah |
97.1%* |
| (Standard Error) |
(1.0%) |
(Standard Error) |
(0.8%) |
(Standard Error) |
(1.0%) |
| Hawaii |
44.4%* |
Nevada |
82.7% |
Vermont |
93.2%* |
| (Standard Error) |
(5.0%) |
(Standard Error) |
(3.2%) |
(Standard Error) |
(1.8%) |
| Idaho |
94.1%* |
New Hampshire |
94.0%* |
Virginia |
90.6% |
| (Standard Error) |
(0.8%) |
(Standard Error) |
(1.8%) |
(Standard Error) |
(1.8%) |
| Illinois |
85.1% |
New Jersey |
85.8% |
Washington |
95.6%* |
| (Standard Error) |
(2.6%) |
(Standard Error) |
(2.0%) |
(Standard Error) |
(1.5%) |
| Indiana |
97.3%* |
New Mexico |
92.6%* |
West Virginia |
91.2% |
| (Standard Error) |
(0.7%) |
(Standard Error) |
(1.5%) |
(Standard Error) |
(2.2%) |
| Iowa |
93.0%* |
New York |
75.2%* |
Wisconsin |
94.1%* |
| (Standard Error) |
(1.8%) |
(Standard Error) |
(2.1%) |
(Standard Error) |
1.5%) |
| Kansas |
95.4%* |
North Carolina |
88.2% |
Wyoming |
96.0%* |
| (Standard Error) |
(0.8%) |
(Standard Error) |
(2.3%) |
(Standard Error) |
(1.6%) |
|
Source: Medical Expenditure Panel Survey-Insurance Component, private-sector establishments, 2018.
Note: * Statistically different from the national average of 87.3 percent at p < 0.05.
Note that the standard error on the national estimate of 87.3 percent is 0.40.
|
Return to Table of Contents
Exhibit 5.5 Average individual deductible (in dollars) (standard error) per employee enrolled with single coverage in a health insurance plan with a deductible, overall and by State, 2018
| Alabama |
$1,569* |
Kentucky |
$1,833 |
North Dakota |
$1,742 |
| (Standard Error) |
($120) |
(Standard Error) |
($93) |
(Standard Error) |
($82) |
| Alaska |
$1,797 |
Louisiana |
$1,656* |
Ohio |
$1,932 |
| (Standard Error) |
($89) |
(Standard Error) |
($85) |
(Standard Error) |
($79) |
| Arizona |
$2,166* |
Maine |
$2,447* |
Oklahoma |
$1,683* |
| (Standard Error) |
($110) |
(Standard Error) |
($93) |
(Standard Error) |
($69) |
| Arkansas |
$1,501* |
Maryland |
$1,511* |
Oregon |
$1,954 |
| (Standard Error) |
($91) |
(Standard Error) |
($76) |
(Standard Error) |
($100) |
| California |
$1,680* |
Massachusetts |
$1,454* |
Pennsylvania |
$1,831 |
| (Standard Error) |
($53) |
(Standard Error) |
($64) |
(Standard Error) |
($73) |
| Colorado |
$2,005 |
Michigan |
$1,732 |
Rhode Island |
$1,849 |
| (Standard Error) |
($87) |
(Standard Error) |
($125) |
(Standard Error) |
($79) |
| Connecticut |
$2,322* |
Minnesota |
$2,045* |
South Carolina |
$1,721 |
| (Standard Error) |
($92) |
(Standard Error) |
($80) |
(Standard Error) |
($78) |
| Delaware |
$1,710 |
Mississippi |
$1,695 |
South Dakota |
$2,241* |
| (Standard Error) |
($78) |
(Standard Error) |
($102) |
(Standard Error) |
($76) |
| District of Columbia |
$1,308* |
Missouri |
$1,931 |
Tennessee |
$2,235* |
| (Standard Error) |
($104) |
(Standard Error) |
($88) |
(Standard Error) |
($128) |
| Florida |
$1,963 |
Montana |
$2,116* |
Texas |
$1,982 |
| (Standard Error) |
($92) |
(Standard Error) |
($111) |
(Standard Error) |
($73) |
| Georgia |
$1,917 |
Nebraska |
$1,842 |
Utah |
$1,451* |
| (Standard Error) |
($92) |
(Standard Error) |
($101) |
(Standard Error) |
($64) |
| Hawaii |
$1,308 |
Nevada |
$2,001 |
Vermont |
$2,192* |
| (Standard Error) |
($274) |
(Standard Error) |
($149) |
(Standard Error) |
($105) |
| Idaho |
$1,894 |
New Hampshire |
$2,337* |
Virginia |
$1,886 |
| (Standard Error) |
($110) |
(Standard Error) |
($103) |
(Standard Error) |
($105) |
| Illinois |
$1,752 |
New Jersey |
$1,770 |
Washington |
$1,706 |
| (Standard Error) |
($88) |
(Standard Error) |
($83) |
(Standard Error) |
($81) |
| Indiana |
$1,873 |
New Mexico |
$1,615 |
West Virginia |
$1,885 |
| (Standard Error) |
($120) |
(Standard Error) |
($119) |
(Standard Error) |
($103) |
| Iowa |
$2,130* |
New York |
$1,554* |
Wisconsin |
$1,914 |
| (Standard Error) |
($120) |
(Standard Error) |
($83) |
(Standard Error) |
($99) |
| Kansas |
$1,715 |
North Carolina |
$2,070* |
Wyoming |
$1,999 |
| (Standard Error) |
($69) |
(Standard Error) |
($78) |
(Standard Error) |
($85) |
|
Source: Medical Expenditure Panel Survey-Insurance Component, private-sector establishments, 2018.
Note: * Statistically different from the national average of $1,846 at p < 0.05.
Note that the standard error on the national estimate of $1,846 is $16.68.
|
Return to Table of Contents
Exhibit 5.6 Average family deductible (in dollars) (standard error) per employee enrolled with family coverage in a health insurance plan with a deductible, overall and by State, 2018
| Alabama |
$2,924* |
Kentucky |
$3,248 |
North Dakota |
$3,574 |
| (Standard Error) |
($201) |
(Standard Error) |
($181) |
(Standard Error) |
($168) |
| Alaska |
$3,225 |
Louisiana |
$3,383 |
Ohio |
$3,738* |
| (Standard Error) |
($226) |
(Standard Error) |
($177) |
(Standard Error) |
($159) |
| Arizona |
$3,926 |
Maine |
$3,895* |
Oklahoma |
$3,201 |
| (Standard Error) |
($297) |
(Standard Error) |
($227) |
(Standard Error) |
($221) |
| Arkansas |
$3,144 |
Maryland |
$2,943* |
Oregon |
$3,348 |
| (Standard Error) |
($179) |
(Standard Error) |
($172) |
(Standard Error) |
($204) |
| California |
$3,231 |
Massachusetts |
$2,729* |
Pennsylvania |
$2,994* |
| (Standard Error) |
($143) |
(Standard Error) |
($161) |
(Standard Error) |
($178) |
| Colorado |
$4,011* |
Michigan |
$3,062 |
Rhode Island |
$3,795 |
| (Standard Error) |
($211) |
(Standard Error) |
($227) |
(Standard Error) |
($281) |
| Connecticut |
$3,784 |
Minnesota |
$4,033* |
South Carolina |
$3,124 |
| (Standard Error) |
($216) |
(Standard Error) |
($184) |
(Standard Error) |
($194) |
| Delaware |
$3,285 |
Mississippi |
$3,707 |
South Dakota |
$4,002* |
| (Standard Error) |
($203) |
(Standard Error) |
($377) |
(Standard Error) |
($146) |
| District of Columbia |
$2,362* |
Missouri |
$3,539 |
Tennessee |
$3,879 |
| (Standard Error) |
($157) |
(Standard Error) |
($234) |
(Standard Error) |
($271) |
| Florida |
$3,674 |
Montana |
$3,498 |
Texas |
$3,547 |
| (Standard Error) |
($199) |
(Standard Error) |
($306) |
(Standard Error) |
($145) |
| Georgia |
$3,661 |
Nebraska |
$3,272 |
Utah |
$3,164 |
| (Standard Error) |
($194) |
(Standard Error) |
($254) |
(Standard Error) |
($150) |
| Hawaii |
$3,240 |
Nevada |
$3,710 |
Vermont |
$3,686 |
| (Standard Error) |
($606) |
(Standard Error) |
($321) |
(Standard Error) |
($231) |
| Idaho |
$3,249 |
New Hampshire |
$4,644* |
Virginia |
$3,043 |
| (Standard Error) |
($231) |
(Standard Error) |
($233) |
(Standard Error) |
($225) |
| Illinois |
$3,324 |
New Jersey |
$3,614 |
Washington |
$3,139 |
| (Standard Error) |
($219) |
(Standard Error) |
($234) |
(Standard Error) |
($179) |
| Indiana |
$3,199 |
New Mexico |
$3,021 |
West Virginia |
$2,923 |
| (Standard Error) |
($262) |
(Standard Error) |
($278) |
(Standard Error) |
($253) |
| Iowa |
$3,657 |
New York |
$2,888* |
Wisconsin |
$3,619 |
| (Standard Error) |
($183) |
(Standard Error) |
($180) |
(Standard Error) |
($269) |
| Kansas |
$3,398 |
North Carolina |
$3,752 |
Wyoming |
$3,902* |
| (Standard Error) |
($165) |
(Standard Error) |
($184) |
(Standard Error) |
($180) |
|
Source: Medical Expenditure Panel Survey-Insurance Component, private-sector establishments, 2018.
Note: * Statistically different from the national average of $3,392 at p < 0.05.
Note that the standard error on the national estimate of $3,392 is $36.94.
|
Return to Table of Contents
Exhibit 5.7 Percentage (standard error) of private-sector enrolled employees in a health insurance plan with a physician visit coinsurance rate, overall and by firm size, 2005‑2018
| Number of Employees |
2005 |
2006 |
2008 |
2009 |
2010 |
2011 |
2012 |
2013 |
2014 |
2015 |
2016 |
2017 |
2018 |
| U.S. |
18.3% |
22.4% |
23.3% |
23.1% |
25.1% |
26.1% |
27.4% |
30.4% |
32.6% |
35.0% |
34.9% |
37.6% |
37.7% |
| (Standard Error) |
(0.4%) |
(0.2%) |
(0.7%) |
(0.7%) |
(0.7%) |
(0.4%) |
(0.4%) |
(0.3%) |
(0.6%) |
(0.6%) |
(0.6%) |
(0.7%) |
(0.6%) |
| <50 |
14.0% |
17.2% |
16.9% |
15.9% |
14.9% |
15.4% |
17.3% |
18.7% |
19.5% |
20.4% |
20.6% |
22.1% |
22.4% |
| (Standard Error) |
(0.7%) |
(0.7%) |
(0.4%) |
(0.5%) |
(0.4%) |
(0.5%) |
(0.5%) |
(1.0%) |
(0.7%) |
(0.9%) |
(0.8%) |
(0.8%) |
(0.8%) |
| 50-99 |
16.8% |
14.5% |
15.1% |
13.5% |
15.1% |
14.8% |
17.2% |
18.8% |
19.1% |
21.8% |
21.5% |
21.8% |
21.3% |
| (Standard Error) |
(1.2%) |
(1.6%) |
(0.9%) |
(1.7%) |
(1.4%) |
(1.6%) |
(1.2%) |
(1.0%) |
(1.5%) |
(1.7%) |
(1.6%) |
(1.6%) |
(1.6%) |
| 100+ |
19.5% |
24.4% |
25.6% |
25.7% |
28.5% |
29.6% |
30.6% |
34.1% |
36.6% |
39.2% |
38.9% |
41.9% |
42.0% |
| (Standard Error) |
(0.6%) |
(0.6%) |
(1.0%) |
(0.9%) |
(0.9%) |
(0.5%) |
(0.5%) |
(0.5%) |
(0.8%) |
(0.8%) |
(0.7%) |
(0.9%) |
(0.8%) |
|
Source: Medical Expenditure Panel Survey-Insurance Component, private-sector establishments, 2005‑2018.
Note: Medical Expenditure Panel Survey-Insurance Component estimates are not available for 2007.
|
Return to Table of Contents
Exhibit 5.8 Average coinsurance rate (in percentage) (standard error) for a physician office visit per employee enrolled in a health insurance plan with a physician visit coinsurance rate, overall and by firm size, 2005‑2018
| Number of Employees |
2005 |
2006 |
2008 |
2009 |
2010 |
2011 |
2012 |
2013 |
2014 |
2015 |
2016 |
2017 |
2018 |
| U.S. |
18.3% |
18.5% |
18.9% |
18.6% |
18.8% |
18.9% |
19.0% |
19.2% |
19.8% |
20.1% |
20.5% |
20.1% |
20.2% |
| (Standard Error) |
(0.1%) |
(0.1%) |
(0.2%) |
(0.1%) |
(0.2%) |
(0.2%) |
(0.2%) |
(0.1%) |
(0.1%) |
(0.1%) |
(0.1%) |
(0.2%) |
(0.2%) |
| <50 |
20.4% |
20.2% |
20.7% |
20.2% |
20.0% |
21.5% |
20.8% |
21.3% |
21.5% |
22.6% |
22.2% |
22.2% |
23.0% |
| (Standard Error) |
(0.5%) |
(0.1%) |
(0.4%) |
(0.3%) |
(0.2%) |
(0.3%) |
(0.2%) |
(0.4%) |
(0.3%) |
(0.4%) |
(0.4%) |
(0.4%) |
(0.4%) |
| 50-99 |
18.0% |
18.9% |
19.3% |
19.0% |
19.6% |
20.2% |
20.7% |
21.0% |
21.1% |
21.6% |
22.3% |
21.9% |
21.6% |
| (Standard Error) |
(0.6%) |
(0.7%) |
(0.7%) |
(0.6%) |
(0.8%) |
(0.8%) |
(0.4%) |
(0.7%) |
(0.7%) |
(0.7%) |
(0.7%) |
(0.7%) |
(0.7%) |
| 100+ |
17.9% |
18.1% |
18.5% |
18.4% |
18.6% |
18.5% |
18.7% |
18.8% |
19.5% |
19.8% |
20.2% |
19.8% |
19.8% |
| (Standard Error) |
(0.2%) |
(0.1%) |
(0.2%) |
(0.2%) |
(0.2%) |
(0.2%) |
(0.2%) |
(0.1%) |
(0.2%) |
(0.2%) |
(0.2%) |
(0.2%) |
(0.2%) |
|
Source: Medical Expenditure Panel Survey-Insurance Component, private-sector establishments, 2005‑2018.
Note: Medical Expenditure Panel Survey-Insurance Component estimates are not available for 2007.
|
Return to Table of Contents
Exhibit 5.9 Percentage (standard error) of private-sector enrolled employees in a health insurance plan with a physician visit coinsurance rate, overall and by State, 2018
| Alabama |
30.7%* |
Kentucky |
36.3% |
North Dakota |
56.0%* |
| (Standard Error) |
(3.2%) |
(Standard Error) |
(3.2%) |
(Standard Error) |
(3.3%) |
| Alaska |
56.7%* |
Louisiana |
44.0% |
Ohio |
44.4%* |
| (Standard Error) |
(4.3%) |
(Standard Error) |
(4.0%) |
(Standard Error) |
(3.2%) |
| Arizona |
38.1% |
Maine |
48.8%* |
Oklahoma |
37.5% |
| (Standard Error) |
(4.0%) |
(Standard Error) |
(3.5%) |
(Standard Error) |
(3.6%) |
| Arkansas |
34.6% |
Maryland |
34.2% |
Oregon |
36.7% |
| (Standard Error) |
(3.7%) |
(Standard Error) |
(3.4%) |
(Standard Error) |
(3.8%) |
| California |
31.6%* |
Massachusetts |
22.1%* |
Pennsylvania |
31.2%* |
| (Standard Error) |
(2.2%) |
(Standard Error) |
(2.7%) |
(Standard Error) |
(3.0%) |
| Colorado |
46.8%* |
Michigan |
32.0% |
Rhode Island |
27.5%* |
| (Standard Error) |
(3.4%) |
(Standard Error) |
(3.5%) |
(Standard Error) |
(3.2%) |
| Connecticut |
38.0% |
Minnesota |
56.9%* |
South Carolina |
39.8% |
| (Standard Error) |
(5.0%) |
(Standard Error) |
(3.1%) |
(Standard Error) |
(3.5%) |
| Delaware |
34.4% |
Mississippi |
38.3% |
South Dakota |
39.9% |
| (Standard Error) |
(3.5%) |
(Standard Error) |
(4.7%) |
(Standard Error) |
(3.4%) |
| District of Columbia |
18.8%* |
Missouri |
34.4% |
Tennessee |
50.3%* |
| (Standard Error) |
(2.3%) |
(Standard Error) |
(3.9%) |
(Standard Error) |
(3.7%) |
| Florida |
38.7% |
Montana |
48.2%* |
Texas |
40.2% |
| (Standard Error) |
(3.8%) |
(Standard Error) |
(3.8%) |
(Standard Error) |
(2.9%) |
| Georgia |
41.1% |
Nebraska |
36.3% |
Utah |
44.6% |
| (Standard Error) |
(3.5%) |
(Standard Error) |
(4.0%) |
(Standard Error) |
(5.2%) |
| Hawaii |
29.7%* |
Nevada |
34.5% |
Vermont |
34.6% |
| (Standard Error) |
(3.0%) |
(Standard Error) |
(5.4%) |
(Standard Error) |
(4.5%) |
| Idaho |
40.5% |
New Hampshire |
44.6% |
Virginia |
39.1% |
| (Standard Error) |
(3.9%) |
(Standard Error) |
(3.9%) |
(Standard Error) |
(4.1%) |
| Illinois |
37.5% |
New Jersey |
40.6% |
Washington |
49.9%* |
| (Standard Error) |
(3.7%) |
(Standard Error) |
(3.7%) |
(Standard Error) |
(3.9%) |
| Indiana |
30.5%* |
New Mexico |
37.2% |
West Virginia |
36.3% |
| (Standard Error) |
(3.3%) |
(Standard Error) |
(3.5%) |
(Standard Error) |
(3.9%) |
| Iowa |
42.3% |
New York |
32.8% |
Wisconsin |
48.8%* |
| (Standard Error) |
(3.4%) |
(Standard Error) |
(2.8%) |
(Standard Error) |
(4.1%) |
| Kansas |
37.7% |
North Carolina |
37.8% |
Wyoming |
57.1%* |
| (Standard Error) |
(3.6%) |
(Standard Error) |
(3.2%) |
(Standard Error) |
(3.6%) |
|
Source: Medical Expenditure Panel Survey-Insurance Component, private-sector establishments, 2018.
Note: * Statistically different from the national average of 37.7 percent at p < 0.05.
Note that the standard error on the national estimate of 37.7 percent is 0.64.
|
Return to Table of Contents
Exhibit 5.10 Average coinsurance (in percentage) (standard error) for a physician office visit per employee enrolled in a health insurance plan with a physician visit coinsurance rate, overall and by State, 2018
| Alabama |
24.7%* |
Kentucky |
19.7% |
North Dakota |
17.3%* |
| (Standard Error) |
(1.2%) |
(Standard Error) |
(1.3%) |
(Standard Error) |
(0.5%) |
| Alaska |
19.5% |
Louisiana |
20.6% |
Ohio |
19.8% |
| (Standard Error) |
(0.5%) |
(Standard Error) |
(0.7%) |
(Standard Error) |
(0.7%) |
| Arizona |
18.9% |
Maine |
20.6% |
Oklahoma |
19.9% |
| (Standard Error) |
(1.1%) |
(Standard Error) |
(1.0%) |
(Standard Error) |
(0.4%) |
| Arkansas |
20.1% |
Maryland |
19.6% |
Oregon |
22.3% |
| (Standard Error) |
(0.8%) |
(Standard Error) |
(0.6%) |
(Standard Error) |
(2.6%) |
| California |
20.1% |
Massachusetts |
18.2%* |
Pennsylvania |
19.8% |
| (Standard Error) |
(0.4%) |
(Standard Error) |
(1.0%) |
(Standard Error) |
(1.2%) |
| Colorado |
19.4% |
Michigan |
20.9% |
Rhode Island |
18.7%* |
| (Standard Error) |
(0.5%) |
(Standard Error) |
(0.8%) |
(Standard Error) |
(0.7%) |
| Connecticut |
19.9% |
Minnesota |
19.7% |
South Carolina |
23.1%* |
| (Standard Error) |
(0.7%) |
(Standard Error) |
(0.6%) |
(Standard Error) |
(1.1%) |
| Delaware |
17.6%* |
Mississippi |
21.7%* |
South Dakota |
21.7% |
| (Standard Error) |
(1.2%) |
(Standard Error) |
(0.7%) |
(Standard Error) |
(0.8%) |
| District of Columbia |
16.8%* |
Missouri |
20.8% |
Tennessee |
23.9%* |
| (Standard Error) |
(0.7%) |
(Standard Error) |
(0.7%) |
(Standard Error) |
(0.9%) |
| Florida |
21.5% |
Montana |
23.2%* |
Texas |
19.2% |
| (Standard Error) |
(0.7%) |
(Standard Error) |
(0.8%) |
(Standard Error) |
(0.7%) |
| Georgia |
20.5% |
Nebraska |
20.6% |
Utah |
20.2% |
| (Standard Error) |
(0.5%) |
(Standard Error) |
(1.1%) |
(Standard Error) |
(0.5%) |
| Hawaii |
15.3%* |
Nevada |
19.9% |
Vermont |
22.0% |
| (Standard Error) |
(0.9%) |
(Standard Error) |
(1.6%) |
(Standard Error) |
(0.9%) |
| Idaho |
21.3%* |
New Hampshire |
17.6%* |
Virginia |
20.8% |
| (Standard Error) |
(0.4%) |
(Standard Error) |
(0.8%) |
(Standard Error) |
(0.8%) |
| Illinois |
18.0%* |
New Jersey |
20.3% |
Washington |
19.8% |
| (Standard Error) |
(0.5%) |
(Standard Error) |
(1.0%) |
(Standard Error) |
(1.1%) |
| Indiana |
19.9% |
New Mexico |
19.6% |
West Virginia |
20.4% |
| (Standard Error) |
(0.7%) |
(Standard Error) |
(0.5%) |
(Standard Error) |
(1.2%) |
| Iowa |
21.4% |
New York |
20.0% |
Wisconsin |
19.6% |
| (Standard Error) |
(0.9%) |
(Standard Error) |
(0.7%) |
(Standard Error) |
(0.8%) |
| Kansas |
19.2% |
North Carolina |
21.4% |
Wyoming |
22.0%* |
| (Standard Error) |
(0.6%) |
(Standard Error) |
(0.8%) |
(Standard Error) |
(0.7%) |
|
Source: Medical Expenditure Panel Survey-Insurance Component, private-sector establishments, 2018.
Note: * Statistically different from the national average of 20.2 percent at p < 0.05.
Note that the standard error on the national estimate of 20.2 percent is 0.15.
|
Return to Table of Contents
Exhibit 5.11 Percentage (standard error) of private-sector enrolled employees in a health insurance plan with a copayment for a physician office visit, overall and by firm size, 2005‑2018
| Number of Employees |
2005 |
2006 |
2008 |
2009 |
2010 |
2011 |
2012 |
2013 |
2014 |
2015 |
2016 |
2017 |
2018 |
| U.S. |
76.4% |
74.9% |
71.8% |
72.6% |
70.0% |
68.2% |
66.3% |
64.8% |
61.3% |
59.9% |
60.6% |
59.2% |
58.1% |
| (Standard Error) |
(0.6%) |
(0.5%) |
(0.8%) |
(0.5%) |
(0.7%) |
(0.7%) |
(0.7%) |
(0.5%) |
(0.6%) |
(0.6%) |
(0.6%) |
(0.7%) |
(0.6%) |
| <50 |
79.2% |
77.2% |
72.8% |
73.6% |
74.0% |
72.6% |
72.7% |
70.6% |
67.3% |
69.6% |
69.5% |
71.5% |
68.3% |
| (Standard Error) |
(0.7%) |
(0.3%) |
(0.7%) |
(0.5%) |
(0.4%) |
(0.7%) |
(1.0%) |
(0.7%) |
(0.9%) |
(1.0%) |
(0.9%) |
(0.9%) |
(0.9%) |
| 50-99 |
78.9% |
82.4% |
77.5% |
79.4% |
75.8% |
73.5% |
71.2% |
71.9% |
74.6% |
65.2% |
69.3% |
70.2% |
69.7% |
| (Standard Error) |
(1.2%) |
(1.2%) |
(1.0%) |
(1.8%) |
(1.6%) |
(1.1%) |
(1.7%) |
(1.5%) |
(1.6%) |
(2.0%) |
(1.8%) |
(1.8%) |
(1.8%) |
| 100+ |
75.5% |
73.7% |
71.1% |
71.7% |
68.5% |
66.7% |
64.5% |
62.9% |
58.9% |
57.4% |
58.1% |
55.9% |
55.2% |
| (Standard Error) |
(0.8%) |
(0.7%) |
(1.0%) |
(0.5%) |
(0.9%) |
(0.9%) |
(0.9%) |
(0.6%) |
(0.8%) |
(0.8%) |
(0.8%) |
(0.9%) |
(0.8%) |
|
Source: Medical Expenditure Panel Survey-Insurance Component, private-sector establishments, 2005‑2018.
Note: Medical Expenditure Panel Survey-Insurance Component estimates are not available for 2007.
|
Return to Table of Contents
Exhibit 5.12 Average copayment (in dollars) (standard error) for a physician office visit per employee enrolled in a health insurance plan with a physician visit copayment, overall and by firm size, 2005‑2018
| Number of Employees |
2005 |
2006 |
2008 |
2009 |
2010 |
2011 |
2012 |
2013 |
2014 |
2015 |
2016 |
2017 |
2018 |
| U.S. |
$18.76 |
$19.33 |
$20.53 |
$21.53 |
$22.82 |
$23.34 |
$23.77 |
$24.31 |
$24.77 |
$25.04 |
$25.89 |
$26.50 |
$26.81 |
| (Standard Error) |
($0.09) |
($0.11) |
($0.07) |
($0.10) |
($0.10) |
($0.11) |
($0.16) |
($0.13) |
($0.12) |
($0.12) |
($0.12) |
($0.13) |
($0.14) |
| <50 |
$20.40 |
$20.88 |
$22.43 |
$23.66 |
$24.79 |
$25.71 |
$26.07 |
$26.75 |
$27.14 |
$27.30 |
$27.82 |
$28.21 |
$29.16 |
| (Standard Error) |
($0.17) |
($0.24) |
($0.13) |
($0.07) |
($0.15) |
($0.17) |
($0.14) |
($0.22) |
($0.22) |
($0.22) |
($0.23) |
($0.27) |
($0.25) |
| 50-99 |
$19.49 |
$20.03 |
$21.38 |
$22.93 |
$24.62 |
$24.05 |
$25.05 |
$25.37 |
$26.29 |
$27.06 |
$27.43 |
$27.36 |
$28.37 |
| (Standard Error) |
($0.33) |
($0.50) |
($0.34) |
($0.31) |
($0.36) |
($0.34) |
($0.26) |
($0.44) |
($0.35) |
($0.40) |
($0.39) |
($0.48) |
($0.42) |
| 100+ |
$18.25 |
$18.85 |
$19.96 |
$20.86 |
$22.13 |
$22.68 |
$23.07 |
$23.60 |
$24.03 |
$24.25 |
$25.28 |
$25.99 |
$26.11 |
| (Standard Error) |
($0.12) |
($0.15) |
($0.08) |
($0.12) |
($0.11) |
($0.12) |
($0.22) |
($0.17) |
($0.14) |
($0.15) |
($0.15) |
($0.16) |
($0.16) |
|
Source: Medical Expenditure Panel Survey-Insurance Component, private-sector establishments, 2005‑2018.
Note: Medical Expenditure Panel Survey-Insurance Component estimates are not available for 2007.
|
Return to Table of Contents
Exhibit 5.13 Percentage (standard error) of private-sector enrolled employees in a health insurance plan with a copayment for a physician office visit, overall and by State, 2018
| Alabama |
67.0%* |
Kentucky |
57.6% |
North Dakota |
40.0%* |
| (Standard Error) |
(3.2%) |
(Standard Error) |
(3.4%) |
(Standard Error) |
(3.5%) |
| Alaska |
44.3%* |
Louisiana |
58.3% |
Ohio |
47.0%* |
| (Standard Error) |
(4.2%) |
(Standard Error) |
(3.9%) |
(Standard Error) |
(3.1%) |
| Arizona |
56.3% |
Maine |
42.9%* |
Oklahoma |
64.6% |
| (Standard Error) |
(3.8%) |
(Standard Error) |
(3.2%) |
(Standard Error) |
(3.5%) |
| Arkansas |
53.8% |
Maryland |
55.7% |
Oregon |
64.1% |
| (Standard Error) |
(4.0%) |
(Standard Error) |
(3.4%) |
(Standard Error) |
(3.8%) |
| California |
64.0%* |
Massachusetts |
72.6%* |
Pennsylvania |
60.7% |
| (Standard Error) |
(2.2%) |
(Standard Error) |
(2.8%) |
(Standard Error) |
(3.1%) |
| Colorado |
47.0%* |
Michigan |
64.2% |
Rhode Island |
59.7% |
| (Standard Error) |
(3.1%) |
(Standard Error) |
(3.7%) |
(Standard Error) |
(3.5%) |
| Connecticut |
51.5% |
Minnesota |
29.7%* |
South Carolina |
58.0% |
| (Standard Error) |
(4.6%) |
(Standard Error) |
(2.9%) |
(Standard Error) |
(3.6%) |
| Delaware |
59.7% |
Mississippi |
67.2%* |
South Dakota |
55.8% |
| (Standard Error) |
(3.6%) |
(Standard Error) |
(4.3%) |
(Standard Error) |
(3.2%) |
| District of Columbia |
71.2%* |
Missouri |
60.4% |
Tennessee |
48.9%* |
| (Standard Error) |
(2.6%) |
(Standard Error) |
(3.5%) |
(Standard Error) |
(4.0%) |
| Florida |
58.3% |
Montana |
43.3%* |
Texas |
55.8% |
| (Standard Error) |
(3.9%) |
(Standard Error) |
(3.6%) |
(Standard Error) |
(2.9%) |
| Georgia |
61.0% |
Nebraska |
53.7% |
Utah |
55.4% |
| (Standard Error) |
(3.5%) |
(Standard Error) |
(4.7%) |
(Standard Error) |
(5.2%) |
| Hawaii |
67.4%* |
Nevada |
63.4% |
Vermont |
45.2%* |
| (Standard Error) |
(3.0%) |
(Standard Error) |
(5.3%) |
(Standard Error) |
(4.0%) |
| Idaho |
61.8% |
New Hampshire |
53.7% |
Virginia |
53.0% |
| (Standard Error) |
(3.4%) |
(Standard Error) |
(3.7%) |
(Standard Error) |
(4.0%) |
| Illinois |
62.5% |
New Jersey |
59.6% |
Washington |
51.4% |
| (Standard Error) |
(3.6%) |
(Standard Error) |
(3.7%) |
(Standard Error) |
(4.0%) |
| Indiana |
62.1% |
New Mexico |
62.7% |
West Virginia |
63.9% |
| (Standard Error) |
(3.7%) |
(Standard Error) |
(3.4%) |
(Standard Error) |
(3.6%) |
| Iowa |
48.4%* |
New York |
62.6% |
Wisconsin |
46.6%* |
| (Standard Error) |
(3.4%) |
(Standard Error) |
(2.6%) |
(Standard Error) |
(4.0%) |
| Kansas |
56.8% |
North Carolina |
60.1% |
Wyoming |
38.5%* |
| (Standard Error) |
(3.6%) |
(Standard Error) |
(3.3%) |
(Standard Error) |
(3.6%) |
|
Source: Medical Expenditure Panel Survey-Insurance Component, private-sector establishments, 2018.
Note: * Statistically different from the national average of 58.1 percent at p < 0.05.
Note that the standard error on the national estimate of 58.1 percent is 0.64.
|
Return to Table of Contents
Exhibit 5.14 Average copayment (in dollars) (standard error) for a physician office visit per employee enrolled in a health insurance plan with a physician visit copayment, overall and by State, 2018
| Alabama |
$32.00* |
Kentucky |
$26.25 |
North Dakota |
$25.92* |
| (Standard Error) |
($0.6) |
(Standard Error) |
($0.8) |
(Standard Error) |
($0.4) |
| Alaska |
$28.51 |
Louisiana |
$30.47* |
Ohio |
$25.76 |
| (Standard Error) |
($0.9) |
(Standard Error) |
($0.9) |
(Standard Error) |
($0.8) |
| Arizona |
$27.93* |
Maine |
$26.17 |
Oklahoma |
$28.49* |
| (Standard Error) |
($0.5) |
(Standard Error) |
($0.6) |
(Standard Error) |
($0.7) |
| Arkansas |
$28.00 |
Maryland |
$24.24* |
Oregon |
$23.94* |
| (Standard Error) |
($0.7) |
(Standard Error) |
($0.7) |
(Standard Error) |
($0.7) |
| California |
$24.81* |
Massachusetts |
$25.07* |
Pennsylvania |
$24.66* |
| (Standard Error) |
($0.4) |
(Standard Error) |
($0.6) |
(Standard Error) |
($0.5) |
| Colorado |
$28.62* |
Michigan |
$26.22 |
Rhode Island |
$23.14* |
| (Standard Error) |
($0.6) |
(Standard Error) |
($0.8) |
(Standard Error) |
($0.6) |
| Connecticut |
$29.03* |
Minnesota |
$28.52 |
South Carolina |
$26.87 |
| (Standard Error) |
($0.6) |
(Standard Error) |
($0.9) |
(Standard Error) |
($0.9) |
| Delaware |
$26.53 |
Mississippi |
$30.22 |
South Dakota |
$28.71* |
| (Standard Error) |
($0.7) |
(Standard Error) |
($2.3) |
(Standard Error) |
($0.6) |
| District of Columbia |
$22.02* |
Missouri |
$29.73* |
Tennessee |
$29.63* |
| (Standard Error) |
($0.7) |
(Standard Error) |
($0.9) |
(Standard Error) |
($0.8) |
| Florida |
$28.04 |
Montana |
$27.33 |
Texas |
$29.21* |
| (Standard Error) |
($0.7) |
(Standard Error) |
($1.0) |
(Standard Error) |
($0.5) |
| Georgia |
$27.59 |
Nebraska |
$29.75* |
Utah |
$25.83 |
| (Standard Error) |
($0.5) |
(Standard Error) |
($0.7) |
(Standard Error) |
($1.5) |
| Hawaii |
$17.71* |
Nevada |
$23.85* |
Vermont |
$23.31* |
| (Standard Error) |
($0.8) |
(Standard Error) |
($0.6) |
(Standard Error) |
($0.8) |
| Idaho |
$28.70* |
New Hampshire |
$27.30 |
Virginia |
$26.86 |
| (Standard Error) |
($0.8) |
(Standard Error) |
($0.8) |
(Standard Error) |
($1.0) |
| Illinois |
$26.54 |
New Jersey |
$26.35 |
Washington |
$25.33 |
| (Standard Error) |
($0.9) |
(Standard Error) |
($0.8) |
(Standard Error) |
($0.8) |
| Indiana |
$28.98 |
New Mexico |
$25.60* |
West Virginia |
$26.41 |
| (Standard Error) |
($1.1) |
(Standard Error) |
($0.6) |
(Standard Error) |
($1.0) |
| Iowa |
$25.82 |
New York |
$25.97 |
Wisconsin |
$28.53 |
| (Standard Error) |
($0.6) |
(Standard Error) |
($0.5) |
(Standard Error) |
($1.1) |
| Kansas |
$27.80 |
North Carolina |
$27.32 |
Wyoming |
$27.71 |
| (Standard Error) |
($0.6) |
(Standard Error) |
($0.5) |
(Standard Error) |
($0.8) |
|
Source: Medical Expenditure Panel Survey-Insurance Component, private-sector establishments, 2018.
Note: * Statistically different from the national average of $26.81 at p < 0.05.
Note that the standard error on the national estimate of $26.81 is $0.14.
|
Return to Table of Contents
Exhibit 5.15 Percentage (standard error) of private-sector enrolled employees in a health insurance plan with a copayment for an office visit to a specialist physician, overall and by firm size, 2016‑2018
| Number of Employees |
2016 |
2017 |
2018 |
| U.S. |
60.8% |
58.7% |
58.0% |
| (Standard Error) |
(0.6%) |
(0.7%) |
(0.6%) |
| <50 |
69.2% |
71.8% |
69.5% |
| (Standard Error) |
(0.9%) |
(0.9%) |
(0.9%) |
| 50-99 |
70.2% |
71.1% |
69.4% |
| (Standard Error) |
(1.8%) |
(1.8%) |
(1.8%) |
| 100+ |
58.4% |
55.2% |
54.9% |
| (Standard Error) |
(0.7%) |
(0.8%) |
(0.8%) |
|
Source: Medical Expenditure Panel Survey-Insurance Component, private-sector establishments, 2016‑2018.
|
Return to Table of Contents
Exhibit 5.16 Average copayment (in dollars) (standard error) for an office visit to a specialist physician per employee enrolled in a health insurance plan with a specialist physician copayment at private-sector establishments, overall and by firm size, 2016‑2018
| Number of Employees |
2016 |
2017 |
2018 |
| U.S. |
$40.29 |
$41.97 |
$43.36 |
| (Standard Error) |
($0.23) |
($0.26) |
($0.28) |
| <50 |
$44.11 |
$46.27 |
$49.48 |
| (Standard Error) |
($0.42) |
($0.44) |
($0.47) |
| 50-99 |
$43.20 |
$43.99 |
$48.22 |
| (Standard Error) |
($0.87) |
($0.82) |
($0.88) |
| 100+ |
$39.10 |
$40.68 |
$41.40 |
| (Standard Error) |
($0.28) |
($0.32) |
($0.34) |
|
Source: Medical Expenditure Panel Survey-Insurance Component, private-sector establishments, 2016‑2018.
|
Return to Table of Contents
Exhibit 5.17 Percentage (standard error) of private-sector enrolled employees in a health insurance plan with a copayment for an office visit to a specialist physician, overall and by State, 2018
| Alabama |
70.3%* |
Kentucky |
55.7% |
North Dakota |
32.3%* |
| (Standard Error) |
(3.2%) |
(Standard Error) |
(3.4%) |
(Standard Error) |
(3.4%) |
| Alaska |
39.0%* |
Louisiana |
53.2% |
Ohio |
46.6%* |
| (Standard Error) |
(4.3%) |
(Standard Error) |
(3.9%) |
(Standard Error) |
(3.4%) |
| Arizona |
53.4% |
Maine |
43.2%* |
Oklahoma |
62.4% |
| (Standard Error) |
(3.7%) |
(Standard Error) |
(3.3%) |
(Standard Error) |
(3.6%) |
| Arkansas |
47.5%* |
Maryland |
59.1% |
Oregon |
60.5% |
| (Standard Error) |
(3.9%) |
(Standard Error) |
(3.5%) |
(Standard Error) |
(4.2%) |
| California |
64.1%* |
Massachusetts |
72.5%* |
Pennsylvania |
61.3% |
| (Standard Error) |
(2.2%) |
(Standard Error) |
(2.8%) |
(Standard Error) |
(3.1%) |
| Colorado |
47.3%* |
Michigan |
57.4% |
Rhode Island |
63.2% |
| (Standard Error) |
(3.1%) |
(Standard Error) |
(4.4%) |
(Standard Error) |
(3.5%) |
| Connecticut |
48.3%* |
Minnesota |
29.6%* |
South Carolina |
58.8% |
| (Standard Error) |
(4.6%) |
(Standard Error) |
(3.1%) |
(Standard Error) |
(3.6%) |
| Delaware |
54.6% |
Mississippi |
67.0% |
South Dakota |
54.5% |
| (Standard Error) |
(3.5%) |
(Standard Error) |
(4.6%) |
(Standard Error) |
(3.2%) |
| District of Columbia |
77.4%* |
Missouri |
62.1% |
Tennessee |
48.8%* |
| (Standard Error) |
(2.2%) |
(Standard Error) |
(3.4%) |
(Standard Error) |
(4.0%) |
| Florida |
61.1% |
Montana |
37.7%* |
Texas |
57.1% |
| (Standard Error) |
(3.9%) |
(Standard Error) |
(3.5%) |
(Standard Error) |
(2.9%) |
| Georgia |
62.5% |
Nebraska |
50.6% |
Utah |
51.4% |
| (Standard Error) |
(3.4%) |
(Standard Error) |
(4.5%) |
(Standard Error) |
(5.4%) |
| Hawaii |
66.8%* |
Nevada |
67.6%* |
Vermont |
49.1%* |
| (Standard Error) |
(3.0%) |
(Standard Error) |
(3.0%) |
(Standard Error) |
(3.3%) |
| Idaho |
52.2% |
New Hampshire |
51.3% |
Virginia |
57.7% |
| (Standard Error) |
(3.8%) |
(Standard Error) |
(3.6%) |
(Standard Error) |
(4.1%) |
| Illinois |
62.7% |
New Jersey |
65.3%* |
Washington |
45.0%* |
| (Standard Error) |
(3.7%) |
(Standard Error) |
(3.4%) |
(Standard Error) |
(3.9%) |
| Indiana |
61.2% |
New Mexico |
64.2% |
West Virginia |
65.4%* |
| (Standard Error) |
(3.7%) |
(Standard Error) |
(3.4%) |
(Standard Error) |
(3.6%) |
| Iowa |
51.2%* |
New York |
63.9%* |
Wisconsin |
46.1%* |
| (Standard Error) |
(3.4%) |
(Standard Error) |
(2.6%) |
(Standard Error) |
(4.2%) |
| Kansas |
49.5%* |
North Carolina |
57.8% |
Wyoming |
35.5%* |
| (Standard Error) |
(3.5%) |
(Standard Error) |
(3.3%) |
(Standard Error) |
(3.6%) |
|
Source: Medical Expenditure Panel Survey-Insurance Component, private-sector establishments, 2018.
Note: * Statistically different from the national average of 58.0 percent at p < 0.05.
Note that the standard error on the national estimate of 58.0 percent is 0.65.
|
Return to Table of Contents
Exhibit 5.18 Average copayment (in dollars) (standard error) for an office visit to a specialist physician per employee enrolled in a health insurance plan with a specialist physician copayment at private-sector establishments, overall and by State, 2018
| Alabama |
$46.84* |
Kentucky |
$45.90 |
North Dakota |
$34.37* |
| (Standard Error) |
($1.1) |
(Standard Error) |
($1.8) |
(Standard Error) |
($1.4) |
| Alaska |
$37.71* |
Louisiana |
$47.17 |
Ohio |
$45.46 |
| (Standard Error) |
($2.0) |
(Standard Error) |
($2.0) |
(Standard Error) |
($1.5) |
| Arizona |
$47.08* |
Maine |
$42.65 |
Oklahoma |
$44.02 |
| (Standard Error) |
($1.5) |
(Standard Error) |
($1.2) |
(Standard Error) |
($1.2) |
| Arkansas |
$44.80 |
Maryland |
$38.65* |
Oregon |
$35.03* |
| (Standard Error) |
($1.8) |
(Standard Error) |
($1.2) |
(Standard Error) |
($1.3) |
| California |
$36.14* |
Massachusetts |
$36.53* |
Pennsylvania |
$41.40 |
| (Standard Error) |
($0.8) |
(Standard Error) |
($0.9) |
(Standard Error) |
($1.0) |
| Colorado |
$49.30* |
Michigan |
$40.73 |
Rhode Island |
$37.70* |
| (Standard Error) |
($1.5) |
(Standard Error) |
($2.0) |
(Standard Error) |
($1.1) |
| Connecticut |
$43.03 |
Minnesota |
$38.57* |
South Carolina |
$47.51* |
| (Standard Error) |
($0.9) |
(Standard Error) |
($1.6) |
(Standard Error) |
($1.3) |
| Delaware |
$43.47 |
Mississippi |
$42.18 |
South Dakota |
$39.82* |
| (Standard Error) |
($1.3) |
(Standard Error) |
($3.0) |
(Standard Error) |
($1.5) |
| District of Columbia |
$33.76* |
Missouri |
$51.33* |
Tennessee |
$45.48 |
| (Standard Error) |
($1.1) |
(Standard Error) |
($1.9) |
(Standard Error) |
($1.7) |
| Florida |
$49.59* |
Montana |
$42.11 |
Texas |
$48.55* |
| (Standard Error) |
($1.4) |
(Standard Error) |
($1.6) |
(Standard Error) |
($1.1) |
| Georgia |
$47.35* |
Nebraska |
$46.57 |
Utah |
$40.65 |
| (Standard Error) |
($1.5) |
(Standard Error) |
($2.7) |
(Standard Error) |
($2.5) |
| Hawaii |
$20.14* |
Nevada |
$44.02 |
Vermont |
$41.45 |
| (Standard Error) |
($0.9) |
(Standard Error) |
($1.8) |
(Standard Error) |
($1.6) |
| Idaho |
$39.48* |
New Hampshire |
$46.62* |
Virginia |
$43.34 |
| (Standard Error) |
($1.8) |
(Standard Error) |
($1.5) |
(Standard Error) |
($1.5) |
| Illinois |
$45.42 |
New Jersey |
$46.23 |
Washington |
$35.70* |
| (Standard Error) |
($1.9) |
(Standard Error) |
($1.8) |
(Standard Error) |
($1.4) |
| Indiana |
$45.37 |
New Mexico |
$44.27 |
West Virginia |
$38.32* |
| (Standard Error) |
($2.7) |
(Standard Error) |
($1.6) |
(Standard Error) |
($2.0) |
| Iowa |
$43.14 |
New York |
$41.51 |
Wisconsin |
$46.73 |
| (Standard Error) |
($1.6) |
(Standard Error) |
($0.9) |
(Standard Error) |
($2.1) |
| Kansas |
$41.50 |
North Carolina |
$51.00* |
Wyoming |
$44.82 |
| (Standard Error) |
($1.6) |
(Standard Error) |
($1.1) |
(Standard Error) |
($1.4) |
|
Source: Medical Expenditure Panel Survey-Insurance Component, private-sector establishments, 2018.
Note: * Statistically different from the national average of $43.36 at p < 0.05.
Note that the standard error on the national estimate of $43.36 is $0.28.
|
Return to Table of Contents
Exhibit 5.19 Percentage (standard error) of private-sector enrolled employees in a health insurance plan with a coinsurance payment for an office visit to a specialist physician, overall and by firm size, 2016‑2018
| Number of Employees |
2016 |
2017 |
2018 |
| U.S. |
35.5% |
38.1% |
38.3% |
| (Standard Error) |
(0.6%) |
(0.7%) |
(0.6%) |
| <50 |
22.3% |
22.3% |
22.6% |
| (Standard Error) |
(0.8%) |
(0.8%) |
(0.8%) |
| 50-99 |
22.3% |
21.7% |
20.7% |
| (Standard Error) |
(1.6%) |
(1.6%) |
(1.5%) |
| 100+ |
39.3% |
42.5% |
42.7% |
| (Standard Error) |
(0.7%) |
(0.8%) |
(0.8%) |
|
Source: Medical Expenditure Panel Survey-Insurance Component, private-sector establishments, 2016‑2018.
|
Return to Table of Contents
Exhibit 5.20 Average coinsurance rate (in percentage) (standard error) for an office visit to a specialist physician per employee enrolled in a health insurance plan with a specialist physician coinsurance rate at private-sector establishments, overall and by firm size, 2016‑2018
| Number of Employees |
2016 |
2017 |
2018 |
| U.S. |
20.7% |
21.2% |
21.0% |
| (Standard Error) |
(0.2%) |
(0.2%) |
(0.2%) |
| <50 |
23.9% |
23.1% |
24.9% |
| (Standard Error) |
(0.4%) |
(0.4%) |
(0.5%) |
| 50-99 |
23.3% |
22.6% |
22.6% |
| (Standard Error) |
(0.8%) |
(0.7%) |
(0.8%) |
| 100+ |
20.2% |
21.0% |
20.5% |
| (Standard Error) |
(0.2%) |
(0.2%) |
(0.2%) |
|
Source: Medical Expenditure Panel Survey-Insurance Component, private-sector establishments, 2016‑2018.
|
Return to Table of Contents
Exhibit 5.21 Percentage (standard error) of private-sector enrolled employees in a health insurance plan with a coinsurance payment for an office visit to a specialist physician, overall and by State, 2018
| Alabama |
28.5%* |
Kentucky |
38.2% |
North Dakota |
60.5%* |
| (Standard Error) |
(3.2%) |
(Standard Error) |
(3.3%) |
(Standard Error) |
(3.5%) |
| Alaska |
62.8%* |
Louisiana |
49.4%* |
Ohio |
47.1%* |
| (Standard Error) |
(4.4%) |
(Standard Error) |
(3.9%) |
(Standard Error) |
(3.3%) |
| Arizona |
39.5% |
Maine |
48.0%* |
Oklahoma |
38.6% |
| (Standard Error) |
(4.0%) |
(Standard Error) |
(3.6%) |
(Standard Error) |
(3.6%) |
| Arkansas |
43.9% |
Maryland |
33.1% |
Oregon |
40.2% |
| (Standard Error) |
(4.0%) |
(Standard Error) |
(3.3%) |
(Standard Error) |
(3.9%) |
| California |
33.2%* |
Massachusetts |
23.3%* |
Pennsylvania |
30.5%* |
| (Standard Error) |
(2.2%) |
(Standard Error) |
(2.8%) |
(Standard Error) |
(3.1%) |
| Colorado |
46.8%* |
Michigan |
35.7% |
Rhode Island |
26.9%* |
| (Standard Error) |
(3.4%) |
(Standard Error) |
(4.1%) |
(Standard Error) |
(3.2%) |
| Connecticut |
40.7% |
Minnesota |
55.8%* |
South Carolina |
38.4% |
| (Standard Error) |
(5.0%) |
(Standard Error) |
(3.1%) |
(Standard Error) |
(3.6%) |
| Delaware |
36.5% |
Mississippi |
39.9% |
South Dakota |
42.7% |
| (Standard Error) |
(3.5%) |
(Standard Error) |
(5.0%) |
(Standard Error) |
(3.4%) |
| District of Columbia |
17.0%* |
Missouri |
36.8% |
Tennessee |
48.1%* |
| (Standard Error) |
(2.0%) |
(Standard Error) |
(4.1%) |
(Standard Error) |
(3.7%) |
| Florida |
37.7% |
Montana |
53.0%* |
Texas |
40.3% |
| (Standard Error) |
(3.9%) |
(Standard Error) |
(3.7%) |
(Standard Error) |
(2.9%) |
| Georgia |
39.4% |
Nebraska |
41.7% |
Utah |
48.8% |
| (Standard Error) |
(3.5%) |
(Standard Error) |
(4.3%) |
(Standard Error) |
(5.5%) |
| Hawaii |
30.5%* |
Nevada |
29.0%* |
Vermont |
30.4%* |
| (Standard Error) |
(3.0%) |
(Standard Error) |
(2.9%) |
(Standard Error) |
(3.5%) |
| Idaho |
47.7%* |
New Hampshire |
47.0%* |
Virginia |
37.3% |
| (Standard Error) |
(3.8%) |
(Standard Error) |
(3.8%) |
(Standard Error) |
(3.9%) |
| Illinois |
36.8% |
New Jersey |
33.3% |
Washington |
58.2%* |
| (Standard Error) |
(3.7%) |
(Standard Error) |
(3.3%) |
(Standard Error) |
(3.8%) |
| Indiana |
31.2%* |
New Mexico |
34.9% |
West Virginia |
33.7% |
| (Standard Error) |
(3.3%) |
(Standard Error) |
(3.5%) |
(Standard Error) |
(3.6%) |
| Iowa |
41.6% |
New York |
31.6%* |
Wisconsin |
48.5%* |
| (Standard Error) |
(3.3%) |
(Standard Error) |
(2.7%) |
(Standard Error) |
(4.0%) |
| Kansas |
44.2% |
North Carolina |
40.1% |
Wyoming |
57.9%* |
| (Standard Error) |
(3.6%) |
(Standard Error) |
(3.3%) |
(Standard Error) |
(3.8%) |
|
Source: Medical Expenditure Panel Survey-Insurance Component, private-sector establishments, 2018.
Note: * Statistically different from the national average of 38.3 percent at p < 0.05.
Note that the standard error on the national estimate of 38.3 percent is 0.65.
|
Return to Table of Contents
Exhibit 5.22 Average coinsurance rate (in percentage) (standard error) for an office visit to a specialist per employee enrolled in a health insurance plan with a specialist physician coinsurance rate at private-sector establishments, overall and by State, 2018
| Alabama |
26.4%* |
Kentucky |
21.2% |
North Dakota |
18.8%* |
| (Standard Error) |
(1.4%) |
(Standard Error) |
(1.5%) |
(Standard Error) |
(0.8%) |
| Alaska |
20.1% |
Louisiana |
22.1% |
Ohio |
20.2% |
| (Standard Error) |
(0.6%) |
(Standard Error) |
(0.8%) |
(Standard Error) |
(0.6%) |
| Arizona |
21.0% |
Maine |
20.8% |
Oklahoma |
21.8% |
| (Standard Error) |
(0.6%) |
(Standard Error) |
(1.0%) |
(Standard Error) |
(0.8%) |
| Arkansas |
21.0% |
Maryland |
20.0% |
Oregon |
23.4% |
| (Standard Error) |
(0.8%) |
(Standard Error) |
(0.6%) |
(Standard Error) |
(2.5%) |
| California |
20.9% |
Massachusetts |
19.2% |
Pennsylvania |
20.5% |
| (Standard Error) |
(0.4%) |
(Standard Error) |
(1.1%) |
(Standard Error) |
(1.3%) |
| Colorado |
19.8%* |
Michigan |
21.8% |
Rhode Island |
19.8% |
| (Standard Error) |
(0.5%) |
(Standard Error) |
(0.8%) |
(Standard Error) |
(0.8%) |
| Connecticut |
20.3% |
Minnesota |
21.1% |
South Carolina |
23.7%* |
| (Standard Error) |
(0.7%) |
(Standard Error) |
(0.9%) |
(Standard Error) |
(1.1%) |
| Delaware |
20.8% |
Mississippi |
22.2% |
South Dakota |
23.0%* |
| (Standard Error) |
(0.8%) |
(Standard Error) |
(0.7%) |
(Standard Error) |
(0.9%) |
| District of Columbia |
17.4%* |
Missouri |
21.0% |
Tennessee |
24.1%* |
| (Standard Error) |
(0.8%) |
(Standard Error) |
(0.6%) |
(Standard Error) |
(0.9%) |
| Florida |
21.8% |
Montana |
23.7%* |
Texas |
20.4% |
| (Standard Error) |
(0.7%) |
(Standard Error) |
(0.9%) |
(Standard Error) |
(0.7%) |
| Georgia |
21.2% |
Nebraska |
20.9% |
Utah |
20.5% |
| (Standard Error) |
(0.5%) |
(Standard Error) |
(0.8%) |
(Standard Error) |
(0.4%) |
| Hawaii |
16.3%* |
Nevada |
22.6% |
Vermont |
25.0%* |
| (Standard Error) |
(0.9%) |
(Standard Error) |
(1.0%) |
(Standard Error) |
(1.3%) |
| Idaho |
22.1%* |
New Hampshire |
18.1%* |
Virginia |
21.8% |
| (Standard Error) |
(0.5%) |
(Standard Error) |
(0.8%) |
(Standard Error) |
(0.9%) |
| Illinois |
19.1%* |
New Jersey |
20.2% |
Washington |
19.1% |
| (Standard Error) |
(0.4%) |
(Standard Error) |
(0.7%) |
(Standard Error) |
(1.2%) |
| Indiana |
20.9% |
New Mexico |
19.9%* |
West Virginia |
21.2% |
| (Standard Error) |
(0.6%) |
(Standard Error) |
(0.5%) |
(Standard Error) |
(1.2%) |
| Iowa |
22.3% |
New York |
20.3% |
Wisconsin |
19.1%* |
| (Standard Error) |
(1.0%) |
(Standard Error) |
(0.7%) |
(Standard Error) |
(0.7%) |
| Kansas |
20.7% |
North Carolina |
24.4%* |
Wyoming |
23.0%* |
| (Standard Error) |
(0.7%) |
(Standard Error) |
(1.1%) |
(Standard Error) |
(0.6%) |
|
Source: Medical Expenditure Panel Survey-Insurance Component, private-sector establishments, 2018.
Note: * Statistically different from the national average of 21.0 percent at p < 0.05.
Note that the standard error on the national estimate of 21.0 percent is 0.16.
|
Return to Table of Contents
Exhibit 5.23 Among private-sector enrolled employees with single coverage, percentage (standard error) in a health insurance plan with an individual maximum out-of-pocket payment, overall and by firm size, 2005‑2018
| Number of Employees |
2005 |
2006 |
2008 |
2009 |
2010 |
2011 |
2012 |
2013 |
2014 |
2015 |
2016 |
2017 |
2018 |
| U.S. |
73.3% |
73.2% |
77.4% |
79.7% |
80.8% |
81.0% |
80.7% |
86.0% |
91.1% |
93.9% |
93.5% |
93.4% |
92.3% |
| (Standard Error) |
(0.5%) |
(0.6%) |
(0.5%) |
(0.6%) |
(0.5%) |
(0.5%) |
(0.3%) |
(0.5%) |
(0.4%) |
(0.3%) |
(0.4%) |
(0.3%) |
(0.3%) |
| <50 |
68.1% |
66.6% |
71.4% |
72.3% |
73.3% |
74.8% |
75.4% |
81.7% |
85.7% |
88.1% |
88.6% |
88.8% |
87.3% |
| (Standard Error) |
(0.6%) |
(1.1%) |
(0.8%) |
(0.8%) |
(0.7%) |
(1.1%) |
(0.4%) |
(0.7%) |
(0.8%) |
(0.7%) |
(0.7%) |
(0.7%) |
(0.7%) |
| 50-99 |
73.7% |
71.0% |
74.8% |
78.1% |
81.5% |
78.3% |
77.4% |
83.5% |
88.9% |
93.1% |
92.5% |
92.5% |
89.8% |
| (Standard Error) |
(1.6%) |
(2.2%) |
(1.4%) |
(1.6%) |
(2.5%) |
(1.8%) |
(2.6%) |
(0.8%) |
(1.3%) |
(1.2%) |
(1.4%) |
(1.2%) |
(1.4%) |
| 100+ |
75.0% |
75.6% |
79.6% |
82.1% |
83.0% |
83.1% |
82.6% |
87.6% |
92.7% |
95.5% |
94.7% |
94.6% |
93.7% |
| (Standard Error) |
(0.7%) |
(0.9%) |
(0.5%) |
(0.8%) |
(0.7%) |
(0.6%) |
(0.5%) |
(0.6%) |
(0.4%) |
(0.3%) |
(0.5%) |
(0.4%) |
(0.4%) |
|
Source: Medical Expenditure Panel Survey-Insurance Component, private-sector establishments, 2005‑2018.
Note: Medical Expenditure Panel Survey-Insurance Component estimates are not available for 2007.
|
Return to Table of Contents
Exhibit 5.24 Among private-sector enrolled employees with family coverage, percentage (standard error) in a health insurance plan with a family maximum out-of-pocket payment, overall and by firm size, 2005‑2018
| Number of Employees |
2005 |
2006 |
2008 |
2009 |
2010 |
2011 |
2012 |
2013 |
2014 |
2015 |
2016 |
2017 |
2018 |
| U.S. |
70.5% |
70.2% |
75.7% |
78.6% |
78.5% |
80.3% |
80.9% |
85.7% |
91.4% |
94.3% |
94.0% |
94.4% |
93.3% |
| (Standard Error) |
(0.8%) |
(0.6%) |
(0.7%) |
(0.9%) |
(0.8%) |
(0.5%) |
(0.5%) |
(0.9%) |
(0.5%) |
(0.4%) |
(0.4%) |
(0.4%) |
(0.4%) |
| <50 |
66.3% |
65.3% |
70.2% |
70.0% |
72.3% |
72.0% |
75.8% |
80.9% |
83.8% |
87.8% |
86.7% |
86.8% |
83.6% |
| (Standard Error) |
(1.1%) |
(1.4%) |
(0.9%) |
(1.3%) |
(0.8%) |
(0.6%) |
(1.4%) |
(1.2%) |
(1.3%) |
(1.1%) |
(1.1%) |
(1.0%) |
(1.3%) |
| 50-99 |
71.4% |
73.6% |
74.1% |
77.2% |
80.6% |
79.5% |
76.4% |
83.5% |
88.2% |
91.5% |
92.7% |
94.3% |
92.3% |
| (Standard Error) |
(2.6%) |
(2.4%) |
(1.6%) |
(2.5%) |
(2.0%) |
(1.6%) |
(2.7%) |
(1.9%) |
(1.8%) |
(1.5%) |
(1.4%) |
(1.2%) |
(1.6%) |
| 100+ |
71.3% |
71.0% |
76.9% |
80.4% |
79.6% |
81.8% |
82.1% |
86.7% |
92.9% |
95.4% |
95.3% |
95.6% |
94.8% |
| (Standard Error) |
(0.9%) |
(0.7%) |
(0.8%) |
(0.9%) |
(0.9%) |
(0.7%) |
(0.8%) |
(1.0%) |
(0.5%) |
(0.5%) |
(0.4%) |
(0.4%) |
(0.5%) |
|
Source: Medical Expenditure Panel Survey-Insurance Component, private-sector establishments, 2005‑2018.
Note: Medical Expenditure Panel Survey-Insurance Component estimates are not available for 2007.
|
Return to Table of Contents
Exhibit 5.25 Average individual maximum out-of-pocket payment (in dollars) (standard error) per employee enrolled with single coverage in a health insurance plan with an individual maximum out-of-pocket payment, overall and by firm size, 2005‑2018
| Number of Employees |
2005 |
2006 |
2008 |
2009 |
2010 |
2011 |
2012 |
2013 |
2014 |
2015 |
2016 |
2017 |
2018 |
| U.S. |
$2,274 |
$2,316 |
$2,466 |
$2,649 |
$2,939 |
$2,980 |
$3,099 |
$3,259 |
$3,575 |
$3,865 |
$4,099 |
$4,246 |
$4,416 |
| (Standard Error) |
($23) |
($17) |
($28) |
($29) |
($46) |
($18) |
($25) |
($17) |
($30) |
($24) |
($24) |
($21) |
($25) |
| <50 |
$2,407 |
$2,492 |
$2,601 |
$2,758 |
$3,177 |
$3,191 |
$3,321 |
$3,515 |
$3,787 |
$4,096 |
$4,420 |
$4,446 |
$4,730 |
| (Standard Error) |
($48) |
($44) |
($33) |
($26) |
($125) |
($43) |
($48) |
($38) |
($49) |
($52) |
($53) |
($47) |
($45) |
| 50-99 |
$2,332 |
$2,228 |
$2,675 |
$2,757 |
$2,952 |
$3,019 |
$3,263 |
$3,346 |
$3,885 |
$4,230 |
$4,463 |
$4,678 |
$4,813 |
| (Standard Error) |
($88) |
($74) |
($69) |
($47) |
($84) |
($92) |
($99) |
($71) |
($100) |
($96) |
($81) |
($87) |
($80) |
| 100+ |
$2,228 |
$2,275 |
$2,405 |
$2,608 |
$2,874 |
$2,920 |
$3,026 |
$3,182 |
$3,489 |
$3,774 |
$3,992 |
$4,158 |
$4,312 |
| (Standard Error) |
($27) |
($23) |
($36) |
($39) |
($68) |
($31) |
($29) |
($21) |
($37) |
($28) |
($28) |
($25) |
($30) |
|
Source: Medical Expenditure Panel Survey-Insurance Component, private-sector establishments, 2005‑2018.
Note: Medical Expenditure Panel Survey-Insurance Component estimates are not available for 2007.
|
Return to Table of Contents
Exhibit 5.26 Average family maximum out-of-pocket payment (in dollars) (standard error) per employee enrolled with family coverage in a health insurance plan with a family maximum out-of-pocket payment, overall and by firm size, 2005‑2018
| Number of Employees |
2005 |
2006 |
2008 |
2009 |
2010 |
2011 |
2012 |
2013 |
2014 |
2015 |
2016 |
2017 |
2018 |
| U.S. |
$4,745 |
$4,832 |
$5,156 |
$5,438 |
$5,854 |
$6,010 |
$6,356 |
$6,500 |
$7,114 |
$7,542 |
$7,881 |
$8,183 |
$8,375 |
| (Standard Error) |
($49) |
($47) |
($42) |
($67) |
($78) |
($54) |
($61) |
($40) |
($63) |
($60) |
($67) |
($65) |
($63) |
| <50 |
$5,000 |
$5,032 |
$5,594 |
$5,638 |
$6,209 |
$6,210 |
$6,671 |
$6,843 |
$7,488 |
$7,676 |
$8,330 |
$8,821 |
$9,025 |
| (Standard Error) |
($174) |
($121) |
($153) |
($67) |
($129) |
($102) |
($155) |
($140) |
($123) |
($135) |
($155) |
($136) |
($143) |
| 50-99 |
$4,959 |
$4,403 |
$5,207 |
$5,340 |
$6,015 |
$6,296 |
$6,299 |
$6,594 |
$7,228 |
$7,608 |
$8,393 |
$8,605 |
$9,219 |
| (Standard Error) |
($356) |
($249) |
($155) |
($159) |
($178) |
($234) |
($277) |
($281) |
($301) |
($239) |
($265) |
($246) |
($231) |
| 100+ |
$4,684 |
$4,823 |
$5,076 |
$5,410 |
$5,779 |
$5,961 |
$6,311 |
$6,440 |
$7,050 |
$7,519 |
$7,785 |
$8,066 |
$8,240 |
| (Standard Error) |
($49) |
($67) |
($41) |
($73) |
($97) |
($64) |
($65) |
($53) |
($72) |
($68) |
($76) |
($74) |
($72) |
|
Source: Medical Expenditure Panel Survey-Insurance Component, private-sector establishments, 2005‑2018.
Note: Medical Expenditure Panel Survey-Insurance Component estimates are not available for 2007.
|
Return to Table of Contents
Exhibit 5.27 Among private-sector enrolled employees with single coverage, percentage (standard error) in a high-deductible health insurance plan, overall and by firm size, 2005‑2018
| Number of Employees |
2005 |
2006 |
2008 |
2009 |
2010 |
2011 |
2012 |
2013 |
2014 |
2015 |
2016 |
2017 |
2018 |
| U.S. |
16.8% |
11.1% |
17.1% |
19.2% |
24.6% |
28.0% |
30.7% |
34.1% |
39.2% |
43.9% |
47.1% |
53.0% |
53.6% |
| (Standard Error) |
(0.6%) |
(0.3%) |
(0.4%) |
(0.6%) |
(0.7%) |
(0.4%) |
(0.4%) |
(0.6%) |
(0.6%) |
(0.6%) |
(0.6%) |
(0.6%) |
(0.6%) |
| <50 |
30.3% |
18.0% |
25.4% |
30.8% |
36.8% |
40.9% |
43.3% |
45.6% |
50.7% |
52.1% |
54.9% |
55.1% |
60.2% |
| (Standard Error) |
(1.2%) |
(0.6%) |
(0.6%) |
(1.0%) |
(0.8%) |
(0.7%) |
(1.1%) |
(1.2%) |
(1.1%) |
(1.1%) |
(1.1%) |
(1.1%) |
(1.0%) |
| 50-99 |
21.0% |
13.9% |
23.7% |
28.0% |
39.8% |
38.3% |
46.1% |
46.5% |
50.0% |
55.0% |
55.0% |
58.9% |
62.5% |
| (Standard Error) |
(2.5%) |
(1.8%) |
(1.7%) |
(1.8%) |
(2.2%) |
(1.9%) |
(1.9%) |
(2.1%) |
(2.1%) |
(2.3%) |
(2.0%) |
(2.0%) |
(2.0%) |
| 100+ |
11.9% |
8.6% |
13.6% |
14.7% |
19.3% |
23.1% |
25.5% |
29.4% |
35.0% |
40.5% |
44.5% |
51.8% |
51.2% |
| (Standard Error) |
(0.5%) |
(0.5%) |
(0.5%) |
(0.5%) |
(0.6%) |
(0.4%) |
(0.5%) |
(0.6%) |
(0.8%) |
(0.8%) |
(0.8%) |
(0.8%) |
(0.8%) |
|
Source: Medical Expenditure Panel Survey-Insurance Component, private-sector establishments, 2005‑2018.
Note: Medical Expenditure Panel Survey-Insurance Component estimates are not available for 2007. Single coverage plans are classified as "high deductible" if the individual deductible met or exceeded the Internal Revenue Service (IRS) threshold for a high-deductible plan in a given year. In 2018, the individual deductible threshold was $1,350. Note that plans must also meet other requirements to be considered a high-deductible plan by the IRS.
|
Return to Table of Contents
Exhibit 5.28 Among private-sector enrolled employees with family coverage, percentage (standard error) in a high-deductible health insurance plan, overall and by firm size, 2005‑2018
| Number of Employees |
2005 |
2006 |
2008 |
2009 |
2010 |
2011 |
2012 |
2013 |
2014 |
2015 |
2016 |
2017 |
2018 |
| U.S. |
12.3% |
11.5% |
17.1% |
19.3% |
23.7% |
28.8% |
30.3% |
33.9% |
39.4% |
41.9% |
44.4% |
51.9% |
50.7% |
| (Standard Error) |
(0.5%) |
(0.4%) |
(0.6%) |
(0.6%) |
(0.7%) |
(0.5%) |
(0.4%) |
(0.4%) |
(0.8%) |
(0.8%) |
(0.8%) |
(0.9%) |
(0.8%) |
| <50 |
25.1% |
18.6% |
28.5% |
32.7% |
37.5% |
42.7% |
44.3% |
50.6% |
51.9% |
52.7% |
49.8% |
55.2% |
56.6% |
| (Standard Error) |
(1.7%) |
(0.6%) |
(0.8%) |
(1.0%) |
(1.1%) |
(1.7%) |
(1.6%) |
(1.0%) |
(1.5%) |
(1.6%) |
(1.6%) |
(1.7%) |
(1.6%) |
| 50-99 |
16.6% |
14.3% |
21.8% |
25.0% |
37.7% |
47.1% |
48.8% |
47.1% |
46.6% |
47.2% |
54.6% |
53.7% |
60.0% |
| (Standard Error) |
(2.0%) |
(1.5%) |
(1.7%) |
(1.7%) |
(2.4%) |
(2.1%) |
(2.6%) |
(3.0%) |
(2.6%) |
(2.8%) |
(3.1%) |
(3.1%) |
(2.9%) |
| 100+ |
9.5% |
9.8% |
14.6% |
16.2% |
20.0% |
25.1% |
26.6% |
30.2% |
36.8% |
39.8% |
42.9% |
51.3% |
49.2% |
| (Standard Error) |
(0.5%) |
(0.6%) |
(0.7%) |
(0.8%) |
(0.7%) |
(0.6%) |
(0.5%) |
(0.5%) |
(0.9%) |
(0.9%) |
(1.0%) |
(1.1%) |
(0.9%) |
|
Source: Medical Expenditure Panel Survey-Insurance Component, private-sector establishments, 2005‑2018.
Note: Medical Expenditure Panel Survey-Insurance Component estimates are not available for 2007. Family coverage plans are classified as "high deductible" if the family deductible met or exceeded the Internal Revenue Service (IRS) threshold for a high-deductible plan in a given year. In 2018, the family deductible threshold was $2,700. Note that plans must also meet other requirements to be considered a high-deductible plan by the IRS.
|
Return to Table of Contents
Exhibit 5.29 Among private-sector enrolled employees with single coverage, percentage (standard error) in a non-high-deductible health insurance plan with exclusive providers, overall and by firm size, 2005‑2018
| Number of Employees |
2005 |
2006 |
2008 |
2009 |
2010 |
2011 |
2012 |
2013 |
2014 |
2015 |
2016 |
2017 |
2018 |
| U.S. |
22.9% |
23.7% |
21.2% |
19.9% |
17.1% |
18.8% |
17.6% |
16.7% |
15.9% |
14.8% |
15.6% |
13.5% |
13.1% |
| (Standard Error) |
(0.7%) |
(0.5%) |
(0.6%) |
(0.8%) |
(0.4%) |
(0.3%) |
(0.6%) |
(0.6%) |
(0.5%) |
(0.4%) |
(0.6%) |
(0.4%) |
(0.4%) |
| <50 |
25.2% |
27.4% |
25.2% |
23.5% |
21.1% |
20.2% |
20.1% |
19.6% |
18.3% |
18.0% |
17.7% |
18.3% |
15.4% |
| (Standard Error) |
(0.8%) |
(1.1%) |
(1.0%) |
(1.1%) |
(0.7%) |
(0.7%) |
(0.6%) |
(0.7%) |
(0.8%) |
(0.9%) |
(0.9%) |
(0.9%) |
(0.8%) |
| 50-99 |
27.7% |
26.1% |
26.1% |
24.0% |
22.0% |
20.7% |
19.4% |
18.7% |
20.2% |
12.9% |
18.9% |
18.0% |
15.2% |
| (Standard Error) |
(2.3%) |
(2.7%) |
(1.5%) |
(1.6%) |
(2.0%) |
(1.6%) |
(1.1%) |
(1.3%) |
(1.7%) |
(1.5%) |
(1.8%) |
(1.8%) |
(1.6%) |
| 100+ |
21.7% |
22.3% |
19.3% |
18.4% |
15.3% |
18.2% |
16.7% |
15.7% |
14.8% |
14.2% |
14.7% |
12.0% |
12.4% |
| (Standard Error) |
(0.8%) |
(0.6%) |
(0.7%) |
(0.9%) |
(0.6%) |
(0.4%) |
(0.8%) |
(0.7%) |
(0.6%) |
(0.5%) |
(0.7%) |
(0.5%) |
(0.5%) |
|
Source: Medical Expenditure Panel Survey-Insurance Component, private-sector establishments, 2005‑2018.
Note: Medical Expenditure Panel Survey-Insurance Component estimates are not available for 2007. In plans with "exclusive providers," enrollees must go to providers associated with the plan for all nonemergency care in order for the costs to be covered.
|
Return to Table of Contents
Exhibit 5.30 Among private-sector enrolled employees with single coverage, percentage (standard error) in a non-high-deductible health insurance plan with mixed providers and gatekeeper, overall and by firm size, 2005‑2018
| Number of Employees |
2005 |
2006 |
2008 |
2009 |
2010 |
2011 |
2012 |
2013 |
2014 |
2015 |
2016 |
2017 |
2018 |
| U.S. |
9.5% |
9.4% |
7.7% |
6.2% |
5.8% |
4.8% |
4.7% |
4.7% |
4.4% |
3.7% |
3.6% |
3.3% |
3.4% |
| (Standard Error) |
(0.4%) |
(0.4%) |
(0.4%) |
(0.3%) |
(0.2%) |
(0.2%) |
(0.3%) |
(0.4%) |
(0.3%) |
(0.3%) |
(0.2%) |
(0.2%) |
(0.2%) |
| <50 |
13.3% |
13.0% |
11.6% |
9.7% |
9.2% |
8.6% |
7.8% |
7.5% |
6.0% |
6.2% |
5.4% |
4.5% |
4.3% |
| (Standard Error) |
(0.6%) |
(0.7%) |
(0.7%) |
(0.6%) |
(0.6%) |
(0.5%) |
(0.5%) |
(0.6%) |
(0.5%) |
(0.6%) |
(0.5%) |
(0.4%) |
(0.4%) |
| 50-99 |
11.2% |
15.8% |
11.2% |
8.5% |
6.8% |
9.2% |
6.6% |
5.4% |
5.5% |
5.7% |
5.2% |
4.2% |
3.9% |
| (Standard Error) |
(1.7%) |
(1.8%) |
(1.2%) |
(1.5%) |
(0.6%) |
(1.1%) |
(0.8%) |
(0.6%) |
(1.0%) |
(1.1%) |
(0.9%) |
(0.7%) |
(0.8%) |
| 100+ |
8.0% |
7.6% |
6.1% |
4.9% |
4.7% |
3.1% |
3.6% |
3.8% |
3.9% |
2.9% |
3.0% |
3.0% |
3.1% |
| (Standard Error) |
(0.6%) |
(0.5%) |
(0.3%) |
(0.4%) |
(0.4%) |
(0.3%) |
(0.3%) |
(0.5%) |
(0.4%) |
(0.3%) |
(0.2%) |
(0.2%) |
(0.2%) |
|
Source: Medical Expenditure Panel Survey-Insurance Component, private-sector establishments, 2005‑2018.
Note: Medical Expenditure Panel Survey-Insurance Component estimates are not available for 2007. In plans with "mixed providers," enrollees may go to any provider, but there is a cost incentive to use a particular group of providers. Plans with gatekeepers require that enrollees see a gatekeeper or primary-care physician in order to be referred to a specialist.
|
Return to Table of Contents
Exhibit 5.31 Among private-sector enrolled employees with single coverage, percentage (standard error) in a non-high-deductible health insurance plan with mixed providers and no gatekeeper, overall and by firm size, 2005‑2018
| Number of Employees |
2005 |
2006 |
2008 |
2009 |
2010 |
2011 |
2012 |
2013 |
2014 |
2015 |
2016 |
2017 |
2018 |
| U.S. |
45.2% |
50.9% |
49.5% |
50.3% |
47.9% |
44.1% |
43.5% |
41.3% |
37.4% |
35.0% |
30.8% |
28.0% |
27.5% |
| (Standard Error) |
(0.5%) |
(0.5%) |
(0.6%) |
(0.6%) |
(0.7%) |
(0.5%) |
(0.6%) |
(0.4%) |
(0.7%) |
(0.6%) |
(0.6%) |
(0.6%) |
(0.6%) |
| <50 |
23.2% |
32.5% |
29.5% |
28.3% |
26.2% |
22.3% |
22.1% |
21.3% |
18.4% |
18.9% |
17.2% |
17.6% |
14.7% |
| (Standard Error) |
(1.1%) |
(1.2%) |
(0.5%) |
(0.9%) |
(0.7%) |
(0.7%) |
(1.1%) |
(0.9%) |
(0.8%) |
(0.9%) |
(0.8%) |
(0.9%) |
(0.8%) |
| 50-99 |
32.5% |
39.0% |
34.6% |
35.2% |
27.3% |
24.7% |
23.7% |
25.2% |
21.4% |
21.9% |
17.6% |
17.1% |
15.1% |
| (Standard Error) |
(2.8%) |
(3.2%) |
(1.2%) |
(1.5%) |
(1.2%) |
(2.0%) |
(1.5%) |
(1.6%) |
(1.8%) |
(2.0%) |
(1.5%) |
(1.4%) |
(1.5%) |
| 100+ |
53.9% |
58.1% |
57.7% |
58.7% |
56.6% |
52.8% |
51.7% |
48.9% |
44.2% |
40.4% |
35.3% |
31.6% |
31.6% |
| (Standard Error) |
(0.7%) |
(0.4%) |
(0.7%) |
(0.8%) |
(0.9%) |
(0.5%) |
(0.7%) |
(0.7%) |
(0.9%) |
(0.8%) |
(0.7%) |
(0.7%) |
(0.7%) |
|
Source: Medical Expenditure Panel Survey-Insurance Component, private-sector establishments, 2005‑2018.
Note: Medical Expenditure Panel Survey-Insurance Component estimates are not available for 2007. In plans with "mixed providers," enrollees may go to any provider, but there is a cost incentive to use a particular group of providers. Plans with gatekeepers require that enrollees see a gatekeeper or primary-care physician in order to be referred to a specialist.
|
Return to Table of Contents
Exhibit 5.32 Among private-sector enrolled employees with single coverage, percentage (standard error) in a non-high-deductible health insurance plan with any providers, overall and by firm size, 2005‑2018
| Number of Employees |
2005 |
2006 |
2008 |
2009 |
2010 |
2011 |
2012 |
2013 |
2014 |
2015 |
2016 |
2017 |
2018 |
| U.S. |
5.5% |
4.9% |
4.5% |
4.3% |
4.7% |
4.3% |
3.4% |
3.1% |
3.0% |
2.6% |
3.0% |
2.2% |
2.4% |
| (Standard Error) |
(0.4%) |
(0.2%) |
(0.2%) |
(0.3%) |
(0.5%) |
(0.2%) |
(0.2%) |
(0.1%) |
(0.2%) |
(0.2%) |
(0.3%) |
(0.2%) |
(0.2%) |
| <50 |
7.9% |
9.1% |
8.3% |
7.7% |
6.7% |
8.0% |
6.6% |
6.0% |
6.6% |
4.8% |
4.7% |
4.5% |
5.3% |
| (Standard Error) |
(0.6%) |
(0.5%) |
(0.5%) |
(0.5%) |
(0.5%) |
(0.5%) |
(0.3%) |
(0.5%) |
(0.5%) |
(0.4%) |
(0.4%) |
(0.5%) |
(0.5%) |
| 50-99 |
7.6% |
5.2% |
4.3% |
4.2% |
4.2% |
7.0% |
4.3% |
4.2% |
2.8% |
3.3% |
3.3% |
1.9% |
3.3% |
| (Standard Error) |
(2.1%) |
(0.7%) |
(0.7%) |
(0.7%) |
(0.5%) |
(1.1%) |
(0.7%) |
(0.4%) |
(0.6%) |
(0.7%) |
(0.6%) |
(0.4%) |
(0.7%) |
| 100+ |
4.5% |
3.5% |
3.3% |
3.3% |
4.1% |
2.9% |
2.4% |
2.2% |
2.1% |
2.0% |
2.5% |
1.6% |
1.7% |
| (Standard Error) |
(0.3%) |
(0.2%) |
(0.3%) |
(0.3%) |
(0.7%) |
(0.2%) |
(0.2%) |
(0.2%) |
(0.2%) |
(0.2%) |
(0.4%) |
(0.2%) |
(0.2%) |
|
Source: Medical Expenditure Panel Survey-Insurance Component, private-sector establishments, 2005‑2018.
Note: Medical Expenditure Panel Survey-Insurance Component estimates are not available for 2007. In plans with "any providers," enrollees may go to providers of their choice with no cost incentives to use a particular group of providers.
|
Return to Table of Contents
Exhibit 5.33 Among private-sector enrolled employees with family coverage, percentage (standard error) in a non-high-deductible health insurance plan with exclusive providers, overall and by firm size, 2005‑2018
| Number of Employees |
2005 |
2006 |
2008 |
2009 |
2010 |
2011 |
2012 |
2013 |
2014 |
2015 |
2016 |
2017 |
2018 |
| U.S. |
21.1% |
21.6% |
18.6% |
17.4% |
16.4% |
17.2% |
15.6% |
14.9% |
13.3% |
13.6% |
13.3% |
11.3% |
12.0% |
| (Standard Error) |
(0.7%) |
(0.5%) |
(0.6%) |
(0.6%) |
(0.8%) |
(0.5%) |
(0.6%) |
(0.7%) |
(0.5%) |
(0.6%) |
(0.7%) |
(0.5%) |
(0.5%) |
| <50 |
23.8% |
25.2% |
21.0% |
18.7% |
19.4% |
18.7% |
18.2% |
14.6% |
14.8% |
14.9% |
15.7% |
14.8% |
16.0% |
| (Standard Error) |
(0.9%) |
(1.3%) |
(0.7%) |
(0.8%) |
(0.8%) |
(1.2%) |
(1.5%) |
(0.7%) |
(1.0%) |
(1.1%) |
(1.2%) |
(1.2%) |
(1.2%) |
| 50-99 |
23.4% |
23.2% |
22.5% |
24.7% |
22.1% |
14.9% |
16.2% |
16.6% |
13.3% |
13.4% |
12.8% |
15.9% |
20.1% |
| (Standard Error) |
(1.8%) |
(2.5%) |
(1.7%) |
(1.9%) |
(2.1%) |
(1.9%) |
(1.6%) |
(2.7%) |
(1.6%) |
(1.9%) |
(1.7%) |
(2.3%) |
(2.7%) |
| 100+ |
20.5% |
20.7% |
17.8% |
16.6% |
15.4% |
17.2% |
15.1% |
14.8% |
13.0% |
13.4% |
12.9% |
10.5% |
10.9% |
| (Standard Error) |
(1.0%) |
(0.6%) |
(0.6%) |
(0.7%) |
(1.0%) |
(0.6%) |
(0.6%) |
(0.8%) |
(0.6%) |
(0.7%) |
(0.8%) |
(0.5%) |
(0.6%) |
|
Source: Medical Expenditure Panel Survey-Insurance Component, private-sector establishments, 2005‑2018.
Note: Medical Expenditure Panel Survey-Insurance Component estimates are not available for 2007. In plans with "exclusive providers," enrollees must go to providers associated with the plan for all nonemergency care in order for the costs to be covered.
|
Return to Table of Contents
Exhibit 5.34 Among private-sector enrolled employees with family coverage, percentage (standard error) in a non-high-deductible health insurance plan with mixed providers and gatekeeper, overall and by firm size, 2005‑2018
| Number of Employees |
2005 |
2006 |
2008 |
2009 |
2010 |
2011 |
2012 |
2013 |
2014 |
2015 |
2016 |
2017 |
2018 |
| U.S. |
9.4% |
9.0% |
6.9% |
6.9% |
5.1% |
3.9% |
3.9% |
4.0% |
3.7% |
3.4% |
3.0% |
2.6% |
2.9% |
| (Standard Error) |
(0.5%) |
(0.6%) |
(0.4%) |
(0.6%) |
(0.4%) |
(0.2%) |
(0.3%) |
(0.5%) |
(0.3%) |
(0.4%) |
(0.2%) |
(0.2%) |
(0.2%) |
| <50 |
14.5% |
13.4% |
11.2% |
10.7% |
7.8% |
8.0% |
8.2% |
7.6% |
6.7% |
5.2% |
5.3% |
4.5% |
5.0% |
| (Standard Error) |
(1.1%) |
(0.6%) |
(0.8%) |
(0.9%) |
(0.4%) |
(1.0%) |
(0.6%) |
(0.8%) |
(1.0%) |
(0.6%) |
(0.6%) |
(0.8%) |
(0.7%) |
| 50-99 |
14.1% |
15.0% |
11.9% |
7.2% |
7.4% |
6.1% |
3.8% |
5.5% |
3.7% |
5.4% |
5.4% |
3.8% |
3.0% |
| (Standard Error) |
(1.7%) |
(2.5%) |
(1.6%) |
(1.0%) |
(1.0%) |
(0.9%) |
(1.0%) |
(1.1%) |
(0.9%) |
(1.2%) |
(1.2%) |
(1.0%) |
(0.5%) |
| 100+ |
8.1% |
7.7% |
5.7% |
6.2% |
4.4% |
3.0% |
3.2% |
3.3% |
3.2% |
3.0% |
2.5% |
2.2% |
2.6% |
| (Standard Error) |
(0.5%) |
(0.6%) |
(0.4%) |
(0.7%) |
(0.5%) |
(0.2%) |
(0.3%) |
(0.5%) |
(0.3%) |
(0.4%) |
(0.2%) |
(0.2%) |
(0.2%) |
|
Source: Medical Expenditure Panel Survey-Insurance Component, private-sector establishments, 2005‑2018.
Note: Medical Expenditure Panel Survey-Insurance Component estimates are not available for 2007. In plans with "mixed providers," enrollees may go to any provider, but there is a cost incentive to use a particular group of providers. Plans with gatekeepers require that enrollees see a gatekeeper or primary-care physician in order to be referred to a specialist.
|
Return to Table of Contents
Exhibit 5.35 Among private-sector enrolled employees with family coverage, percentage (standard error) in a non-high-deductible health insurance plan with mixed providers and no gatekeeper, overall and by firm size, 2005‑2018
| Number of Employees |
2005 |
2006 |
2008 |
2009 |
2010 |
2011 |
2012 |
2013 |
2014 |
2015 |
2016 |
2017 |
2018 |
| U.S. |
51.6% |
53.4% |
53.6% |
52.8% |
50.5% |
46.9% |
47.6% |
44.5% |
41.0% |
38.6% |
36.6% |
32.2% |
32.3% |
| (Standard Error) |
(1.0%) |
(0.6%) |
(0.8%) |
(0.5%) |
(0.9%) |
(0.5%) |
(0.5%) |
(0.7%) |
(0.8%) |
(0.9%) |
(0.9%) |
(0.9%) |
(0.8%) |
| <50 |
27.7% |
34.2% |
30.4% |
29.3% |
27.3% |
23.1% |
23.8% |
21.1% |
20.8% |
23.1% |
22.5% |
20.7% |
17.4% |
| (Standard Error) |
(0.6%) |
(1.9%) |
(0.9%) |
(1.0%) |
(0.5%) |
(1.6%) |
(1.0%) |
(1.1%) |
(1.3%) |
(1.5%) |
(1.5%) |
(1.6%) |
(1.3%) |
| 50-99 |
37.3% |
41.2% |
39.2% |
38.9% |
27.2% |
26.1% |
27.4% |
27.3% |
32.0% |
27.8% |
23.8% |
24.2% |
14.5% |
| (Standard Error) |
(3.2%) |
(2.9%) |
(1.4%) |
(2.9%) |
(1.7%) |
(1.8%) |
(3.2%) |
(1.5%) |
(2.7%) |
(2.8%) |
(3.2%) |
(2.9%) |
(1.9%) |
| 100+ |
57.3% |
58.3% |
59.0% |
58.6% |
56.9% |
52.5% |
53.0% |
49.6% |
45.1% |
41.6% |
39.7% |
34.5% |
35.6% |
| (Standard Error) |
(1.3%) |
(0.8%) |
(0.9%) |
(0.7%) |
(1.0%) |
(0.6%) |
(0.7%) |
(0.8%) |
(1.0%) |
(1.0%) |
(1.0%) |
(1.1%) |
(0.9%) |
|
Source: Medical Expenditure Panel Survey-Insurance Component, private-sector establishments, 2005‑2018.
Note: Medical Expenditure Panel Survey-Insurance Component estimates are not available for 2007. In plans with "mixed providers," enrollees may go to any provider, but there is a cost incentive to use a particular group of providers. Plans with gatekeepers require that enrollees see a gatekeeper or primary-care physician in order to be referred to a specialist.
|
Return to Table of Contents
Exhibit 5.36 Among private-sector enrolled employees with family coverage, percentage (standard error) in a non-high-deductible health insurance plan with any providers, overall and by firm size, 2005‑2018
| Number of Employees |
2005 |
2006 |
2008 |
2009 |
2010 |
2011 |
2012 |
2013 |
2014 |
2015 |
2016 |
2017 |
2018 |
| U.S. |
5.4% |
4.5% |
3.8% |
3.5% |
4.3% |
3.1% |
2.6% |
2.8% |
2.6% |
2.5% |
2.7% |
2.0% |
2.2% |
| (Standard Error) |
(0.3%) |
(0.2%) |
(0.2%) |
(0.3%) |
(0.3%) |
(0.2%) |
(0.2%) |
(0.2%) |
(0.2%) |
(0.3%) |
(0.2%) |
(0.2%) |
(0.2%) |
| <50 |
8.9% |
8.6% |
8.8% |
8.6% |
8.1% |
7.5% |
5.4% |
6.1% |
5.8% |
4.0% |
6.7% |
4.7% |
4.9% |
| (Standard Error) |
(0.8%) |
(0.4%) |
(0.5%) |
(0.6%) |
(0.5%) |
(0.8%) |
(0.5%) |
(0.7%) |
(0.6%) |
(0.5%) |
(0.9%) |
(0.6%) |
(0.6%) |
| 50-99 |
8.5% |
6.3% |
4.6% |
4.2% |
5.6% |
5.8% |
3.7% |
3.5% |
4.3% |
4.7% |
3.4% |
2.5% |
2.5% |
| (Standard Error) |
(1.8%) |
(1.4%) |
(0.9%) |
(0.7%) |
(1.1%) |
(1.4%) |
(1.0%) |
(0.8%) |
(1.0%) |
(1.2%) |
(0.9%) |
(0.7%) |
(0.6%) |
| 100+ |
4.6% |
3.6% |
2.8% |
2.5% |
3.4% |
2.2% |
2.1% |
2.1% |
1.9% |
2.2% |
2.0% |
1.5% |
1.7% |
| (Standard Error) |
(0.2%) |
(0.3%) |
(0.2%) |
(0.3%) |
(0.4%) |
(0.1%) |
(0.2%) |
(0.2%) |
(0.3%) |
(0.3%) |
(0.3%) |
(0.2%) |
(0.2%) |
|
Source: Medical Expenditure Panel Survey-Insurance Component, private-sector establishments, 2005‑2018.
Note: Medical Expenditure Panel Survey-Insurance Component estimates are not available for 2007. In plans with "any providers," enrollees may go to providers of their choice with no cost incentives to use a particular group of providers.
|
Return to Table of Contents
|