|
|
|
Font Size:
|
||||
|
|
|
|
||||
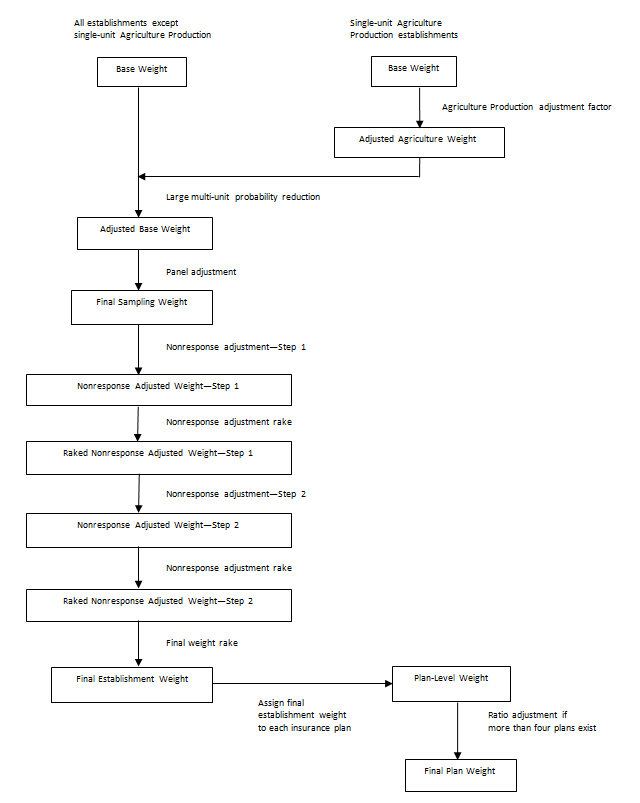
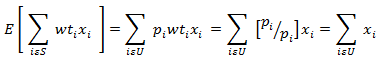
* Weighting groups for the nonresponse adjustments (Appendix B). Source: Center for Financing, Access, and Cost Trends, Agency for Healthcare Research and Quality, Medical Expenditure Panel Survey Insurance Component, 2011 The sample units for the private sector sample are individual establishments within firms (companies). Because these establishments are selected with unequal probabilities, sampling weights are required to produce unbiased estimates from the survey data. Thus, if pi is the probability of selection of the ith unit in the sample and wti = 1/pi is the initial weight then
where S is the set of sampled units and U is the set of units in the universe. An unbiased estimate of a total from the sample can be found by calculating the weighted sum from the sample. However, because there is survey nonresponse, the sampling weights of the responding units are adjusted by the sampling weights of similar nonresponding units (Kish, 1965). After nonresponse adjustments, the establishment weights are raked. The objective of raking is to have the sum of the new adjusted weights of the respondents within cells based on specified characteristics equal to the totals from the original sample or some other set of known population control totals. The weight adjustment procedures used for the MEPS-IC will be described in detail in the following sections. The initial survey weight for each unit is the inverse of the probability of selection of that unit into the survey sample. As stated earlier, the weight, wti is then
where pi is the probability of selection for unit i. The development of the probabilities of selection is described in the MEPS Methodology Report: Sample Design of the 2011 Medical Expenditure Panel Survey Insurance Component, (Davis, 2013). Because of their significant size, establishments with more than 5,000 employees are selected with certainty. Also, due to their size and complex structure, some railroad establishments are selected as certainties. These certainty establishments are self-representing and receive a base weight of 1.000. Single-unit Agriculture Production Establishment weight adjustment Because the single-unit Agriculture Production Establishments are incomplete on the Business Register when the private sector frame is developed, these establishments are edited and imputed before the private sector sample is drawn. The multi-unit Agriculture Production Establishments do not need any edits and imputation because their data have been processed before being placed on the Business Register. The sample weights of the single-unit Agriculture Production Establishments have an additional step performed to calculate the final sample weights, wti (AG), where
The AG factor is an adjustment for the number of Agricultural Production administrative data records that are not yet available to the Census Bureau when the survey frame is created. Because of these missing records, the weights of the Agricultural Production Establishments are artificially low. The factor is calculated by dividing the current year total number of Agriculture Production records received to date by the prior year total number of Agriculture Production records received as found on the U.S. Census Business Register. For 2011 the AG factor was 0.6460. To reduce reporting burden for the largest multi-unit firms, a variable cap-limiting target is implemented to reduce the number of establishments sampled from these larger firms. Establishments of the same firm tend to have similar characteristics and have similar health plan offerings. The establishment base weight for all sampled establishments is adjusted based on the expected number of establishments sampled from their firm to obtain the final establishment sampling weight. The expected number of establishments from any particular firm E[ESTBj] is calculated by
where pi is the initial probability of selection of establishment i in firm j and
where ns is the sample allocation for stratum s and Ns is the total number of establishments in stratum s. The sampling strata are defined by a combination of 14 establishment and firm sizes within each state. The expected number of establishments from a firm is used to calculate an adjustment factor, ME, that is used to develop an adjusted probability of selection for each establishment. In essence, this process will reduce the number of sampled establishments that are part of large multi-unit firms and reallocate the sample to increase the number of establishments from single-unit firms and smaller multi-unit firms. The adjustment factor calculation is
The adjusted probability of selection,
The final selection probability for each establishment, finalpi, is either If ME = 1 then finalpi is the lesser of:
or
If ME < 1 then:
where Fs is a stratum factor based on the difference between the allocated and the expected number of establishments, ds, that will be selected into the sample from the stratum such that
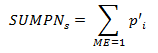
and
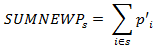
and
SUMNEWPS is the summation of the adjusted probabilities of selection within strata:
Just prior to drawing the sample, to further reduce burden on establishments, the frame is divided into four nationally representative panels of which two are utilized each year. The two selected panels include one new panel and one panel that had been utilized the previous survey year. The use of panels makes it less likely that establishments will be selected into multiple consecutive samples. In the two selected panels, the final sampling weight for each non-certainty establishment is
For each certainty establishment and each certainty railroad establishment, the final sampling weight is
Appendix B contains a general description of the MEPS-IC two step nonresponse adjustment process. It shows the classification of all sample members into six groups (three types of respondents, two types of nonrespondents and an out-of-scope group). In addition, it provides a high-level view of the redistribution processes of the nonrespondent weights to the appropriate responding groups during the nonresponse weighting adjustment process. A more detailed discussion of the nonresponse adjustments follows in this section. All figures for 2011 provided in this section can be found in table 1. The initial contact attempt for the survey is by telephone in the prescreening process. One of the primary objectives of the telephone prescreener is to determine if the establishment offers insurance to its employees. For the private sector, 29,633 out of 39,351 establishments (75.3 percent) completed the prescreener. If insurance is not offered, the establishment is considered a respondent and no further contact is made with the establishment after the prescreening process (Group 1, n = 7,321 establishments). If insurance is offered, the establishment is mailed a survey questionnaire. If the establishment responds to the survey questionnaire (initially or on follow-up), the establishment is considered a respondent (Group 2, n = 22,312 establishments). However, if the prescreener indicates an establishment offers insurance but no further survey information is obtained (or not enough partial information is obtained), then the establishment is a nonrespondent to the survey (Group 3, n = 3,369 establishments). The first step of the nonresponse weight adjustment involves Groups 2 and 3. The weights of the establishments who offered insurance in the prescreener and responded to the survey (Group 2) are adjusted so their total weight equals the weight of all respondents to the prescreener that offered insurance for a specific set of cells, whether they responded to the survey or not. At the conclusion of this process, weights for the 3,369 Group 3 nonresponding establishments are redistributed to the responding 22,312 establishments in Group 2. Thus, those establishments in Group 2 will have their base weights systematically inflated. The adjustment cells for this nonresponse adjustment procedure are a cross of an eight-level size measure based on firm sizes and establishment sizes (see Appendix C), industry, type of firm (single-unit or multi-unit), and State (including the District of Columbia). However, before these adjustment cells are utilized some establishments have their size class adjusted in the Reclassification of Employment Size process described next. For a small proportion of cases where the survey reported size differs greatly from the establishment size on the frame, the establishment size class used for raking is adjusted to reflect the survey response. Without reclassification these cases would have a significant net disproportionate effect during the raking process. Thus, to temper their impact, these establishments are reclassified according to their survey reported size rather than their frame size. In the past, the establishment size class adjustment process was the same for single-unit and multi-unit establishments. However, after the survey data collection was changed from prior year to current year data in 2008, research showed the need to expand the adjustment bounds for multi-unit establishments.
The rules for the adjustment of establishment size classes for single-units are as follows. If the boundary is exceeded then the frame employment size (F EMP) is replaced by the survey response employment size (S EMP) and the size class of the establishment is adjusted accordingly.
The rules for the adjustment of size classes for establishments that are part of multi-unit firms are as follows. If the boundary is exceeded then the frame employment size (F EMP) is replaced by the survey response employment size (S EMP) and the size class of the establishment is adjusted accordingly.
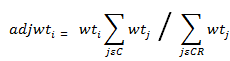
If the size class was adjusted for an establishment then the firm employment associated with that establishment may need to be adjusted to maintain continuity (i.e., the establishment employment size class should not be larger than the firm employment size class). Thus, for single-units, the firm employment from the frame will be replaced by the establishment employment from the survey response. For multi-units, firm employment sizes are reconciled through a series of edits that compare employment size information from the frame to the establishment, and firm employment sizes reported by the respondents. After the application of the establishment size class adjustments and the firm size class adjustments, a new value is created for the collapsed firm size and establishment size class variable (Appendix C) if necessary. In the 2011 survey, 0.9 percent of the in-scope establishments changed establishment size classes. Generally, nonresponse adjustment procedures are based on the adjusted firm and establishment sizes and size classes, with the adjusted weights for respondents defined as follows:
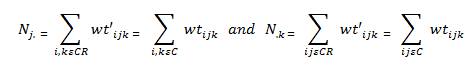
where wti is the ith units initial weight and wtj is the weight of each unit in response cell C or the weight of each responding unit in response cell C (denoted by CR). The adjusted weights for the nonrespondents are set to zero. This is done for all cells C and CR defined by the cross of all the important variables. However, because crossing these variables creates a large number of adjustment cells, an iterative technique known as raking (Madow, Olkin, and Rubin, 1983) is used to create an adjustment that retained the sum of the weights for as many cells as possible. In the raking process, the sums of the respondent weights for all cells defined by any one of the raking variables alone were made to sum to the totals for respondents and nonrespondents in the cell. When describing raking, assume wtijk is the sampling weight for the ith sample unit in the jkth cell. One would adjust the weights to create a set of weights wt´ijk such that
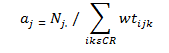
To do this, one first creates values aj such that
Then wt´ijk = aj x wtijk for all cases where the ijkth case is a respondent. Otherwise, the adjusted weight is 0. One continues this process through all values of j. This makes the respondents weights sum to the proper values for the first raking variable, but not the next. One then operates on the values of wt´ijk to adjust them so that the cells defined by the second raking variable are equal. However, this third set of weights may not sum properly for cells defined by the first variable. The cycle is repeatedreadjusting each new set of weights while iterating through the process. Usually the weights will converge within several cycles such that for each cell defined by any of the raking variables, the sum of the latest set of weights is a value very close to the required marginal total. This completes the raking process. The process can be applied to make weights sum to marginal cell totals for as many raking variables as one likes. For the MEPS-IC the nonresponse adjustment raking dimensions are: 1) nine industry groups, 2) multi-unit/single unit status, and 3) 51 States by eight size classes. The weights are adjusted for seven iterations of these three raking dimensions so the final dimension applied to the data is the State by size dimension. Nonresponse weight adjustmentStep 2 The process described here is Step 2 in the outline of the MEPS-IC nonresponse adjustment process located in Appendix B. In this step the weights from the other nonrespondent group (Group 5, n = 3,984 establishments), those with no response via prescreener, mail, Web or telephone and thus have an unknown insurance status, have their weights redistributed to the responding establishments (those in Groups 1, new Group 2, and 4; n = 7,321 + 22,312 + 2,365 = 31,998 establishments). The total sampling weight of the establishments in Group 5 is redistributed to the responding establishments using the raking methodology described above. The raking dimensions are the same as those used after the first nonresponse adjustment. At the conclusion of this process only responding establishments (Group 1, new Group 2, and Group 4) will have a positive weight. Following the two nonresponse adjustment steps the weights are further adjusted through a final raking process based on characteristics from the subsequent-years sampling frame. Because the Business Register is the source of official Census Bureau figures on the number and employment sizes of establishments in the United States, it is important that data from the MEPS-IC on employment by selected characteristics match those from the Business Register. Therefore, for the 2011 survey, control totals are obtained from the March 2012 snapshot of the Business Register which provides the first opportunity to obtain comprehensive employment figures for 2011. Starting in 2008 suspected single-unit deaths are modeled and removed from the frame before the calculation of the control totals. Before 2008, when the retrospective survey design was in place (survey questions asked about prior year information instead of current year information), single-unit deaths were identified and removed from the frame before the sampling procedure. However, due to the switch to the current year design, the single-unit business death information was no longer available. In addition, an adjustment was necessary to account for the unusually large number of business deaths during the economic downturn that began at the end of 2007. Thus, the Death Model was developed, based on data from the prior two years of the survey, to predict the single-unit deaths in the current year. The model is flexible enough to be able to reflect the current economic conditions. These modeled deaths are then removed from the final weight raking process but are not removed from the 2012 frame because they are not actual deaths. This effectively adjusts the control totals used during the final weight raking process for the estimated business deaths. The final weight raking dimensions are: 1) 51 States by eight size classes, 2) multi-unit/single unit status, and 3) nine industry groups. The weights are adjusted for seven and two-thirds iterations of these three raking dimensions so the final dimension applied to the data is the multi-unit/single unit status dimension. The employment size used in this raking process is the frame size, not the reported size, except for those establishments that changed size class in the Reclassification of Employment Size process described earlier. At the conclusion of this process, the sample weights have been corrected such that the weighted sample employment is similar to the Business Register employment minus the projected deaths within each raking cell and the sum of all the weights equals the total number of establishments on the frame minus the projected deaths. Establishments are asked to provide names and information on insurance plans they offer to their employees. If the establishment offers four or fewer plans, information is collected on all of the plans and each plan receives the same weight as the final raked weight of the establishment. However, if the establishment offers more than four plans, information is collected on the three plans with the largest enrollment as well as one additional plan. The three plans with the largest enrollment receive the same weight as the final raked weight of the establishment. The fourth plan receives the final raked establishment weight multiplied by a ratio so that it is proportional to the enrollment size of the plans within that establishment that are not one of the three largest plans. Estimates based on data that are collected at the plan level such as premiums, employee contributions, and deductibles are derived from plan weights that are inflated by the number of enrollees in those plans. U.S. STATE AND LOCAL GOVERNMENTS The government weights are developed through a process similar to that of the private sector weights. Figure 2 provides an overview of this process and is followed by a more detailed explanation of the steps involved. Figure 2. MEPS-IC governments weighting flowchart 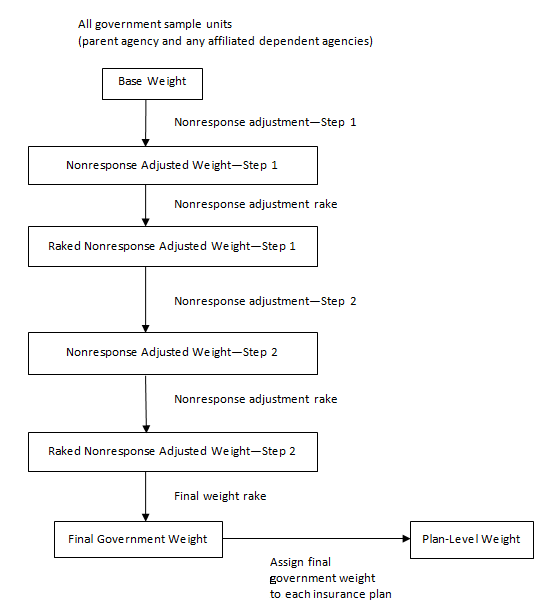 The governments sample is selected from a frame based on the most recent Census of Governments conducted by the U.S. Census Bureau. The Census of Governments is fielded every five years and is updated annually. Consequently, the 2007 Census of Governments was the source of the frame for 2011 MEPS-IC. A government consists of a parent agency and all of the dependent agencies associated with that parent agency. Note that a parent agency may not have any dependent agencies. A hypothetical example of the relationship between a parent agency and its dependent agencies would be a state government that has a headquarters location (parent agency) with a health department (dependent agency) and a commerce department (dependent agency) that report directly to the state government. The Federal Government is not included in the MEPS-IC because all of its relevant information is available from the Office of Personnel Management (OPM). The governments covered by the MEPS-IC are divided into three types (Appendix C): state governments (including the District of Columbia), local certainty governments (5,000 or more employees), and local non-certainty governments (less than 5,000 employees). A small sample of governments with missing frame employment is selected as well. The sampling unit for governments is at the parent agency-level. However, all dependent agencies of the selected governments are included in the sample. Thus, the size of each government sample unit is determined by the employment in the parent agency in addition to the employment in any dependent agencies of that parent agency. However, data are collected from governments at the field unit-level, where a parent agency and each dependent agency are separate field units. Table 2 shows the breakdown of parent agencies and dependent agencies for the 2011 MEPS-IC government sample. Thus, for 2011, there are 2,160 sample units and 3,128 field units.
Source: Center for Financing, Access, and Cost Trends, Agency for Healthcare Research and Quality, Medical Expenditure Panel Survey Insurance Component, 2011 When selected to participate in the survey, all non-certainty governments are prescreened. State and very large local governments (those with 5,000 or more employees) are not prescreened because they are selected into the survey every yeartherefore a rapport has already been developed and the point of contact has already been established from previous surveys. In addition, it is already known if they offer insurance to their employees based on their earlier responses. The prescreening process is the same process used for the private sector sample; each non-certainty government is contacted by telephone, if possible, as part of a prescreening operation to determine a point of contact for data collection and to determine whether the government offered insurance to its employees. During the prescreener, if the government did not offer insurance, a short questionnaire was administered and the government was classified as a respondent. Governments that offered insurance were administered a short questionnaire and were then mailed the full survey questionnaire. If no contact was made with the government during the telephone prescreener a survey questionnaire was mailed. The mailed survey questionnaire collects detailed information about the government including the number of employees, the number of employees eligible for insurance, the number of employees enrolled with insurance, and the types of insurance plans offered to the employees. The governments are offered the choice of responding to the questionnaire by either completing the paper form or completing the survey electronically using the Internet. If the government does not respond to the mailed questionnaire or fails to provide a Web response an attempt is made to administer an abbreviated version of the survey by telephone. Table 3 shows the response status and the weighting group classifications for the 2011 government sample. The weighting groups are used to describe types of respondents and nonrespondents in the nonresponse adjustments (Appendix B). The response rate for the 2011 Governments sample was 94.1 percent. Governments that are out of scope are those that have ceased to function or had no employees (e.g. volunteers, appointees with no salary, or board members with salaries paid from other sources). To be a respondent, a government has to answer a specific subset of key questions or indicate in the telephone prescreener that they did not offer insurance to their employees. Note that governments who did not complete the prescreener may still be considered respondents if they answer the mailed survey questionnaire, provide an adequate Web response, or respond to the telephone follow-up. Nonrespondents are those governments who indicated in the prescreener that they offered insurance but did not complete the survey questionnaire (by mail, Web, or telephone follow-up) as well as those governments whose insurance status was unknown due to an incomplete prescreener.
* Weighting groups for the nonresponse adjustments (Appendix B). Source: Center for Financing, Access, and Cost Trends, Agency for Healthcare Research and Quality, Medical Expenditure Panel Survey Insurance Component, 2011 Government Agency and Insurance
Plan Weights The assignment of weights to the government sample units and their plan records is very similar to the assignment of weights to establishments and their plan records. Once again, the government sample unit is the parent agency along with all of the dependent agencies (if any) associated with that parent agency. Because dependent agencies are not subsampled, they receive the same weight as the corresponding parent agency. The data for governments are collected using the same methods as for the private sector. A telephone prescreener is followed by a mail or telephone follow-up survey if insurance is offered. The same two nonresponse adjustments are performed (Appendix B) followed by a final weight raking to the frame employment within specified cells. The variables used when performing the final weight raking of the governments sample respondents to employment size control totals during the two nonresponse adjustments are 51 States (including the District of Columbia) and five government size groups (Appendix C). During the final weight raking process, state governments are handled differently than the local governments. The state governments and the District of Columbia (Government Size Group 1, Appendix C) are classified geographically by their state category. The local governments (Government Size Groups 25) are classified geographically using the nine Census Divisions. The employment control totals for each cell are produced by the current year (2011) Annual Public Employment Survey that is fielded by the U.S. Census Bureau. What differs from the private sector weight adjustment is the classification of the sample governments into response and nonresponse groups (Appendix B). While the definitions of the six response/nonresponse groups are the same as for the private sector, classifying the sampled governments into the groups has its own set of rules because the parent agency and the dependent agencies may have different response outcomes. Below are the rules for classifying a government sample unit (the parent agency and all associated dependent agencies). Responding government classification 1. For each responding government (i.e., any part is in Group 1, 2, or 4), if at least one part of the government is in Group 2, then classify the entire government as Group 2. 2. For responding governments not classified as Group 2 (i.e., any part is in Group 1 or 4) but has at least one part in Group 1, classify the entire government as Group 1. 3. For any remaining responding government not classified as Group 1 or Group 2, classify the entire government as Group 4. Nonresponding government
classification 1. For any nonresponding government (i.e., if each part of the government is in Group 3 or Group 5) and there is at least one part in Group 3, classify the entire government as Group 3. 2. For any remaining nonresponding governments not classified in Group 3, classify the entire government as Group 5. Once the government sample units (parent agency and all associated dependent agencies) are all classified properly together, the sample weights are then subjected to the two nonresponse adjustment procedures and the final weight raking procedure. Data for nonresponding agencies that are classified as part of a responding government are imputed for estimation purposes. Insurance plan weight
assignment In the governments survey, information about every insurance plan offered is collected. This differs from the private sector where information from at most four plans is collected. Information about all plans offered by governments can be obtained because brochures for the plans are readily available and are provided during data collection. The requisite information about the plans is then abstracted from these brochures. Thus, there is not a disparate burden on governments to provide data for all of their offered plans. Because all insurance plans are collected from every government in the sample, each plan offered by a responding government (Groups 1, 2, or 4) receives a plan weight that is equal to the raked weight of that government sample unit. Special processing casemissing employment
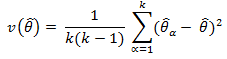
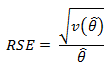
governments Governments with missing employment are excluded from the sampling frame due to their high prevalence of being out of scope with the survey. However, each year a small sample of 40 missing-employment governments are selected systematically as a separate, independent sample. The weight assigned to each sampled government is equal to the total number of missing-employment governments divided by 40. The weights of these governments are not adjusted or raked. They are, however, assigned to random groups independently of the other sampled governments, for variance estimation purposes. It is rare that any governments selected in this special sample remain in-scope to the survey. The primary purpose of this sample is to monitor this type of government to insure the coverage of the survey is complete. Tabulated results of national and state-level estimates of employer-sponsored insurance including offered plans, costs, and number of enrollees are available on the MEPS Web site at http://meps.ahrq.gov. The variances included in the tables are estimated using the Random Group methodology. For the MEPS-IC, the private sector and the governments cases are processed separately. However, the variance estimation process described in this section applies to both the private sector and the government samples. Prior to sampling, the cases on the frame are sorted by key characteristic variables. Once sorted, the employment size of the cases is used to draw a probability proportional to size (PPS) sample. As each case is selected into the sample, a number is sequentially assigned such that the final sample can be easily divided into ten random groups. As stated by Wolter (1985), the random group estimator of
the variance of the estimate,
where k is the number of random groups (10),
The choice of using ten random groups is made because that number of random groups is commonly used for this method. Note that the RSEs are generally quite small for national estimates from the MEPS-IC. Mean and median weights for establishments (private sector) and government agencies in the 2011 MEPS-IC are shown in table 4. Tables 5 and 6 provide selected national estimates and corresponding relative standard errors from the MEPS-IC survey for the private sector and governments, respectively.
Source: Center for Financing, Access, and Cost Trends, Agency for Healthcare Research and Quality, Medical Expenditure Panel Survey Insurance Component, 2011
Source: Center for Financing, Access, and Cost Trends, Agency for Healthcare Research and Quality, Medical Expenditure Panel Survey Insurance Component, 2011
Source: Center for Financing, Access, and Cost Trends, Agency for Healthcare Research and Quality, Medical Expenditure Panel Survey Insurance Component, 2011 Bureau of Labor Statistics (US). Labor Force Statistics from the Current Population Survey. Washington, D. C. www.bls.gov; 2012. Davis K. Sample Design of the 2011 Medical Expenditure Panel Survey Insurance Component. Methodology Report #27. March 2013. Agency for Healthcare Research and Quality, Rockville, MD. http://www.meps.ahrq.gov/mepsweb/data_files/publications/mr27/mr27.pdf Kish L. Survey sampling. New York: John Wiley and Sons; 1965. Madow WG, Olkin I, Rubin DR. Incomplete Data in Sample Surveys, Volume 2: Theory and Bibliographies. New York: Academic Press; 1983. Sommers JP. Construction of Weights for the 1996 Medical Expenditure Panel Survey Insurance Component List Sample. Rockville (MD): Agency for Health Care Policy and Research; 1999. MEPS Methodology Report No. 8. AHCPR Pub. No. 00-0005. U.S. Census Bureau. Business Register. Suitland (MD): U.S. Census Bureau. http://www.census.gov/econ/overview/mu0600.html Wolter, KM. Introduction to Variance Estimation. New York: Springer-Verlag; 1985. Appendix A. Major Changes to the MEPS-IC Survey and Weighting Procedure
Appendix B. Summary of MEPS-IC Nonresponse Adjustments Respondent Groups: 1, 2, 4 Group 1: prescreener information, does not offer insurance Group 2: offers insurance according to the prescreener; mail, Web, or phone follow-up response Group 3: offers insurance according to the prescreener; no mail, Web, or phone follow-up response Group 4: no prescreener information but obtained a mail, Web, or telephone follow-up response Group 5: no prescreener information; no mail, Web, or phone follow-up response (i.e., all other cases that were not eligible for Groups 14 or Group 6) Group 6: out of scope Step 1 Step 2 Appendix C. Classifications Used in the MEPS-IC Weighting Process Firm size Establishment size Collapsed firm size x establishment size Industry group Industries (North American
Industry Classification System Codes) Multi-unit/single-unit establishment firm State groupings Type of government Government size groups (parent agency size) Note: State governments were classified separately because there is only one per State making them unique within each state. Census divisions |
|
|
|||||||||||||||||||||||||||||||||||||||||||||||||||||||||||||||||||||||||||||||||||||||||||||||||||||||||||||||||||||||||||||||||||||||||||||||||||||||||||||||||||||||||||||||||||||||||||||||||||||||||||||||||||||||||||||||||