Methodology Report #6:
List Sample Design of the 1996 Medical Expenditure Panel Survey Insurance Component
by John Paul Sommers, Ph.D., Agency for Health Care
Policy and Research
Select for more information on
Health Care Information and Electronic Ordering Through the AHRQ Web Site.
Abstract
The Medical Expenditure Panel Survey (MEPS) is the third in a series of
nationally representative surveys of medical care use and expenditures sponsored
by the Agency for Health Care Policy and Research (AHCPR). MEPS comprises four
component surveys. The Insurance Component (IC) collects employment-related
health insurance information, such as premiums and types of plans offered.
Respondent characteristics–such as size of business, employee characteristics,
and type of industry–also are collected. This report outlines the process used
to allocate and select the MEPS IC list sample, including goals, development of
allocation schemes, and selection methods. The list sample is collected from
samples developed from three lists that, together, cover almost 100 percent of
the employers in the United States.
Select for information on The Medical Expenditure Panel Survey
(MEPS).
Introduction
The 1996 Medical Expenditure Panel Survey (MEPS) Insurance Component (IC) is
a survey of employers, the self-employed with no employees (SENEs), unions, and
insurance companies. The MEPS IC, which is sponsored by the Agency for Health
Care Policy and Research (AHCPR) and conducted by the U.S. Bureau of the Census,
is designed to collect employment-related health insurance information, such as
premiums and types of plans offered. Respondent characteristics—such as size
of business, employee characteristics, and type of industry—also are
collected.
Although the 1996 MEPS IC was first administered in 1997, data collected were
for the entire calendar year 1996; the survey name refers to the data year, not
the time of collection.
The MEPS IC sample has two parts:
- The household sample, which consists of the employers of respondents to
the 1996 MEPS Household Component (HC), as well as unions and insurance
companies that provide insurance to members of the household sample. Data
from this sample can be attached to information collected from HC
respondents.
- The list sample, which consists of an independent random sample of
employers and SENEs. Similar data on employer health insurance are collected
from both samples. The combination of information collected from households
and employers permits the study of household health expenditures and their
relationship to household insurance status.
The IC household sample is defined by the sample design of the MEPS HC
(Cohen, 1997) and has persons as sample units. Data are collected from the
employers and other insurance providers of the household respondents from the
MEPS HC. The employers and other providers are proxy respondents for
supplemental information on health insurance offered to the household respondent
through the employer or provider. Hence, the probabilities of selection and the
corresponding weights for these employers are the same as those of the household
sample members and come from the MEPS HC design. The data collected are linked
to other information for household sample cases.
The IC list sample is a random sample of establishments selected especially
for the IC, and its selection is independent of the HC design. The two IC
samples (household and list) are combined for collection purposes. The data
collected for both samples are almost identical.
The MEPS IC list sample provides a picture of State and national employer
health insurance. Enrollments, premiums, employee contributions, types of plans
offered, deductibles, coverages, and other characteristics are shown for the
Nation and 40 individual States.
Estimates for characteristics of employer-related health insurance for small
establishments are of particular interest. The MEPS IC sample is a primary
government source of information on employer-related health insurance in the
United States. It should prove to be a key data provider for this crucial
portion of health care.
Return To Top
List Sample Design Process
This report outlines the process used to allocate and select the MEPS IC list
sample, including goals, development of allocation schemes, and selection
methods. The list sample is so named because it is collected from samples
developed from three lists that, together, cover almost 100 percent of the
employers in the United States. These are as follows:
The Standard Statistical Establishment List (SSEL) including
agricultural units. The SSEL is a list of private-sector establishments that is
developed and maintained by the Census Bureau. Although the Census Bureau
obtains information on agricultural units from the same sources used to produce
the SSEL, such units are normally not in scope for most surveys. However,
agricultural employers are in scope for the MEPS IC. The SSEL is continually
updated; the list used for sample selection was that of establishments in
business as of the end of 1995.
The 1992 Census of Governments (COG), a list containing the Federal,
State, and local governments within the United States that is maintained by the
Census Governments Division.
- A 1994 Internal Revenue Service list of SENEs. The overall budgeted size
of the list sample was 30,000 responding cases with completed data from
among the three frames. The sample design development process necessitated
the following steps:
- Allocate the total sample between the SENEs and other employers.
- Allocate the sample from the remaining sample of employers—the
private-sector and government lists combined—among the States.
- Allocate the sample share within each State between government and
private-sector employers.
- Determine a sample allocation scheme within each State for the SSEL
allocation.
- Determine a sample allocation scheme within each State for the COG
allocation.
- Determine sample selection methods within each State for the SSEL and COG
allocations.
- Determine a national sample selection scheme for the SENEs.
Return To Top
Assumptions and Goals
Data from the 1994 National Employer Health Insurance Survey (NEHIS) were
used as a basis for developing the design of the MEPS IC list sample (Marker,
Bryant, Wallace, et al., 1996). NEHIS collected similar data from the same
universe, and it was assumed that the variance structure for the MEPS IC would
follow that of NEHIS. Therefore, the NEHIS variance results, sample size, and
standard sample variance formulas were used to assist in the development of the
IC list sample design.
The IC also used the same strata structure as NEHIS. This structure seemed
reasonable, and time constraints did not allow for the in depth analyses required
to produce another structure. For the private sector, the structure is
determined by the strata of establishments defined by the State in which the
establishment is located, the size of the establishment, and the size of the
firm that owns the establishment. An establishment is an economic unit at a
single location where business is conducted or services or industrial operations
are performed. A firm is a business entity consisting of one or more business
establishments under common ownership or control. Exact categories of firm and
establishment size groups used for private-sector stratification within each
State are displayed in Tables 1 and 2.
For governments, the strata are defined by the State in which the government is
located and employment size (number of employees).
The goals for the establishment sample are as follows:
- Support estimates for a variety of variables of two distinct types. The
first type are establishment variables. These are variables that relate to establishments and tend to have unit variances—that is, variances of a mean
estimate per individual sample (Kish, 1965)—that do not increase in size
across strata with the size of establishment. An example is the average number
of plans offered per establishment. The second type are employee variables.
These relate to the number of employees, and their unit variances increase
across strata as the size of establishment increases. An example is the average
enrollment per establishment.
- Make quality national estimates for the variables selected. Quality was
defined as having a relative standard error (RSE) of 1 percent or less.
- Make quality estimates in at least 40 States for the same variables.
Quality for a State estimate was defined as an RSE of 5 percent or less.
- Make a quality national estimate for the SENE population. Quality was
defined as an RSE of 5 percent or less.
For practical purposes, because of the number of variables involved, two of
each type of variable were chosen for analysis.
Return To Top
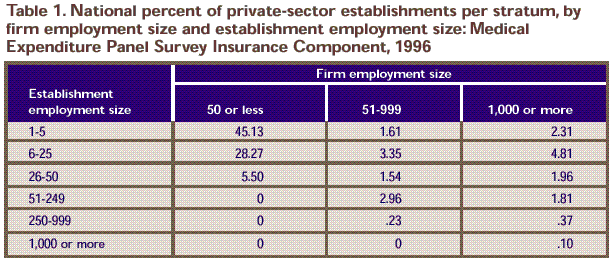
Table 1. National percent of private-sector establishments per stratum, by firm employment size and establishment employment size: Medical Expenditure Panel Survey Insurance Component, 1996
| 45.13 |
1.61 |
2.31 |
| 28.27 |
3.35 |
4.81 |
| 5.50 |
1.54 |
1.96 |
| 0 |
2.96 |
1.81 |
| 0 |
.23 |
.37 |
| 0 |
0 |
.10 |
Note: An establishment is an economic unit at a single location where
business is conducted or services or industrial operations are performed. A firm
is a business entity consisting of one or more business establishments under
common ownership or control.
Source: Center for Financing, Access, and Cost Trends, Agency for Health Care
Policy and Research: Medical Expenditure Panel Survey Insurance Component, 1996.
Return To Top
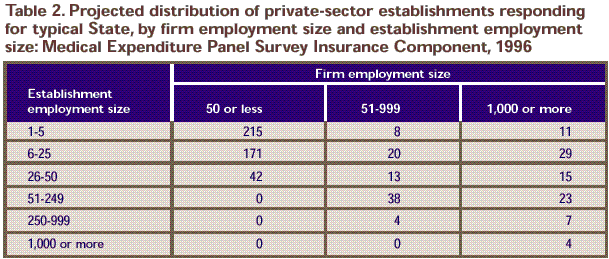
Table 2. Projected distribution of private-sector establishments responding for typical State, by firm employment size and establishment employment size:
Medical Expenditure Panel Survey Insurance Component, 1996
| 215 |
8 |
11 |
| 171 |
20 |
29 |
| 42 |
13 |
15 |
| 0 |
38 |
23 |
| 0 |
4 |
7 |
| 0 |
0 |
4 |
Note: Private-sector list sample = 600. An establishment is an economic
unit at a single location where business is conducted or services or industrial
operations are performed. A firm is a business entity consisting of one or more
business establishments under common ownership or control.
Source: Center for Financing, Access, and Cost Trends, Agency for Health Care
Policy and Research: Medical Expenditure Panel Survey Insurance Component, 1996.
Statistical Tools
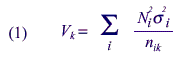
The formulas below were applied relative to the variance of a population
estimate for a variable of interest based on a stratified sample (Cochran,
1977).
Assuming:
 |
is the number of establishments in the ith stratum, |
 |
is the sample for allocation k in the ith
stratum, |
 |
is the standard deviation for the
variable of interest for the ith stratum, |
 |
is the variance estimate of the
population total for the variable of interest for allocation k, and |
 |
is the relative standard error of the estimate of the population total for the
variable of interest for allocation k, then |
Because the main concern is with the relative quality of two types of
allocations, a useful ratio is that of the variances of two different
allocations:
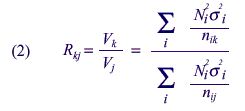
If Mj and Mk are the sample sizes for two different allocations, such that for all cells,
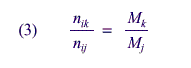
then
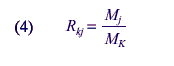
and

and

Using these formulas, sample sizes for the 1994 NEHIS, RSEs from the 1994
NEHIS, and proposed sample sizes for the 1997 MEPS IC, comparisons of various
new allocation schemes can be produced and estimates made of their RSEs.
Return To Top
Sample Allocation
Allocation to SENEs
The first decision was to allocate a national sample of 1,000 to the
population of SENEs and the remaining sample of 29,000 to the private-sector and
government employers. This was done by determining the total sample needs for
the SENE sample. A brief assessment showed that this sample size appeared to
give an average RSE of approximately 5 percent for survey estimates for a set of
important variables.
Allocation Among States
The next step required the allocation of the
sample among the States. The equations above were used, and it was
assumed that the variance structure is the
same within each State. In equation (1), the strata are assumed to
be States and the values of unit variances for each State are assumed
to be equal. These
assumptions require the within-stratum variances and the relative sizes
of the strata within States to be equal. The assumptions seemed reasonable
after
examining a set of within-stratum variances for several variables and
the relative sizes of the strata for several States of various sizes.
Thus, to
compare allocations, only values of equation (1) where the values of
sigma all equal to 1 must be compared.
For the 1994 NEHIS, the sample allocation to each State was done relative to
the values of the .3 power of the number of establishments (Marker, Bryant,
Wallace, et al., 1996.) This allocation method was used to give adequate sample
size to smaller States by increasing their relative size compared with the
larger States. Using this method, 29,000 remaining units were allocated to the
States, and an RSE for this survey was projected using equations (3), (4), (5),
and (6) along with the RSE for the 1994 NEHIS. However, the allocation failed to
meet the stated goals for two reasons:
The national goal of an RSE of 1 percent or less could not be met. This
happened because the sample was much smaller than the sample of 38,000 for the
1994 survey. The smaller IC sample, combined with the loss of efficiency for
national estimates caused by the oversampling of all small States, contributed
to failure to meet the goal.
- In spite of the oversampling of the smaller States, samples for many of
them were too small to produce quality State estimates.
As a result, neither quality estimates for 40 States nor a quality national
estimate could be made with the 1994 NEHIS sample design and the current smaller
sample size. To remedy this problem, it was necessary to produce a minimum
sample in 40 States and to generate a more efficient allocation for national
estimates.
Examination of equation (1) in the case of equal values of shows that the
best allocation for national estimates allocates sample proportional to the size
of Ni for each State. Thus, an allocation was needed that was closer to
proportional than the 1994 NEHIS was. At the same time, the allocation required
a minimum sample within at least 40 States. After a brief analysis, this number
was set at 600. This number would not produce State estimates that would meet
the quality goal of 5 percent or less RSE for estimates of total enrollment.
However, the number was set at 600 for two reasons:
- The goal was close to being achieved, and a further increase in State
allocations might degrade the national estimates.
- It was possible to gain some improvements in allocations within States
that would produce more efficient within-State estimates. These
improvements, which are discussed in later sections, include use of a more
accurate frame, a better allocation of units between government and the
private sector, and a better allocation to strata within the private sector.
These improvements also may allow a closer approach to the State quality
goals with a sample of 600. Approximately 19,000 units were allocated
proportional to the number of establishments in each State. The sample of
any of the 40 largest States that did not receive an allocation of 600 was
supplemented. The value of V for this sample was 1.21 times the value of V
for the optimal proportional sample. The value of V for the allocation using
the 1994 method gave a value approximately 1.45 times the value for the
optimal sample. Thus, the RSE could be improved by approximately 10 percent
compared with the 1994 design with the current sample size, allowing
national estimation goals to be met. The sample allocation to States is
shown in Table 3.
Allocation Within States
Government and Private Sectors
The next step was to divide each State’s allocation between the public and
private sector. In the 1994 NEHIS, this was done in two steps:
- The State government was selected with certainty.
- The ratio of the employment of local governments in the State to the sum
of private-sector employment and local government employment was calculated.
Two-thirds of this percentage was allocated to the local government sample
within the State. Thus, if local government workers constituted 15 percent
of local government and private-sector employment, 2/3 of 15 percent, or 10
percent, of the State’s allocation was local government.
Because of this allocation, the RSEs for many government statistics were less
than those for the private sector, although the government sample was smaller
than that of the private sector. This fact and an examination of equation (1)
indicate that the unit variances and design effects for governments are smaller
than those for the private sector. This was the reason the 1994 government
sample was allocated as only 2/3 the proportion of government employment.
However, this allocation to governments appears to be still too large, and it
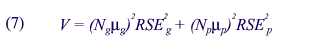
would be better to further lessen the government allocation. To do this, assume
that in equation (1) there are two strata—governments and the private sector.
Let the number of governments and private-sector establishments be Ng and Np.
Likewise, let mg and mg be the means for a variable of interest for governments
and private-sector establishments, and RSEg and RSEp be the relative standard
errors for the estimates of the means of the variables for the two groups. Then
the variance V of the estimate of the total over the entire population can be
written as
For allocation between the government and private sector within a State, a
fixed sample size is divided between the two strata of the population. Under
these conditions, one can show that
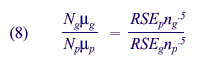
This relationship can be developed using the Neyman optimal allocation of the
sample when there are two strata (Cochran, 1977). For the NEHIS government
allocation, all values within this equation are known. The size of RSEs for
governments for many variables, the relationship of the 1994 NEHIS allocations
to government and the private sector within States, and the population values
all are available.
When these known values were entered into equation (8), the right side of the
equation for the 1994 allocation appeared to be too large. Therefore, the value
of the RSE for governments must be raised, while the value for the private
sector must be lowered. To do this, the allocation to governments within each
State is decreased. Different reductions are needed to achieve an optimal
design for each of the different variables. Thus, a conservative method was
developed that would reduce the government allocation but would not be extreme.
The method is as follows:
- If p is the proportion of employment that is government and n the total
sample, then (2/3)np is the original government allocation.
- Let E be the total employment for all governments. Then any government
with a total employment that is a greater proportion of total government
employment than 1/((2/3)np) is a certainty.
- Remove the certainty governments from the government list and their number
from allocation. Combine the remaining government and private sector. This
value is the new total employment. Calculate a value p*, where p* is the
ratio of the remaining government employment to the value of new total
employment. With n* being the remaining government allocation, check for
more certainties using n* and p* in the formula in the step above using the
remaining government employment.
- Continue to iterate the process until no more certainty governments are
found. At this point, calculate the employment remaining in each State that
is government and combine it with the private sector in that State. Let p#
be the proportion that the remaining government constitutes of that total
and n# be the State allocation less any government certainties.
- Calculate (2/3)p#n# = nc. The State’s government allocation is nc plus
any certainties found in the State. The remaining State allocation is for
the private sector.
As an example, suppose there are two States, each with 50,000 total
employees, half of whom are government employees. Assume the sample allocation
is 120, or 60 per State. The government allocation is .5(2/3)120, or 40. Any
government with more than 1,250 employees is selected with certainty. Assume
each State has 6 governments with more than 1,250 employees and the total
employment of the 6 governments in each State is 20,000.
Remove the 12 governments and their employees. This leaves 60,000 total
employees, of whom 10,000 are government employees. The remaining sample is 108,
or 54 per State. Government gets (10,000)/(60,000)(2/3)108 = 12. Check this and
find nothing large enough to be a certainty—that is, no government in the
remainder larger than 10,000/12 = 867.
Now allocate the remaining 54 sample units in each State. Because the
remaining government in each State is 1/6th of the employment, government gets
2/3 of that proportion of the remaining sample, or 6. The final allocation in
each State under this assumed scenario is 48 private sector, 6 certainty
governments, and 6 noncertainty governments. If the 1994 NEHIS method had been
used, the government allocation would have been 20 per State.
This method considers the disproportionate amount represented by large local
governments. It essentially applies optimal allocation of the sample to the
remainder of the universe after these very large governments are removed. It
produced a sample for governments within States that was approximately 80
percent of the size produced using the 1994 NEHIS methods. Table
3 shows the breakdown of the samples within States.
Return To Top Private-Sector Sample
In allocation of private-sector establishments within States, two types of
variables are considered:
- Those with approximately equal unit variances within strata.
- Those with unit variances that increase as the size of the establishment
increases.
The two variables tend to call for two opposite types of allocation methods.
With the first, allocation is proportional to the number of establishments in a
stratum. With the second, allocation involves increasing the sample according to
the number of employees in establishments within a stratum. The first allocates
large percentages of the sample to strata with small establishments. The second
allocates larger percentages of the sample to large establishments. (Strata
definitions are given in Table 1.)
The probability of allocation for the 1994 NEHIS sample was proportional to
size, with the size measure for an establishment being the square root of the
establishment’s employment size (Marker, Bryant, Wallace, et al., 1996). This
was a compromise between the two extremes above. The method worked reasonably
well and gave good error results.
To determine the allocation for the MEPS IC, a compromise allocation was
developed using unit variances estimated from 1994 NEHIS data. This analysis was
performed to further improve State estimates to meet the State quality goals
that could not be met using the 1994 NEHIS methodology.
To perform the analyses, two different sets of unit variances were used, one
to represent each type of variable. There are 18 possible strata, 6
establishment sizes crossed with 3 firm sizes. These are listed in Table
1. Note that only 14 strata have establishments in them because of
restrictions placed on establishment sizes by the size of the total firm. Unit
variances for a given establishment size were assumed to be equal for all firm
sizes. Thus, there are 6 unit variances for each variable type. For a variable
of the first type, which creates an allocation relative to total numbers of
establishments, these values will be equal; for variables of the second type,
these variances will increase as establishment sizes increase. The relative
values of these variances are as follows:
Establishment
| size (in increasing size) |
Variable type 1 |
Variable type 2 |
| Size 1 |
1 |
1 |
| Size 2 |
1 |
3 |
| Size 3 |
1 |
7 |
| Size 4 |
1 |
32 |
| Size 5 |
1 |
83 |
| Size 6 |
1 |
410 |
After a preliminary analysis, six methods of allocation were attempted:
1. Optimal for variable type 1, or allocation proportional to the number of
establishments in a stratum.
2. Optimal for variable type 2, or Neyman allocation (Cochran, 1977).
3. Allocation proportional to the total employment size in each stratum.
4. Neyman allocation using variances for each stratum, which are an average
of the stratum variances for the two types of variables to be estimated.
5. Allocation equal to the average of the allocations determined by the two
optimal allocation schemes presented above.
6. Allocation proportional to the sum of the square roots of the employment
sizes of all establishments in the stratum. (This is the method from the 1994
NEHIS.)
The sizes of the variances obtained from each method relative to method 1 are
shown below. The values were calculated using equations (1) and (2).
Return To Top
| |
Variable type 1 |
Variable type 2 |
| Method 1 |
1.00 |
1.00 |
| Method 2 |
1.65 |
.79 |
| Method 3 |
4.48 |
1.74 |
| Method 4 |
1.10 |
.79 |
| Method 5 |
1.08 |
.86 |
| Method 6 |
1.39 |
.81 |
Method 4 was selected for the MEPS IC because variable type 2 was considered
to be slightly more important than type 1 in this survey. However, both methods
4 and 5 were good, and both were robust when tested under changes in unit
variance. Table 2 gives the percent allocation to each
stratum in the private sector for a typical State using this method.
Return To Top
Final Allocations
At this point in the process, all samples were of the desired sample size.
Samples must be inflated to account for potential losses due to nonresponse and
out-of- scope units. To develop these numbers for the private sector, losses
were calculated by strata from previous Census Bureau SSELs for time periods
from the time the frame was developed to the time of the survey. The loss rates
are shown in Table 5. The general tendency is for rates to
decrease as both the firm size and the establishment size increase. Losses also
vary from year to year based on economic conditions. The assumption made was
that conditions would be stable with no recession.
No losses were assumed for governments because governments that close are
small boards and commissions with few, if any, employees. The Census Bureau
estimates that total losses in employment during a year would amount to much
less than .5 percent of government employment. To avoid these types of
governments that are of little interest analytically, two steps were taken:
• All governments with less than one full-time equivalent employee were
removed. This removed a large number of small boards and the like, but less than
.01 percent of the total employment. • The sample was selected using
employment as a measure of size.
These two steps resulted in a sample in which there was little chance of
selecting any governments that would be lost because of closure. Thus, no
inflation was made for losses because of closure in the government sample. A
90-percent response rate was assumed for governments.
A similar rate had been achieved in the 1994 NEHIS, and this was believed to
be reasonable.
There was no experience as a guide to estimating losses in the SENE group
except a supposition that it would be a large number. A one-third loss rate
because of closure was chosen for this group.
Sample increases were also made to account for losses because of nonresponse.
Tables 4 and 5 contain these values for private-sector strata, governments, and
SENEs. The results for the private sector and government were based on results
from the 1994 NEHIS, which were slightly lower than the rates assumed. The rates
from NEHIS were increased slightly because of the smaller questionnaire being
used for MEPS and because the Census Bureau was the collection agent. The rate
chosen for SENEs was similar to that assumed for small businesses.
Return To Top
Sample Selection
The sample selection for the three frames was done independently. All
selections employed stratified sequential sampling. No clustering of units was
done because the data collection was primarily by mail and telephone.
To allocate the SENEs, only counts by income class were available. Because
only those in higher income classes were likely to have insurance through their
work, the SENEs were divided into five strata by total annual income and
allocations were made. The allocations relative to the number of persons in each
stratum increased with income to allow for the fact that it was very
unlikely that any of the SENEs with lower incomes had insurance through their
jobs. Assuming a binomial distribution of persons with insurance within each
stratum means that the unit variances increase as the incomes within the strata
increase. Under these assumptions, the resulting optimal allocation (Cochran,
1977) to the strata places a high percentage of the sample in the strata with
higher income persons.
Allocations are:
| Income class |
Allocation |
| $1-$4,999 |
75 |
| $5,000-$9,999 |
100 |
| $10,000-$14,999 |
100 |
| $15,000-$19,999 |
125 |
| $20,000 or more |
1,600 |
Within each stratum, the units were sorted by State, industry, and income.
Each unit within a stratum was assigned an equal probability, and selection was
done using a systematic selection process.
Governments not selected with certainty were stratified by State. Each
government was given a measure of size based on the square root of its
employment size. The governments were sorted by type (city, county, school
district, and other) and employment and were selected systematically within each
State.
Each private-sector establishment within a State was first assigned a
probability of selection. This probability was equal to the sample number
allocated to the establishment’s stratum within its State divided by the
number of establishments in the stratum within the State.
For each large firm, the probabilities of selection of the firm’s
establishments were summed to obtain an expected number of establishments. To
reduce the burden on central office respondents for firms with multiple sampled
establishments, the probability of selection of each establishment within a firm
was reduced by a constant. After these reductions, the expected sample within
each stratum was recalculated determine the shortfall caused by these reductions
in probabilities of selection. To account for the shortfall, probability of
selection of each establishment in a stratum that had not been reduced was
increased slightly the total probabilities of selection within the stratum again
equaled the allocation for the stratum within the State.
Using the new probabilities of selection, establishments were sorted by State,
stratum, industry, and size, and sequential selection was accomplished.
Return To Top
Summary
The MEPS IC sample consists of two parts—the household and list sample
components. Similar data on employer health insurance are collected for both
samples. The purpose of the household sample is to provide data that can be
attached to information collected from respondents in the MEPS HC. The
combination of information collected from households and employers for this
household sample allows analysts to study household health expenditures and how
these expenditures are related to the choices of health insurance offered to the
households.
The MEPS IC list sample is designed to provide quality estimates for a
variety of employer-related health insurance characteristics. The sample is
designed to provide a picture of State and national employer health insurance.
Among the characteristics shown are enrollments, premiums, employee
contributions, types of plans offered, deductibles, and coverages. Estimates
made for the Nation should have excellent precision, with RSEs of about 1
percent for characteristics for the entire country and for the entire private
sector. In addition, estimates for characteristics of employer-related health
insurance within the 40 largest States can be made with good precision.
Estimates for characteristics of employer-related health insurance for small
establishments will be of particular interest. Oversampling of these
establishments, along with annual surveys, should permit analysts to track
changes and effects of government policy for this sensitive portion of the
population—for the Nation as well as for the 40 largest States.
The MEPS IC sample is a primary government source of information on
employer-related health insurance in the United States. It should prove to be a
key data provider for this crucial portion of health care.
Return To Top
References
Cochran WG. Sampling techniques. New York: John
Wiley and Sons; 1977.
Cohen S. Sample design of the 1996 Medical
Expenditure Panel Survey Household Component.
Rockville (MD): Agency for Health Care Policy and
Research; 1997. MEPS Methodology Report No. 2. AHCPR
Pub. No. 97-0027.
Kish L. Survey sampling. New York: John Wiley and
Sons; 1965.
Marker D, Bryant E, Wallace L, Yansaneh I. National
Employer Health Insurance Survey (NEHIS): draft final methodology report;
volume I: statistical methodology. Rockville (MD): Westat, Inc.; 1996.
Return To Top
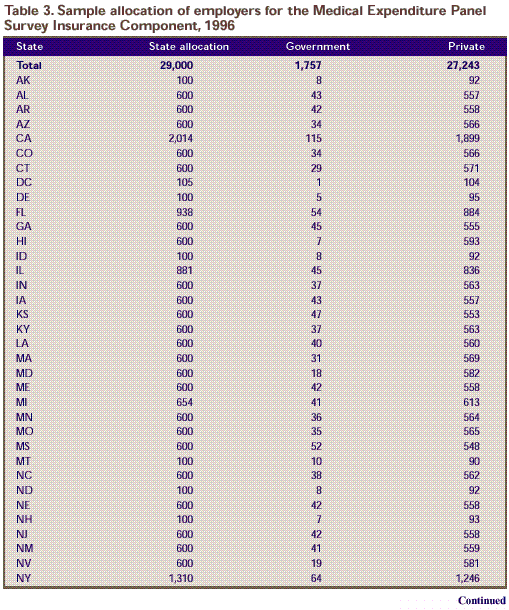
Table 3. Sample allocation of employers for the Medical Expenditure Panel Survey Insurance Component, 1996
| 29,000 |
1,757 |
27,243 |
| 100 |
8 |
92 |
| 600 |
43 |
557 |
| 600 |
42 |
558 |
| 600 |
34 |
566 |
| 2,014 |
115 |
1,899 |
| 600 |
34 |
566 |
| 600 |
29 |
571 |
| 105 |
1 |
104 |
| 100 |
5 |
95 |
| 938 |
54 |
884 |
| 600 |
45 |
555 |
| 600 |
7 |
593 |
| 100 |
8 |
92 |
| 881 |
45 |
836 |
| 600 |
37 |
563 |
| 600 |
43 |
557 |
| 600 |
47 |
553 |
| 600 |
37 |
563 |
| 600 |
40 |
560 |
| 600 |
31 |
569 |
| 600 |
18 |
582 |
| 600 |
42 |
558 |
| 654 |
41 |
613 |
| 600 |
36 |
564 |
| 600 |
35 |
565 |
| 600 |
52 |
548 |
| 100 |
10 |
90 |
| 600 |
38 |
562 |
| 100 |
8 |
92 |
| 600 |
42 |
558 |
| 100 |
7 |
93 |
| 600 |
42 |
558 |
| 600 |
41 |
559 |
| 600 |
19 |
581 |
| 1,310 |
64 |
1,246 |
Return To Top
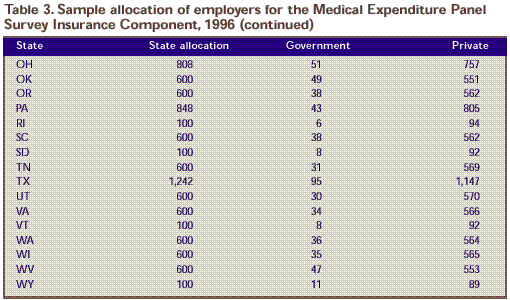
Table 3. Sample allocation of employers for the Medical Expenditure Panel Survey Insurance Component, 1996 (continued)
| 808 |
51 |
757 |
| 600 |
49 |
551 |
| 600 |
38 |
562 |
| 848 |
43 |
805 |
| 100 |
6 |
94 |
| 600 |
38 |
562 |
| 100 |
8 |
92 |
| 600 |
31 |
569 |
| 1,242 |
95 |
1,147 |
| 600 |
30 |
570 |
| 600 |
34 |
566 |
| 100 |
8 |
92 |
| 600 |
36 |
564 |
| 600 |
35 |
565 |
| 600 |
47 |
553 |
| 100 |
11 |
89 |
Source: Center for Financing, Access, and Cost Trends, Agency for Health Care Policy and Research:
Medical Expenditure Panel Survey Insurance Component, 1996.
Return To Top
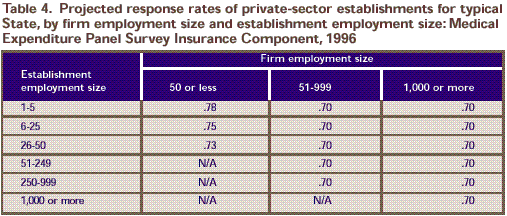
Table 4. Projected response rates of private-sector establishments for typical State, by firm employment size and establishment employment size:
Medical Expenditure Panel Survey Insurance Component, 1996
| .78 |
.70 |
.70 |
| .75 |
.70 |
.70 |
| .73 |
.70 |
.70 |
| N/A |
.70 |
.70 |
| N/A |
.70 |
.70 |
| N/A |
N/A |
.70 |
Note: An establishment
is an economic unit at a single location where business is conducted or
services or industrial operations are performed. A firm is a business
entity consisting of one or more business establishments under common
ownership or control. N/A is not applicable.
Source: Center for Financing, Access, and Cost Trends, Agency for Health Care Policy and Research:
Medical Expenditure Panel Survey Insurance Component, 1996.
Return To Top
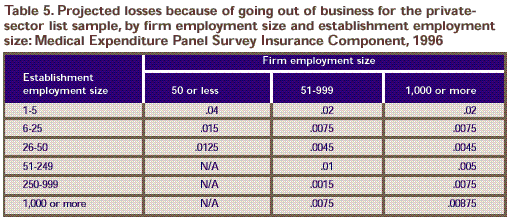
Table 5. Projected losses because of going out of business for the private-sector list sample, by firm employment size and establishment employment size:
Medical Expenditure Panel Survey Insurance Component, 1996
| .04 |
.02 |
.02 |
| .015 |
.0075 |
.0075 |
| .0125 |
.0045 |
.0045 |
| N/A |
.01 |
.005 |
| N/A |
.0015 |
.0075 |
| N/A |
.0075 |
.00875 |
Note: Projected
response rates, government: .90. Projected losses from governments going
out of business: 0. Projected response rates, self-employed with no
employees (SENEs): .75. Projected losses from SENEs going out of business:
.33.
An establishment is an economic unit at a single
location where business is conducted or services or industrial operations
are performed. A firm is a business entity consisting of one or more
business establishments under common ownership or control.
N/A is not applicable.
Source: Center for Financing, Access, and Cost Trends, Agency for Health Care Policy and Research:
Medical Expenditure Panel Survey Insurance Component, 1996.
Return To Top
Suggested Citation:
Methodology Report #6: List Sample Design of the 1996 Medical Expenditure Panel Survey Insurance Component. July 1999. Agency for Healthcare Research and Quality, Rockville,
MD.
http://www.meps.ahrq.gov/data_files/publications/mr6/mr6.shtml
|
|
