Research
Findings #10: Health Status and Limitations: A Comparison of Hispanics,
Blacks, and Whites, 1996
Margaret E. Weigers, Ph.D.,1 Gallaudet University,
and Susan K. Drilea, M.S.,1 ROW Sciences, Inc.
Abstract
This report from the Agency for Health Care Policy and Research presents estimates of health status and limitations for the civilian noninstitutionalized population of the United States during calendar year 1996. Estimates are shown separately for Hispanics, blacks, and whites. Data are derived from the 1996 Medical Expenditure Panel Survey (MEPS) Household Component (HC). Health status was rated from excellent to poor by household respondents. Five types of functional limitations were assessed: activities of daily living (ADLs); instrumental activities of daily living (IADLs); limitations in physical activities such as walking; limitations in the ability to work, go to school, or do housework; and cognitive limitations. The report examines racial/ethnic differences in health status and limitation while taking into account other population characteristics-not only the large differences in age distribution across the three racial/ethnic groups but also characteristics such as sex, presence of a family wage earner, and health insurance status. Among the three racial/ethnic groups, fair or poor health was more likely among Hispanic children and among Hispanic and black non-elderly adults. The frequency of functional limitations by race/ethnicity was quite varied. Hispanics were less likely than blacks to have functional limitations. Among the elderly, blacks were much more likely than whites or Hispanics to have ADL or IADL limitations.
^top
Introduction
Perceived health status and functional limitations
are key elements in health-related quality of life (Lohr,
1992). They also are closely associated with health care use
and spending. Members of racial and ethnic minority groups
frequently experience lower levels of health and health-related
quality of life than whites do. However, racial and ethnic
differences in health status must be examined carefully because
the effects of factors such as socioeconomic status and culture
can be masked by apparent racial effects (Schulman, Rubenstein,
Chesley, et al., 1995; Williams, 1994). Therefore, careful
analysis of health status among racial and ethnic groups is
essential to understanding and addressing the health status
inequalities found in American society. This
report provides national estimates of perceived health status and
functional limitations for Hispanic, black, and white2 members
of the civilian noninstitutionalized population of the United States.
Data on people in other racial/ethnic groups are not included.
These estimates are based on data from Round 1 of the 1996 Medical
Expenditure Panel Survey Household Component (MEPS HC). This report
examines racial/ethnic differences in perceived health status and
functional limitations while taking into account other population
characteristics such as age, sex, presence of a family wage earner,
and health insurance status.
Perceived health status was measured by
asking respondents to rate their own health (and the health
of all the members of their family) as excellent, very good,
good, fair, or poor, when compared to other people of the
same age. Additionally, five categories of functional limitations
were assessed:
- Needing help with activities of daily
living (ADLs), such as bathing or dressing.
- Needing help with instrumental activities
of daily living (IADLs), such as shopping, making telephone
calls, or paying bills.
- Having limitations in physical activities,
such as walking, climbing stairs, lifting, or bending.
- Having limitations in the ability to
work at a job, go to school, or do housework.
- Having cognitive limitations, such as
confusion or memory loss.
Unless otherwise noted, only differences
that were statistically significant at the .05 level are discussed
in the text. A technical appendix provides detailed information
on the MEPS HC, including data collection methods, instrument
items, data editing, sample sizes, and statistical procedures
for deriving estimates.
^top
Population Characteristics
Table 1 presents
a demographic profile of the Hispanic, black, and white U.S.
civilian noninstitutionalized population. Of the total civilian
noninstitutionalized population (including all racial/ethnic
groups), 10.8 percent were Hispanic, 12.5 percent were black,
and 72.2 percent were white.
Age
The age distribution varied significantly
across the three racial/ethnic groups. Children under age
6 made up 14.1 percent of the Hispanic population and 11.1
percent of the black population but only 7.9 percent of the
white population. Conversely, 14.1 percent of whites were
age 65 and over, compared with only 5.2 percent of Hispanics
and 8.1 percent of blacks. The large differences in age distribution
among Hispanic, black, and white Americans have important
implications for the health needs of these groups.
Education and Family Wage Earner
There also were considerable differences
in levels of adult education across the three racial/ethnic
groups examined in this report. More than 40 percent of Hispanic
adults (41.8 percent) and approximately one-quarter of black
adults (26.2 percent) had less than 12 years of education,
compared with only one-sixth of white adults (17.1 percent).
In spite of dissimilar educational levels, Hispanics and whites
were about equally likely to have at least one family member
who was earning a wage.
Health Insurance
There were wide variations in health insurance
status across the three groups. Among people under age 65,
less than half of Hispanics (44.6 percent) and about half
of blacks (49.9 percent) had private health insurance, while
more than three-quarters of whites (76.7 percent) had private
insurance. Lack of insurance was far more common among Hispanics
(35.1 percent) than among either blacks (24.8 percent) or
whites (15.2 percent).
Among people age 65 and over, Hispanics
and blacks were more likely than whites to have only Medicare
coverage, or to have Medicare as well as some other form of
public health insurance (such as Medicaid). However, whites
were about twice as likely to have Medicare combined with
some form of private coverage (66.8 percent of whites 65 and
over, compared to 33.4 percent of Hispanics and 34.2 percent
of blacks).
Region and Place of Residence
Approximately 45 percent of the Hispanic
population lived in the West Region of the United States.
The largest proportion of blacks (55.6 percent) lived in the
South. Hispanics and blacks were more likely than whites to
live in a metropolitan statistical area (MSA).
^top
Perceived Health Status
Increasingly,
health services researchers and clinicians are recognizing
the importance of people's
own perceptions of their health in monitoring health care
outcomes. Answers to simple questions-such as, "In general,
compared to other people of the same age, would you say that
your health (or your family member's health) is excellent,
very good, good, fair, or poor?"-have been shown to predict
demand for medical care services and medical care outcomes
(Bowling, 1991; Ware and Sherbourne, 1992). Moreover, self-
and family-reported health status have provided important
insights on quality of life (Ware, 1984). Table
2 compares perceived health status measures for Hispanics,
blacks, and whites, while holding constant four variables
that have often been associated with differences in health
status: age, sex, presence of a family wage earner, and health
insurance status.
Age
Hispanic children under age 18 were more
frequently in fair or poor health (7.8 percent) than black
children (4.2 percent) or white children (2.9 percent). These
differences may seem small, but they are important because
of the number of children involved: more than 2.6 million
Hispanic, black, and white children were in fair or poor health
(not shown).
Hispanics and blacks ages 18-64 were significantly
more likely than whites to be in fair or poor health (17.4
percent and 16.1 percent, respectively, compared with 9.9
percent of whites) and less likely to be in excellent health
(26.8 percent and 29.3 percent, respectively, compared with
34.6 percent of whites). Among adults age 65 and over, Hispanics
and blacks also were more likely than whites to be in fair
or poor health (36.9 percent and 40.4 percent, respectively,
compared with 25.3 percent of whites).
Sex
Differences in health status by racial/ethnic
group were found even within same-sex groups. Hispanic and
black females were more likely to be in fair or poor health
(16.9 percent and 15.3 percent, respectively) than white females
(11.0 percent). Similarly, Hispanic and black males were more
likely to be in fair or poor health (12.9 percent and 12.5
percent, respectively) than white males (9.6 percent). At
the other end of the health rating scale, excellent health
was less common among Hispanic males (33.4 percent) than among
black males (38.8 percent) or white males (39.6 percent).
Family Wage Earner
Within each of the three racial/ethnic groups
examined in this report, people living in families without
a wage earner were far more likely than people living in families
with a wage earner to be in fair or poor health. For example,
among whites, people living in families without a wage earner
were almost three times as likely as people living in families
with a wage earner to be in fair or poor health (19.6 percent
compared with 6.8 percent).
When the comparison of health status by
race/ethnicity is limited to people living in families with
a wage earner, it can be seen that Hispanics were the most
likely to be in fair or poor health (12.6 percent), followed
by blacks (9.7 percent). Only 6.8 percent of whites living
in families with a wage earner were in fair or poor health.
Health Insurance Status
This section is divided into information
on people under age 65 and those age 65 and over.
Looking at the under-65 group, uninsured
Hispanics and blacks were more likely than uninsured whites
to be in fair or poor health (14.9 percent for Hispanics,
14.5 percent for blacks, and 9.9 percent for whites). In addition,
only 28.4 percent of uninsured Hispanics had excellent health,
compared with 36.6 percent of blacks and 37.7 percent of whites
without insurance.
Among those under
age 65, people with public health coverage were far more
frequently in fair or poor health
than privately insured people in the same racial/ethnic group.
Comparing Hispanics, blacks, and whites with public insurance
only (mostly Medicaid), there were no significant differences
in the proportion who had excellent health. Similarly, there
were no significant racial/ethnic differences in the proportion
of privately insured people in excellent health. However,
this lack of variation in health status across racial/ethnic
groups when comparing people with similar insurance status
must be viewed with caution. Younger people tend to have better
health, and older people tend to have worse health. Compared
with whites, a larger proportion of the Hispanic and black
populations in the United States are under age 18. The difference
in age distribution could make it appear that there are few
health status differences among people with similar insurance
status. For this reason, the next section, "Controlling
for Insurance and Age," further analyzes health status
variations across racial and ethnic groups.
Turning to those age 65 and over, blacks
with Medicare as their only coverage were less likely to be
in excellent health than Hispanics or whites with Medicare
only (10.6 percent compared with 18.5 percent of Hispanics
and 19.0 percent of whites). Further analysis of health status
by racial/ethnic group for those age 65 and over is limited
by small sample sizes.
^top
Controlling for Insurance and Age
As Table 3 indicates,
there were significant disparities in health status by racial/ethnic
group when privately insured children under age 18 were compared.
Privately insured Hispanic children were more likely to be
in fair or poor health (4.2 percent) than privately insured
white children (2.5 percent). The differences for Hispanics
were even more pronounced among publicly insured children.
Hispanic children covered only by public health insurance
were twice as likely as publicly insured black or white children
to be in fair or poor health (12.9 percent, compared to 6.3
percent of black children and 6.0 percent of white children).
Among children who had no insurance at all, Hispanic children
were less likely to be in excellent health (39.1 percent)
than white children (55.8 percent).
Among adults ages 18-64 who had private
health insurance, Hispanics and blacks were less likely than
whites to be in excellent health and more likely to be in
fair or poor health. Among adults who had no health insurance
of any kind, Hispanics were less likely to be in excellent
health (23.8 percent) than blacks (32.2 percent) or whites
(32.3 percent). Both Hispanic and black adults who were uninsured
were more likely than whites to be in fair or poor health
(18.4 percent and 17.6 percent, respectively, compared with
12.3 percent of whites).
^top
Functional Limitations
The concept of functional limitation addresses
the effect that a disease or condition has on a person as
a whole. For example, a person with arthritis in a knee has
a particular disease that may or may not create a functional
limitation, such as an inability to climb stairs or walk long
distances (Nagi, 1991). Like the overall measure of health
status discussed previously, measures of functional limitation
are based on a person's perceptions rather than a particular
medical diagnosis of disease or disease severity. And like
perceived health status, measures of functional limitation
of this kind have been shown to be related to health care
use and spending and to have important implications for health-related
quality of life.
Functional limitations are often divided
into two categories: limitations in the ability to perform
activities of daily living (ADLs), such as bathing or dressing,
and limitations in the ability to perform instrumental activities
of daily living (IADLs), such as shopping, paying bills, and
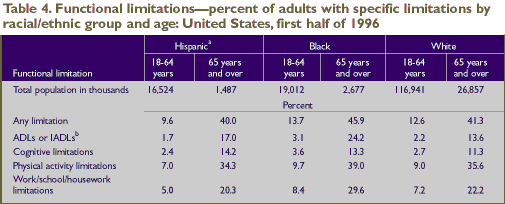
making phone calls. As Table 4 indicates,
the Hispanic population ages 18-64 was less likely to need
help with ADLs or IADLs (1.7 percent) than the black population
this age (3.1 percent). Blacks age 65 and over were far more
likely to report needing help with ADLs or IADLs (24.2 percent)
than elderly Hispanics (17.0 percent) or whites (13.6 percent)
were.
Like ADLs and IADLs, cognitive limitations
were less frequently reported for the Hispanic population
ages 18-64 (2.4 percent) than for blacks in the same age group
(3.6 percent). Across the three racial/ethnic groups, cognitive
limitations among the elderly were not strikingly different.
Hispanics ages 18-64 were less likely than
either blacks or whites of the same age to have difficulty
with physical activities such as walking, climbing stairs,
grasping objects, reaching overhead, lifting, bending or stooping,
or standing for long periods of time (7.0 percent, compared
with 9.7 percent of blacks and 9.0 percent of whites). Hispanics
in this age group also were less likely to be limited in the
ability to work at a job, go to school, or do housework because
of an impairment or physical or mental health problem (5.0
percent) than blacks or whites in the same age group (8.4
percent and 7.2 percent, respectively). A combined measure
of the four different types of limitations shows that Hispanics
ages 18-64 had limitations less frequently (9.6 percent) than
blacks (13.7 percent) or whites (12.6 percent) in the same
age group.
The pattern was somewhat different for the
age group 65 and over. Elderly Hispanics, like younger Hispanics,
were the least likely to have limitations in the ability to
work at a job, attend school, or do housework (20.3 percent).
The proportion of elderly whites with work, school, or housework
limitations (22.2 percent) was similar to that for Hispanics.
Elderly blacks were considerably more likely to have limitations
of this kind (29.6 percent). The proportion of elderly people
having either physical activity limitations or any limitations
at all did not differ significantly by race/ethnicity.
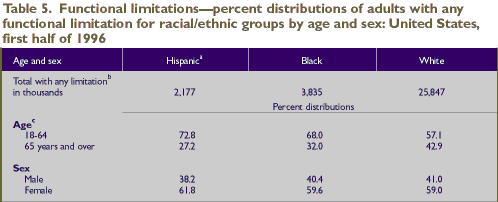
Table 5 profiles
people who had some type of functional limitation (any one
or more of the following: limitations in ADLs or IADLs, cognitive
limitations, physical activity limitations, or work/school/housework
limitations), comparing the age and sex distribution across
the Hispanic, black, and white populations. Among people with
functional limitations of any kind, more Hispanics and blacks
than whites were relatively young (18-64 years). In the white
population, a larger proportion of those with functional limitations
were age 65 and over. There were no significant differences
in the distribution of people with functional limitations
by sex across the three racial/ethnic groups.
^top
Conclusion
This report reveals some important differences
in the perceived health status and level of functional limitations
among Hispanics, blacks, and whites living in the United States.
Hispanic children under age 18 were more likely than either
black or white children to be in fair or poor health. Among
adults ages 18-64, Hispanics and blacks were more likely than
whites to be in fair or poor health; they also were less likely
to be in excellent health.
Before researchers controlled for age, the
comparisons indicated that Hispanics, blacks, and whites with
private health insurance were equally likely to be in excellent
health. However, when the large differences in age distribution
across the three racial/ethnic groups were taken into account,
significant differences in health status were found for both
the privately insured and publicly insured groups. Specifically,
Hispanics and blacks frequently had lower perceived health
status than whites.
The frequency with which functional limitations
were found across the three racial/ethnic groups was quite
varied. Hispanics were less likely than blacks to have functional
limitations. In the age group 18-64, Hispanics were less likely
than whites to have physical activity limitations, work/school/housework
limitations, or any limitations at all. Among those age 65
and over, blacks were far more likely than whites or Hispanics
to have limitations in the ability to perform ADLs or IADLs,
or to work at a job, go to school, or do housework.
The age distributions of people with some
form of functional limitation were not equal across the three
racial/ethnic groups. People with functional limitations were
more likely to be under age 65 in the Hispanic and black populations
than in the white population.
Health status and functional limitations
varied in different ways across the three racial/ethnic groups.
For example, Hispanics were more likely than whites to be
in fair or poor perceived health but less likely to be reported
as having functional limitations. The degree to which differences
in health status and functional limitations across racial/ethnic
groups are due to differences in age distribution, cultural
differences in the definition of health and limitation, and
other social and economic factors remains an important question.
Although multivariate analysis would be needed to attempt
to distinguish these complex relationships, the descriptive
findings in this report suggest that important differences
in the health status and frequency of functional limitations
exist across racial and ethnic groups in the United States.
Subsequent releases of MEPS data will allow
for additional analysis of health status by racial and ethnic
groups, including analysis of some specific and highly prevalent
conditions. It also will be possible to examine the relationship
between health status, health care use and spending, and income
and insurance status by racial and ethnic group. In this way
MEPS will allow for more detailed consideration of the associations
among demographic factors, socioeconomic status, racial/ethnic
group membership, and health status.
^top
Tables

- In addition
to whites, blacks, and Hispanics, total population figures
include American Indians, Alaska
Natives, and Asian or Pacific Islanders.
- Includes
Hispanics of all races; the other race/ethnicity categories
exclude Hispanics.
- Educational
level of persons 18 years of age and over. Within each
racial/ethnic group, a correction
was applied to adjust totals for a small amount of item
nonresponse on education.
- Health insurance
status refers to health insurance during the first half
of 1996. CHAMPUS/CHAMPVA
(Armed-Forces-related coverage) is classified as public
insurance.
- The small number of individuals age
65 and over who did not have Medicare are excluded from
the analysis.
Note: Restricted to civilian noninstitutionalized
population. Percents may not add to 100 due to rounding.
Source: Center for Financing, Access,
and Cost Trends, Agency for Health Care Policy and Research:
Medical Expenditure Panel Survey Household Component, 1996
(Round 1).
^top

- Includes Hispanics
of all races; the other race/ethnicity categories exclude
Hispanics.
- Within each
racial/ethnic group, a correction was applied to adjust
totals for a small amount of item
nonresponse on health status.
- Health insurance
status refers to health insurance during the first half
of 1996. CHAMPUS/CHAMPVA
(Armed-Forces-related coverage) is classified as public
insurance.
- Sample size
is too small to support reliable estimation.
Note: Restricted
to civilian noninstitutionalized population. Percents may
not add to 100 due to rounding.
Source: Center for Financing, Access,
and Cost Trends, Agency for Health Care Policy and Research:
Medical Expenditure Panel Survey Household Component, 1996
(Round 1).
^top

- Health insurance
status refers to health insurance during the first half
of 1996. CHAMPUS/CHAMPVA
(Armed-Forces-related coverage) is classified as public
insurance.
- Because of
small numbers, people 65 and over are not included.
- Includes Hispanics of all races;
the other race/ethnicity categories exclude Hispanics.
- Relative standard error is greater than
30 percent.
Note: Restricted to civilian noninstitutionalized
population. Percents may not add to 100 due to rounding.
Source: Center for Financing, Access, and Cost Trends,
Agency for Health Care Policy and Research: Medical Expenditure
Panel Survey Household Component, 1996 (Round 1).
^top
- Includes
Hispanics of all races; the other race/ethnicity categories
exclude Hispanics.
- Activities
of daily living (ADLs) include activities such as bathing
and dressing. Instrumental activities
of daily living (IADLs) include activities such as shopping
and paying bills.
Note: Restricted to civilian noninstitutionalized
population. Percents may not add to 100 due to rounding. Because
of small numbers, children under age 18 are not included.
Source: Center for Financing, Access,
and Cost Trends, Agency for Health Care Policy and Research:
Medical Expenditure Panel Survey Household Component, 1996
(Round 1).
^top
- Includes
Hispanics of all races; the other race/ethnicity categories
exclude Hispanics.
- Any limitation
includes activities of daily living such as bathing and
dressing, instrumental
activities of daily living such as shopping and paying bills,
cognitive limitations, physical activity limitations, and
limitations in the ability to work at a job, go to school,
or do housework.
- Because of small numbers, children under
age 18 are not included.
Note: Restricted
to civilian noninstitutionalized population. Percents may
not add to 100 due to rounding.
Source: Center for Financing, Access,
and Cost Trends, Agency for Health Care Policy and Research:
Medical Expenditure Panel Survey Household Component, 1996
(Round 1).
^top
References
Bowling A. Measuring health: a review of
quality of life measurement scales. Bristol (PA): Open University
Press; 1991.
Cohen J. Design and methods of the Medical
Expenditure Panel Survey Household Component. Rockville (MD):
Agency for Health Care Policy and Research; 1997. MEPS Methodology
Report No. 1. AHRQ Pub. No. 97-0026.
Cohen JW, Monheit AC, Beauregard KM, et
al. The Medical Expenditure Panel Survey: a national health
information resource. Inquiry 1996;33:373-89.
Cohen S. Sample design of the 1996 Medical
Expenditure Panel Survey Household Component. Rockville (MD):
Agency for Health Care Policy and Research; 1997. MEPS Methodology
Report No. 2. AHRQ Pub. No. 97-0027.
Lohr KN. Applications of health status assessment
measures in clinical practice: overview of the third Conference
on Advances in Health Status Assessment. Medical Care 1992
May; 30 Suppl(5):MS1-MS14.
Nagi, SZ. Disability concepts revisited:
implications for prevention. In: Pope AM, Tarlov AR, editors.
Disability in America: toward a national agenda for prevention.
Washington (DC): Institute of Medicine, National Academy Press;
1991.
Schulman KA, Rubenstein LE, Chesley FD,
et al. The roles of race and socioeconomic factors in health
services research. HSR: Health Services Research 1995;30(1):179-95.
Vistnes JP, Monheit AC. Health insurance
status of the U.S. civilian noninstitutionalized population:
1996. Rockville (MD): Agency for Health Care Policy and Research;
1997. MEPS Research Findings No. 1. AHRQ Pub. No. 97-0030.
Ware JE. Conceptualizing disease impact
and treatment outcomes. Cancer 1984 May 15; 53(Suppl):2316-23.
Ware JE, Sherbourne CD. The MOS 36-item
short-form health survey (SF-36): conceptual framework and
item selection. Medical Care 1992;30(6):473-83.
Williams DR. The concept of race in health
services research: 1966-1990. HSR: Health Services Research
1994;29(3):261-74.
^top
Appendix
The data in this report were obtained in
the first round of interviews for the Household Component
(HC) of the 1996 Medical Expenditure Panel Survey (MEPS).
MEPS is cosponsored by the Agency for Health Care Research
and Quality (AHRQ) and the National Center for Health Statistics
(NCHS). The MEPS HC is a nationally representative survey
of the U.S. civilian noninstitutionalized population that
collects medical expenditure data at both the person and household
levels. The focus of the MEPS HC is to collect detailed data
on demographic characteristics, health conditions, health
status, use of medical care services, charges and payments,
access to care, satisfaction with care, health insurance coverage,
income, and employment. In other components of MEPS, data
are collected on the use, charges, and payments reported by
providers; residents of licensed or certified nursing homes;
and the supply side of the health insurance market.
The sample for the 1996 MEPS HC was selected
from respondents to the 1995 National Health Interview Survey
(NHIS), which was conducted by NCHS. NHIS provides a nationally
representative sample of the U.S. civilian noninstitutionalized
population and reflects an oversampling of Hispanics and blacks.
Although the MEPS HC sample includes individuals in a wide
variety of racial and ethnic categories, the data included
in this report are limited to individuals reported by the
survey respondent to be Hispanic (of any race), non-Hispanic
black, or non-Hispanic white.
The MEPS HC collects
data through an overlapping panel design. In this design,
data are collected through a
precontact interview that is followed by a series of five
rounds of interviews over 2 1/2 years. Interviews are conducted
with one member of each family, who reports on the health
care experiences of the entire family. Two calendar years
of medical expenditure and utilization data are collected
from each household and captured using computer-assisted personal
interviewing (CAPI). This series of data collection rounds
is launched again each subsequent year on a new sample of
households to provide overlapping panels of survey data that
will provide continuous and current estimates of health care
expenditures. The reference period for Round 1 of the MEPS
HC was from January 1, 1996, to the date of the first interview,
which occurred during the period from March through July 1996.
Perceived Health
Status
In every round
of MEPS, the respondent is asked to rate the health of every
member of the family. The
exact wording of the question is: "In general, compared
to other people of (PERSON)'s age, would you say that (PERSON)'s
health is excellent, very good, good, fair, or poor?" The
interviewer records the respondent's answers and also codes
whether the answers represent a self-rating or a rating of
the health of another family member.
There was a small
amount of item nonresponse for the health status item (.37
percent among Hispanics, .85
percent among blacks, and .38 percent among whites). Within
each racial/ethnic group, a correction was applied to redistribute
item nonresponse across the categories.
Functional Limitations
Questions concerning the need for assistance
in activities of daily living (ADLs) and instrumental activities
of daily living (IADLs) are asked in every round of MEPS.
All other questions concerning functional limitations are
asked in Rounds 1 and 3.
IADLs and ADLs
Limitations in
the ability to perform IADLs are assessed by first asking
the respondent a screening question: "Does
anyone in the family receive help or supervision using the
telephone, paying bills, taking medications, preparing light
meals, doing laundry, or going shopping?" If the respondent
indicates that someone in the household receives help with
these activities, a follow-up question is asked to determine
which household member receives help. For persons under age
13, a final verification question is asked to confirm that
the limitation is due to "an impairment or physical or
mental health problem."
Limitations in
the ability to perform ADLs are assessed with the following
question: "Does anyone
in the family receive help or supervision with personal care
such as bathing, dressing, or getting around the house?" As
with IADLs, a follow-up question identifies the individual
with the limitation and, for children under the age of 13,
another follow-up question confirms that the limitation is
caused by an impairment.
Cognitive Limitations
Limitations in
mental or cognitive functioning are assessed through a series
of three questions about adults
living in the family. The first question asks, "Does
anyone in the family experience confusion or memory loss such
that it interferes with daily activities?" The second
question continues, "Does anyone in the family have problems
making decisions to the point that it interferes with daily
activities?" The third question asks, "Does anyone
in the family require supervision for their own safety?"
Physical Activity Limitations
Limitations in
physical activities are measured by asking, "Does anyone in the family have difficulties
walking, climbing stairs, grasping objects, reaching overhead,
lifting, bending or stooping, or standing for long periods
of time?" For individuals age 13 and over who have physical
activity limitations, a series of follow-up questions are
asked to gather more detailed information about the nature
and extent of the limitation. The data from the follow-up
questions were not available for this report.
Work/School/Housework Limitations
These limitations
include both paid work and unpaid housework, as well as
limitations in ability to
attend school. The relevant question asks, "Is anyone
in the family limited in any way in the ability to work at
a job, do housework, or go to school because of an impairment
or a physical or mental health problem?" (emphasis
in the question as indicated). For individuals identified
as having a work/school/housework limitation, a follow-up
question is used to clarify if the limitation applies to working
at a job, doing housework, going to school, or some combination
of the three. The data from the follow-up question were not
available for this report.
Any Limitations
The measure "any limitations" is
a combined measure that indicates whether an individual has
one or more of the five types of limitations previously described:
ADLs, IADLs, cognitive limitations, physical activity limitations,
and limitations in the ability to work at a job, go to school,
or do housework.
Population Characteristics
Information on all population characteristics
used in this report comes from the MEPS HC Round 1.
Race/Ethnicity
Classification by race and ethnicity is
based on information reported for each family member. Respondents
were asked if each family member's race was best described
as American Indian, Alaska Native, Asian or Pacific Islander,
black, white, or other. They also were asked if each family
member's main national origin or ancestry was Puerto Rican;
Cuban; Mexican, Mexicano, Mexican American, or Chicano; other
Latin American; or other Spanish. All persons whose main national
origin or ancestry was reported in one of these Hispanic groups,
regardless of racial background, were classified as Hispanic.
Since the Hispanic grouping can include black Hispanic, white
Hispanic, and other Hispanic, the race categories of black,
white, and other do not include Hispanic. Only data for individuals
identified as Hispanic (of any race), non-Hispanic black,
and non-Hispanic white are included in this analysis.
Region and Place of Residence
Individuals were identified as residing
in one of four main regions-Northeast, Midwest, South, and
West-in accordance with the U.S. Bureau of the Census definition.
Place of residence, either inside or outside a metropolitan
statistical area (MSA), was defined according to the U.S.
Office of Management and Budget designation, which applied
1990 standards using population counts from the 1990 U.S.
census. An MSA is a large population nucleus combined with
adjacent communities that have a high degree of economic and
social integration with the nucleus. Each MSA has one or more
central communities containing the area's main population
concentration. In New England, metropolitan areas consist
of cities and towns rather than whole counties.
Age
The respondent was asked to report the age
of each family member as of the date of the Round 1 interview.
Education
Respondents were asked to report the highest
grade or year of schooling ever completed by each family member
18 years of age and over as of the date of the Round 1 interview.
There was a small amount of item nonresponse for education
(1.40 percent among Hispanics, 1.17 percent among blacks,
and .76 percent among whites). Within each racial/ethnic group,
a correction was applied to adjust for item nonresponse so
that the distribution of educational levels for each group
adds to 100.0 percent.
Family Wage Earner
A family was defined as a group of people
living together who were related to one another by blood,
marriage, or adoption. Presence of a family wage earner was
defined as having a person living in the family at the time
of the Round 1 interview who was age 16 or over and had a
paying job.
Health Insurance Status
The household respondent was asked if, between
January 1, 1996, and the time of the Round 1 interview, anyone
in the family was covered by any of the sources of public
and private health insurance coverage discussed in the following
paragraphs. For this report, Medicare and CHAMPUS/CHAMPVA
coverage represent coverage as of the date of the Round 1
interview. (CHAMPUS and CHAMPVA are the Civilian Health and
Medical Programs for the Uniformed Services and Veterans'
Affairs.) All other sources of insurance represent coverage
at any time during the Round 1 reference period. Persons counted
as uninsured were uninsured throughout the Round 1 reference
period. For additional details on health insurance status
measures in MEPS, see Vistnes and Monheit (1997).
Public Coverage
For this report, individuals are considered
to have public coverage only if they met both of the following
criteria:
- They were not covered by private insurance.
- They were covered by one of the following
public programs: Medicare, Medicaid, CHAMPUS/CHAMPVA, or
other public hospital/physician coverage.
Private Health Insurance
Private health insurance is defined for
this report as insurance that provides coverage for hospital
and physician care. Insurance that provides coverage for a
single service only, such as dental or vision coverage, is
not counted.
Uninsured
The uninsured
are defined as persons not covered by Medicare, CHAMPUS/CHAMPVA,
Medicaid, other public
hospital/physician programs, or private hospital/physician
insurance throughout the entire Round 1 reference period.
Individuals covered only by noncomprehensive State-specific
programs (e.g., Maryland Kidney Disease Program, Colorado
Child Health Plan) or private single-service plans (e.g.,
coverage for dental or vision care only, coverage for accidents
or specific diseases) are not considered to be insured.
Sample Design and
Accuracy of Estimates
The sample selected for the 1996 MEPS, a
subsample of the 1995 NHIS, was designed to produce national
estimates that are representative of the civilian noninstitutionalized
population of the United States. Round 1 data were obtained
for approximately 9,400 households in MEPS-comprising 23,612
individuals-which results in a survey response rate of 78
percent. This figure reflects participation in both NHIS and
MEPS.
The statistics presented in this report
are affected by both sampling error and sources of nonsampling
error, which include nonresponse bias, respondent reporting
errors, and interviewer effects. For a detailed description
of the MEPS survey design, the adopted sample design, and
methods used to minimize sources of nonsampling error, see
J. Cohen (1997), S. Cohen (1997), and Cohen, Monheit, Beauregard,
et al. (1996). The MEPS person-level estimation weights include
nonresponse adjustments and poststratification adjustments
to population estimates derived from the March 1996 Current
Population Survey based on cross-classifications by region,
age, race/ethnicity, and gender.
Tests of statistical
significance were used to determine whether the differences
between populations exist
at specified levels of confidence or whether they occurred
by chance. Differences were tested using Z-scores having asymptotic
normal properties at the .05 level of significance. Unless
otherwise noted, only statistically significant differences
between estimates are discussed in the text.
Rounding
Estimates presented in the tables were rounded
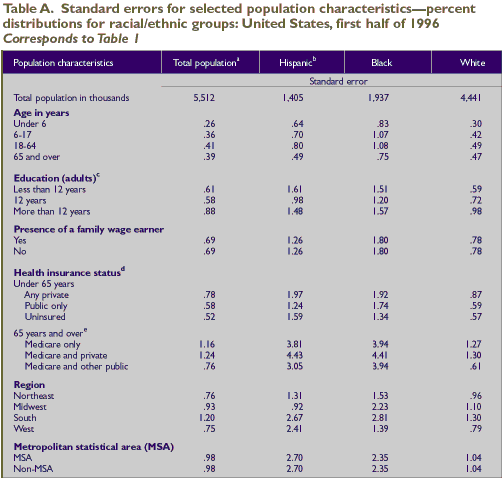
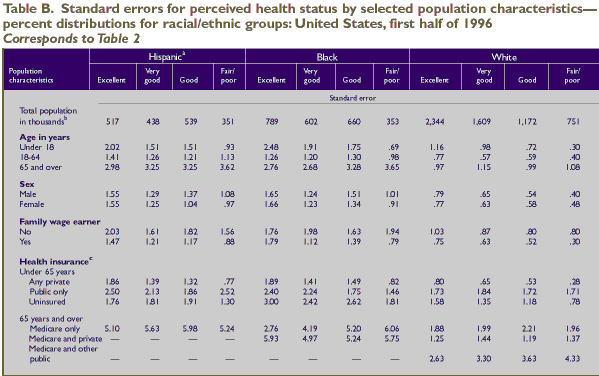
to the nearest .1 percent. Standard errors, presented in Tables
A-E, were rounded to the
nearest .01. Therefore, some of the estimates for population
totals of subgroups presented in the tables will not add exactly
to the overall estimated population total.
^top
Standard Error Tables
- In addition
to whites, blacks, and Hispanics, total population figures
include American Indians, Alaska
Natives, and Asian or Pacific Islanders.
- Includes Hispanics
of all races; the other race/ethnicity categories exclude
Hispanics.
- Educational
level of persons 18 years of age and over.
- Within each
racial/ethnic group, a correction was applied to adjust
totals for a small amount of item
nonresponse on education.
- Health insurance
status refers to health insurance during the first half
of 1996. CHAMPUS/CHAMPVA
(Armed-Forces-related coverage) is classified as public
insurance.
- The small
number of individuals age 65 and over who did not have
Medicare are excluded from the
analysis.
Note: Restricted to civilian noninstitutionalized
population.
Source: Center for Financing, Access,
and Cost Trends, Agency for Health Care Policy and Research:
Medical Expenditure Panel Survey Household Component, 1996
(Round 1).
^top
- Includes Hispanics of all races; the
other race/ethnicity categories exclude Hispanics.
- Within each racial/ethnic group,
a correction was applied to adjust totals for a small amount
of item nonresponse
on health status.
- Health insurance status refers
to health insurance during the first half of 1996. CHAMPUS/CHAMPVA
(Armed-Forces-related
coverage) is classified as public insurance.
- Sample size is too small to support reliable estimation.
Note: Restricted
to civilian noninstitutionalized population.
Source: Center for Financing, Access,
and Cost Trends, Agency for Health Care Policy and Research:
Medical Expenditure Panel Survey Household Component, 1996
(Round 1).
^top
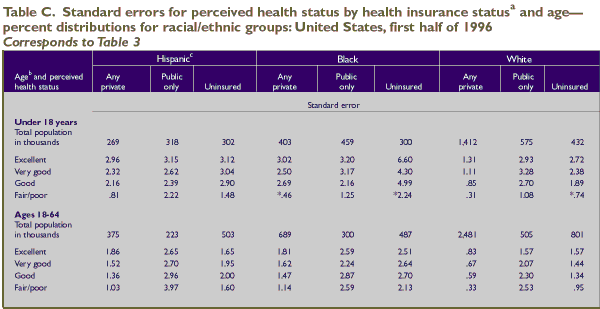
- Health insurance
status refers to health insurance during the first half
of 1996. CHAMPUS/CHAMPVA
(Armed-Forces-related coverage) is classified as public
insurance.
- Because of
small numbers, people 65 and over are not included.
- Includes Hispanics
of all races; the other race/ethnicity categories exclude
Hispanics.
- Relative standard error is greater than
30 percent.
Note: Restricted to civilian noninstitutionalized
population.
Source: Center for Financing, Access,
and Cost Trends, Agency for Health Care Policy and Research:
Medical Expenditure Panel Survey Household Component, 1996(Round
1).
^top
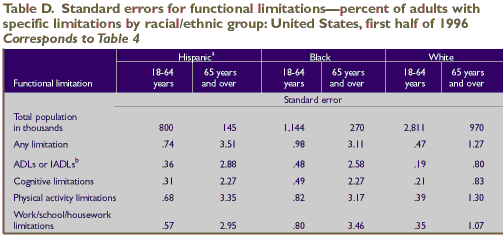
- Includes Hispanics
of all races; the other race/ethnicity categories exclude
Hispanics.
- Activities
of daily living (ADLs) include activities such as bathing
and dressing. Instrumental activities
of daily living (IADLs) include activities such as shopping
and paying bills.
Note: Restricted to civilian noninstitutionalized
population. Because of small numbers,
children under age 18 are not included.
Source: Center for Financing, Access,
and Cost Trends, Agency for Health Care Policy and Research:
Medical Expenditure Panel Survey Household Component, 1996
(Round 1).
^top
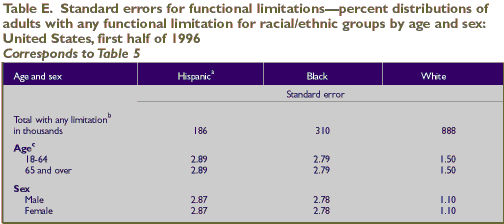
- Includes Hispanics of all races; the
other race/ethnicity categories exclude Hispanics.
- Any limitation includes activities of
daily living such as bathing and dressing, instrumental
activities of daily living such as shopping and paying bills,
cognitive limitations, physical activity limitations, and
limitations in the ability to work at a job, go to school,
or do housework.
- Because of small numbers, children under
age 18 are not included.
Note: Restricted to civilian noninstitutionalized
population.
Source: Center for Financing, Access,
and Cost Trends, Agency for Health Care Policy and Research:
Medical Expenditure Panel Survey Household Component, 1996
(Round 1).
^top
Notes
1 Formerly with the
Agency for Health Care Policy and Research.
2 The
ethnic category "Hispanic" can
include people of all races. Therefore, the categories "black" and "white" exclude
any people identified as being of Hispanic origin or ancestry.
See the technical appendix for a more detailed description
of racial/ethnic classifications.
^top
Suggested
Citation:
Weigers, M. E. and Drilea, S. K. Research Findings #10: Health Status and Limitations: A Comparison of Hispanics, Blacks, and Whites, 1996. Ocotber
1999. Agency
for Healthcare Research and Quality, Rockville,
MD.
http://www.meps.ahrq.gov/data_files/publications/rf10/rf10.shtml
|
|
