Skip to main content

|
||||||||||||||
|
|
||||||||||||||
RESEARCH FINDINGS #48:
|
|||||||||||||||||||||||||||||||||||||||||||||||||||||||||||||||||||||||||||||||||||||||||||||||||||||||||||||||||||||||||||||||||||||||||||||||||||||||||||||||||||||||||||||||||||||||||||||||||||||||||||||||||||||||||||||||||||||||||||||||||||||||||||||||||||||||||||||||||||||||||||||||||||||||||||||||||||||||||||||||||||||||||||||||||||||||||||||||||||||||||||||||||||||||||||||||||||||||||||||||||||||||||||||||||||||||||||||||||||||||||||||||||||||||||||||||||||||||||||||||||||||||||||||||||||||||||||||||||||||||||||||||||
| May 2021 | |||||||||||||||||||||||||||||||||||||||||||||||||||||||||||||||||||||||||||||||||||||||||||||||||||||||||||||||||||||||||||||||||||||||||||||||||||||||||||||||||||||||||||||||||||||||||||||||||||||||||||||||||||||||||||||||||||||||||||||||||||||||||||||||||||||||||||||||||||||||||||||||||||||||||||||||||||||||||||||||||||||||||||||||||||||||||||||||||||||||||||||||||||||||||||||||||||||||||||||||||||||||||||||||||||||||||||||||||||||||||||||||||||||||||||||||||||||||||||||||||||||||||||||||||||||||||||||||||||||||||||||||||
| Didem M. Bernard, PhD, Thomas M. Selden, PhD, and Zhengyi Fang, MS
|
|||||||||||||||||||||||||||||||||||||||||||||||||||||||||||||||||||||||||||||||||||||||||||||||||||||||||||||||||||||||||||||||||||||||||||||||||||||||||||||||||||||||||||||||||||||||||||||||||||||||||||||||||||||||||||||||||||||||||||||||||||||||||||||||||||||||||||||||||||||||||||||||||||||||||||||||||||||||||||||||||||||||||||||||||||||||||||||||||||||||||||||||||||||||||||||||||||||||||||||||||||||||||||||||||||||||||||||||||||||||||||||||||||||||||||||||||||||||||||||||||||||||||||||||||||||||||||||||||||||||||||||||||
Highlights
|
|||||||||||||||||||||||||||||||||||||||||||||||||||||||||||||||||||||||||||||||||||||||||||||||||||||||||||||||||||||||||||||||||||||||||||||||||||||||||||||||||||||||||||||||||||||||||||||||||||||||||||||||||||||||||||||||||||||||||||||||||||||||||||||||||||||||||||||||||||||||||||||||||||||||||||||||||||||||||||||||||||||||||||||||||||||||||||||||||||||||||||||||||||||||||||||||||||||||||||||||||||||||||||||||||||||||||||||||||||||||||||||||||||||||||||||||||||||||||||||||||||||||||||||||||||||||||||||||||||||||||||||||||
IntroductionDespite the rapid increase in the number of United States residents who have received SARS-CoV-2 vaccination and the fact that all persons qualified under the terms of the applicable COVID-19 vaccine Emergency Use Authorization are now eligible to be vaccinated, concerns remain whether overall vaccination prevalence, in combination with naturally obtained immunity, will be high enough to achieve herd immunity (Mayo Clinic, 2021; Spellberg, Nielsen, & Casadevall, 2021). There is also concern that COVID-19 vaccination prevalence may be especially low among the same socioeconomic groups that are experiencing disproportionate COVID-19 morbidity and mortality. Emerging evidence suggests that COVID-19 vaccination prevalence is below average among some racial and ethnic minority groups (The Centers for Disease Control and Prevention [CDC], 2021; Ndugga et al., 2021) and among adults with low incomes (Goldhill, 2021). The initial scarcity of the COVID-19 vaccine and the logistical challenges of launching such a massive public health effort may be factors in low vaccination prevalence among minorities and lower-income adults. These differences may also reflect in part the composition of early vaccine priority groups with respect to race, ethnicity, and poverty level (Selden, Berdahl, & Fang, 2021). Nevertheless, it may well also be that the early differences in COVID-19 vaccination prevalence reflect longstanding patterns of lower vaccination prevalence, reflecting a wide range of historical, cultural, social, and political factors, among non-Hispanic Blacks, Hispanics, and people with low income, as has been observed for influenza vaccination (Planalp & Hest, 2021; CDC, 2019).An important question is whether adults with increased risk of severe COVID-19 are more or less likely than other adults to receive the COVID-19 vaccine. On the one hand, vaccination prevalence in this group might tend to be higher than average, because patients and their providers may view the underlying health issues as factors increasing the benefits of vaccination. In addition, socioeconomic groups that have historically experienced below-average access to and use of medical care are disproportionately represented among adults with increased risk of severe COVID-19. For example, COVID-19 risk factors like obesity, diabetes, and heart disease occur disproportionately among racial and ethnic groups that have below-average vaccination prevalence-both for influenza (Planalp & Hest, 2021; CDC, 2019) and now for COVID-19 (CDC, 2021; Ndugga et al., 2021; Goldhill, 2021). Prior research has found higher influenza vaccination prevalence among adults with diabetes, heart disease, asthma, other respiratory conditions, or cancer (other than non-melanoma skin cancer)-conditions that are some of the factors associated with increased risk of severe COVID-19 (CDC, 2018; O'Halloran et al., 2016; Lu et al., 2013; Lu et al., 2019). This Research Findings report uses data collected prior to the ongoing COVID-19 pandemic to examine influenza vaccination prevalence among adults with risk factors that have now been associated with increased risk of severe COVID-19. Examining influenza vaccination prevalence within this key population subgroup may yield insights into COVID-19 vaccination prevalence; however, there may also be important differences between influenza vaccination and COVID-19 vaccination with respect to price (the COVID-19 vaccine being free), availability (with new vaccination centers opening at a rapid pace), and perceived benefit from vaccination (with COVID-19 posing a greater risk to unvaccinated persons than influenza). Estimates in this Research Findings report were based on data from the 2016 Medical Expenditure Panel Survey (MEPS), a household survey of the civilian noninstitutionalized population that is sponsored by the Agency for Healthcare Research and Quality (AHRQ, 2019). MEPS does not include nursing home residents or adults who are incarcerated, two groups with particularly high prevalence of COVID-19 morbidity and mortality (Henry J. Kaiser Family Foundation, 2021; Saloner et al., 2020). We examined self-reported influenza vaccination over the past 12 months among adults age 18 and older as of the end of 2016. Because past-year influenza vaccination information was collected in the early months of 2017, the prior 12 months pertains to vaccinations that would have likely been received during the last several months of 2016 (some responses, however, might have pertained to influenza vaccinations received as recently as early 2017 or as far back as early 2016). While the influenza season that began in late 2016 was fairly typical in terms of hospitalizations and mortality, the prior influenza season (beginning in late 2015) had below-average influenza-related mortality (CDC, 2020a), potentially tending to reduce 2016 vaccination prevalence. To identify adults with increased (or potentially increased) risk of severe COVID-19, we applied CDC-defined risk factors (CDC, 2020b) to MEPS data on age, obesity, health conditions, and smoking (see Definitions section below). We identified three adult risk groups: adults at increased risk of severe COVID-19, lower-risk adults who live with increased-risk adults, and other lower-risk adults (Selden & Berdahl, 2020; Selden, Berdahl, & Fang, 2020). We examined the socioeconomic and geographic dimensions of age, sex, race and ethnicity, education level, poverty level, health insurance coverage, Census division, and urbanicity. |
|||||||||||||||||||||||||||||||||||||||||||||||||||||||||||||||||||||||||||||||||||||||||||||||||||||||||||||||||||||||||||||||||||||||||||||||||||||||||||||||||||||||||||||||||||||||||||||||||||||||||||||||||||||||||||||||||||||||||||||||||||||||||||||||||||||||||||||||||||||||||||||||||||||||||||||||||||||||||||||||||||||||||||||||||||||||||||||||||||||||||||||||||||||||||||||||||||||||||||||||||||||||||||||||||||||||||||||||||||||||||||||||||||||||||||||||||||||||||||||||||||||||||||||||||||||||||||||||||||||||||||||||||
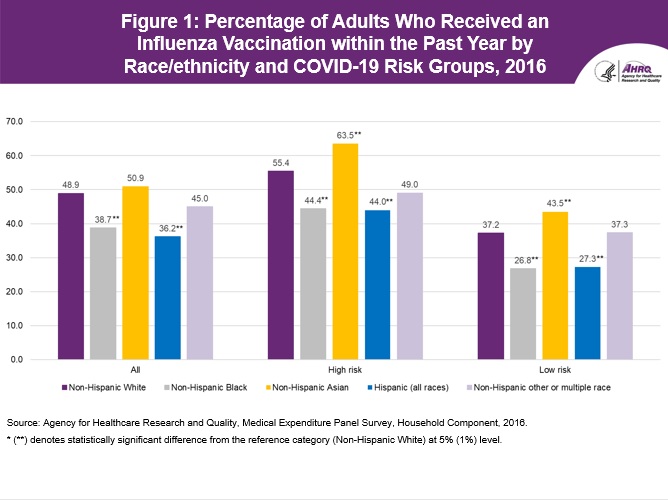
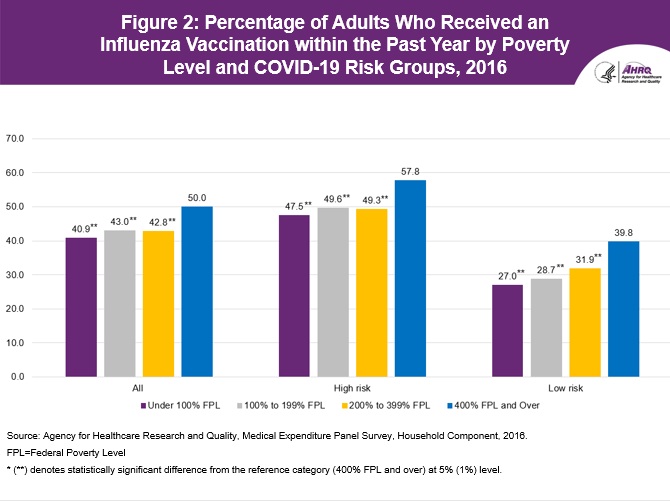
FindingsAll adultsTable 1 presents estimates of influenza vaccination prevalence for the full civilian noninstitutionalized adult population. Overall, there were 249.0 million adults in this population in 2016. The overall influenza vaccination rate was 45.7 percent. Corresponding estimates of influenza vaccination prevalence were 41.7 percent in the Behavioral Risk Factor Surveillance System and 43.4 percent in the National Health Interview Survey (CDC, 2019). Patterns across sex, age, race and ethnicity, and income mirror those found elsewhere in the influenza vaccination prevalence literature (Planalp & Hest, 2021; CDC, 2019). Vaccination prevalence among women was 9.6 percentage points higher than among men. Vaccination prevalence was 72.3 percent among adults age 65 and older, versus 32.0 percent among adults age 18 to 34. Vaccination prevalence among non-Hispanic White adults was 10.2 percentage points greater than among non-Hispanic Black adults and 12.7 percentage points greater than among Hispanic adults (see also figure 1). And adults with family incomes of 400 percent of the federal poverty level (FPL) and higher had vaccination prevalence that was 9.1 percentage points higher than those with family incomes below the FPL (see also figure 2). We observed little difference across urbanicity, whereas the range of vaccination prevalence across Census divisions was 8.7 percentage points, from New England at 51.4 percent to East South Central at 42.7 percent. Influenza vaccination by risk of severe COVID-19 The bottom portion of table 1 presents influenza vaccination prevalence for subgroups defined by the risk factors we used to identify persons at increased risk of severe COVID-19. Groups were not mutually exclusive, so that some adults are in more than one category. Adults who smoked tobacco were the only group with below-average influenza vaccination prevalence. All the other risk factors, apart from obesity, were associated with substantially above-average vaccination prevalence. Table 2 presents vaccination prevalence by socioeconomic group separately for adults with at least one CDC-defined risk factor for increased (or potentially increased) risk of severe COVID-19 versus all adults with lower-risk. Overall, 152.4 million adults had increased risk versus 96.6 million adults with lower risk. Vaccination prevalence among adults who were at increased risk of severe COVID-19 was 52.5 percent compared to 34.9 percent among adults with lower risk of severe COVID-19. Looking across socioeconomic characteristics and geographic location, we observed many of the same patterns in both risk groups. There was a somewhat steeper age gradient for increased-risk adults, with statistically significant difference-in-differences between the reference category of ages 55 to 64 and ages 18 to 34 and ages 35 to 44, for increased-risk versus lower-risk adults. Also, among adults under age 65, the difference between percentages of adults with past-year influenza vaccination for those with public versus private health insurance coverage was smaller for increased-risk adults than for lower-risk adults. In contrast, we saw very similar patterns across race and ethnicity (figure 1) and across poverty levels (figure 2) for the two risk groups. The higher vaccination prevalence among non-Hispanic Asian adults becomes more apparent in results stratified by risk level than in the overall population. Among adults with increased risk of severe COVID-19, non-Hispanic Asian adults had the highest vaccination prevalence at 63.5 percent. Influenza vaccination among adults with lower risk of severe COVID-19 by presence of an adult with increased risk of severe COVID-19 in the household Adults with lower risk who live with increased-risk adults might be expected to be more likely than those who do not live with increased-risk adults to be vaccinated against influenza out of concern for their family members. However, as table 3 shows, we found that among lower-risk adults, those living in households with increased-risk adults had an average vaccination prevalence (35.4 percent) that was very similar to the average vaccination prevalence (34.5 percent) among other lower-risk adults (those who do not live in households with increased-risk adults). Moreover, we saw very similar patterns in vaccination prevalence across groups defined by socioeconomic characteristics and geographic location. |
|||||||||||||||||||||||||||||||||||||||||||||||||||||||||||||||||||||||||||||||||||||||||||||||||||||||||||||||||||||||||||||||||||||||||||||||||||||||||||||||||||||||||||||||||||||||||||||||||||||||||||||||||||||||||||||||||||||||||||||||||||||||||||||||||||||||||||||||||||||||||||||||||||||||||||||||||||||||||||||||||||||||||||||||||||||||||||||||||||||||||||||||||||||||||||||||||||||||||||||||||||||||||||||||||||||||||||||||||||||||||||||||||||||||||||||||||||||||||||||||||||||||||||||||||||||||||||||||||||||||||||||||||
Data SourceThe estimates shown in this Research Findings report were drawn from analyses conducted by the MEPS staff from the MEPS Full-Year Consolidated Public Use File HC-192 (2016). The public use files are available at https://meps.ahrq.gov/mepsweb/data_stats/download_data_files.jsp.Our analysis examined only the civilian noninstitutionalized population, thereby excluding adults in nursing homes and long-term care facilities, as well as adults who are incarcerated-groups that have experienced high COVID-19 morbidity and mortality (Henry J. Kaiser Family Foundation, 2021; Saloner et al., 2020). Our data are from 2016 and therefore do not measure any changes in income, health insurance, or influenza vaccination prevalence that may have occurred in response to the pandemic. |
|||||||||||||||||||||||||||||||||||||||||||||||||||||||||||||||||||||||||||||||||||||||||||||||||||||||||||||||||||||||||||||||||||||||||||||||||||||||||||||||||||||||||||||||||||||||||||||||||||||||||||||||||||||||||||||||||||||||||||||||||||||||||||||||||||||||||||||||||||||||||||||||||||||||||||||||||||||||||||||||||||||||||||||||||||||||||||||||||||||||||||||||||||||||||||||||||||||||||||||||||||||||||||||||||||||||||||||||||||||||||||||||||||||||||||||||||||||||||||||||||||||||||||||||||||||||||||||||||||||||||||||||||
DefinitionsInfluenza vaccination For each person age 18 and older, MEPS asks how long it has been since receiving an influenza vaccination. In this Research Findings report, we examined the prevalence of having received an influenza vaccination within the past year. Because this question was asked in early 2017, the prior year approximately spanned early 2016 to early 2017. Population estimates use the full MEPS sample, whereas influenza vaccination estimates were constructed excluding the 8.9 percent of responses with missing values. Age Age was categorized based on the person's age at the end of the calendar year (or the last time a person was observed, for those leaving the MEPS sample during the year due to reasons including death, institutionalization, or becoming an active-duty member of the military). Race-ethnicity Race and ethnicity were defined for respondents whose single reported race was White, Black, or Asian, and for respondents of Hispanic ethnicity (any race). The remaining racial and ethnic category combines all non-Hispanic adults with other race or multiple races. Health insurance status Individuals ages 18-64 were classified into the following three insurance categories, based on household responses to health insurance status questions:
Education was coded based on the data regarding the highest degree obtained and years of education completed. Adults without a high school diploma or other equivalent credential (or, if highest degree is missing, then less than 12 years of education) were coded less than high school. Adults with a high school diploma or General Educational Development (GED) certificate and less than 13 years of education (or, if highest degree was missing, then 12 years of education) were coded as high school or GED. Remaining adults, with a college degree or with a high school diploma or GED certificate and more than 12 years of education, were coded as some college. We excluded from estimates by education level the small number of cases missing education data (see note to each table for percentage of cases affected). Poverty Four income groups were defined based on total family income as a percentage of the FPL: 1) under 100 percent of FPL, 2) 100-199 percent of FPL, 3) 200-399 percent of FPL, and 4) 400 percent of FPL and higher. Family income was constructed by summing all sources of income across all family members. Next, total family income value was divided by the appropriate poverty threshold, based on family size and composition. Health risk measures Using the risk factors listed in CDC (2020b), we classified persons as being at increased risk of severe COVID-19 if they had obesity (body mass index of 30 kg/m2 or greater); age greater than or equal to 65; or any of the following treated conditions: diabetes, cancer (other than non-melanoma skin cancers), emphysema or other chronic obstructive pulmonary disease (COPD), kidney disease, or coronary heart disease (Selden & Berdahl, 2020, 2021; Selden, Berdahl, & Fang, 2020, 2021). We also included in our increased risk group current smokers and those with treated asthma or high blood pressure-factors identified by the CDC as potentially placing adults at increased risk of severe COVID-19. We used MEPS data on current smoking even though it was missing for 12.9 percent of all adults. Of these, 41.9 percent had other factors associated with increased risk of severe COVID-19, so the absence of smoking data did not affect our categorization of risk. We classified the remaining cases with missing smoking status as adults with lower risk. Based on smoking prevalence among persons with non-missing current smoking data and no other risk factors, we estimated that approximately 2.7 percent of adults classified as having lower risk may have been current smokers who should have been classified as adults with increased risk of severe COVID-19. Although we believe our measure of increased risk covers most of the populations identified by CDC (2020b), we did not include all risk factors listed by CDC. We were unable to include Down syndrome as a risk factor, despite the prevalence of Down syndrome in the population (CDC, 2020c), because MEPS measures conditions associated with medical care, and no MEPS participants were reported to have received medical treatment for Down syndrome in 2016. Nor do we include relatively uncommon conditions such as solid organ transplants or immunocompromised states. We did not include HIV over concerns about self-reporting this condition in a household survey. Although we did not include cerebrovascular disease, many adults in this group are already classified as high risk due to their age, obesity, or high blood pressure. Also, we did not include pregnancy, despite this being a more prevalent CDC risk factor. According to the CDC, pregnancy is listed as a risk factor even though the relative youth of most pregnant women places them in a low overall risk category (albeit higher than similar-age women who are not pregnant). Two factors complicating the use of MEPS pregnancy information for our study are that we can observe pregnancies only when they are listed as conditions for which medical care is received (including deliveries in medical settings), and pregnancies that resulted in live births prior to the fall vaccination season would not have played a role in subsequent influenza vaccination decisions. Risk status of adults living in same household Households were defined as persons who lived together at any point between January 1 and the first interview of the calendar year. One exception was persons who moved elsewhere in the United States during this period (we count them as forming separate households). Households also included persons who joined MEPS after the first interview of the year. We used this definition of household to define two groups of lower-risk adults: those who lived in households with increased-risk adults and other lower-risk adults (those who did not live in households with increased-risk adults). Adults not co-residing with other adults were among those classified as not living with increased-risk adults. As noted above, not all respondents provided information on current smoking. For this reason, a small number of lower-risk adults whom we classified as not living in households with increased-risk adults may in fact have lived with adults with increased risk of severe COVID-19 due to (unreported) current smoking. Urbanicity We applied urban-rural continuum codes (United States Department of Agriculture, 2013) to define three levels of urbanization: one comprising counties in metropolitan statistical areas (MSAs), one for non-metropolitan counties that are adjacent to MSAs, and then other (more rural) counties. |
|||||||||||||||||||||||||||||||||||||||||||||||||||||||||||||||||||||||||||||||||||||||||||||||||||||||||||||||||||||||||||||||||||||||||||||||||||||||||||||||||||||||||||||||||||||||||||||||||||||||||||||||||||||||||||||||||||||||||||||||||||||||||||||||||||||||||||||||||||||||||||||||||||||||||||||||||||||||||||||||||||||||||||||||||||||||||||||||||||||||||||||||||||||||||||||||||||||||||||||||||||||||||||||||||||||||||||||||||||||||||||||||||||||||||||||||||||||||||||||||||||||||||||||||||||||||||||||||||||||||||||||||||
About MEPS-HCThe Medical Expenditure Panel Survey-Household Component (MEPS-HC) collects nationally representative data on healthcare use, expenditures, sources of payment, and insurance coverage for the U.S. civilian noninstitutionalized population. The MEPS-HC is cosponsored by the Agency for Healthcare Research and Quality (AHRQ) and the National Center for Health Statistics (NCHS). More information about MEPS-HC can be found on the MEPS website at https://www.meps.ahrq.gov/mepsweb. |
|||||||||||||||||||||||||||||||||||||||||||||||||||||||||||||||||||||||||||||||||||||||||||||||||||||||||||||||||||||||||||||||||||||||||||||||||||||||||||||||||||||||||||||||||||||||||||||||||||||||||||||||||||||||||||||||||||||||||||||||||||||||||||||||||||||||||||||||||||||||||||||||||||||||||||||||||||||||||||||||||||||||||||||||||||||||||||||||||||||||||||||||||||||||||||||||||||||||||||||||||||||||||||||||||||||||||||||||||||||||||||||||||||||||||||||||||||||||||||||||||||||||||||||||||||||||||||||||||||||||||||||||||
ReferencesAgency for Healthcare Research and Quality. (2019). MEPS HC-192: 2016 full-year consolidated data file. Retrieved April 7, 2020, from https://meps.ahrq.gov/mepsweb/data_stats/download_data_files_detail.jsp?cboPufNumber=HC-192The Centers for Disease Control and Prevention. (2018). Vaccination coverage among adults in the United States, National Health Interview Survey, 2017. Accessed April 20, 2021, at https://www.cdc.gov/vaccines/imz-managers/coverage/adultvaxview/pubs-resources/NHIS-2017.html The Centers for Disease Control and Prevention. (2019). Flu vaccination coverage, United States, 2018-19 influenza season. Accessed February 27, 2021. https://www.cdc.gov/flu/fluvaxview/coverage-1819estimates.htm The Centers for Disease Control and Prevention. (2020a). Disease burden of influenza. Updated October 5, 2020. https://www.cdc.gov/flu/about/burden/index.html The Centers for Disease Control and Prevention. (2020b). People at increased risk and other people who need to take extra precautions. Updated March 15, 2021. https://www.cdc.gov/coronavirus/2019-ncov/need-extra-precautions/index.html The Centers for Disease Control and Prevention. (2020c). Data and statistics on Down syndrome. Updated October 23, 2020. https://www.cdc.gov/ncbddd/birthdefects/downsyndrome/data.html The Centers for Disease Control and Prevention. (2021). Demographic characteristics of people receiving COVID-19 vaccinations in the United States. Updated April 20, 2021. https://covid.cdc.gov/covid-data-tracker/#vaccination-demographic Goldhill, O. (2021, February 11). Covid-19 vaccination rates follow the money in states with the biggest wealth gaps, analysis shows. Accessed February 28, 2021. https://www.cdc.gov/ncbddd/birthdefects/downsyndrome/data.html Henry J. Kaiser Family Foundation (KFF). (2021, May 4). State COVID-19 data and policy actions [Internet]. KFF, San Francisco, CA. https://www.statnews.com/2021/02/11/covid19-vaccination-rates-follow-the-money-in-states-with-biggest-wealth-gaps Lu, P. J., Gonzalez-Feliciano, A., Ding, H., Bryan, L. N., Yankey, D., Monsell, E. A., Greby, S. M., & Euler, G. L. (2013). Influenza A (H1N1) 2009 monovalent and seasonal influenza vaccination among adults 25 to 64 years of age with high-risk conditions--United States, 2010. American Journal of Infection Control, 41(8), 702-709. Lu, P. J., Hung, M. C., O'Halloran, A. C., Ding, H., Srivastav, A., Williams, W. W., & Singleton, J. A. (2019). Seasonal influenza vaccination coverage trends among adult populations, U.S., 2010-2016. American Journal of Preventive Medicine, 57(4), 458-469. Mayo Clinic. (2021, March 3). Herd immunity and COVID-19 (coronavirus): What you need to know. https://www.mayoclinic.org/diseases-conditions/coronavirus/in-depth/herd-immunity-and-coronavirus/art-20486808 Ndugga, N., Pham, O., Hill, L., Artiga, S., & Mengistu, S. (2021, February 18). Latest data on COVID-19 vaccinations race/ethnicity. Kaiser Family Foundation. Retrieved February 28, 2021, from https://www.kff.org/coronavirus-covid-19/issue-brief/latest-data-on-covid-19-vaccinations-race-ethnicity O'Halloran A. C., Lu, P. J., Williams, W. W., Bridges, C. B., & Singleton, J. A. (2016). Influenza vaccination coverage among people with high-risk conditions in the U.S. American Journal of Preventive Medicine, 50(1), e15-e26. Planalp, C., & Hest, R. (2021) Anticipating COVID-19 vaccination challenges through flu vaccination patterns. State Health Access Data Assistance Center (SHADAC). https://www.shadac.org/publications/anticipating-covid-19-vaccination-challenges-through-flu-vaccination-patterns Saloner, B., Parish, K., Ward, J., DiLaura, G., & Dolovich, S. (2020). COVID-19 cases and deaths in federal and state prisons. JAMA, 324(6), 602-603. https://doi.org/10.1001/jama.2020.12528 Selden, T. M., & Berdahl, T. A. (2020). COVID-19 and racial/ethnic disparities in health risk, employment, and household composition. Health Affairs (Project Hope), 39(9), 1624-1632https://doi.org/10.1001/jama.2020.12528 Selden, T. M., & Berdahl, T. A. (2021). Risk of severe COVID-19 among workers and their household members. JAMA Internal Medicine, 181(1), 120-122. https://doi.org/10.1001/jama.2020.12528 Selden, T. M., Berdahl, T. A., & Fang, Z. (2020). The risk of severe COVID-19 within households of school employees and school-age children. Health Affairs (Project Hope), 39(11), 2002-2009. https://doi.org/10.1377/hlthaff.2020.01536 Selden, T. M., Berdahl, T. A., and Fang, Z. COVID-19 Vaccination Prioritization Scenarios and Their Effects on Eligibility by Poverty Level, Race, and Ethnicity. Research Findings #46. 2021. Agency for Healthcare Research and Quality, Rockville, MD. Spellberg, B., Nielsen, T. B., & Casadevall, A. (2021). Antibodies, immunity, and COVID-19. JAMA Internal Medicine, 181(4), 460-462. https://doi.org/10.1001/jamainternmed.2020.7986 United States Department of Agriculture. (2013). Rural-Urban Continuum Codes. https://www.ers.usda.gov/data-products/rural-urban-continuum-codes.aspx |
|||||||||||||||||||||||||||||||||||||||||||||||||||||||||||||||||||||||||||||||||||||||||||||||||||||||||||||||||||||||||||||||||||||||||||||||||||||||||||||||||||||||||||||||||||||||||||||||||||||||||||||||||||||||||||||||||||||||||||||||||||||||||||||||||||||||||||||||||||||||||||||||||||||||||||||||||||||||||||||||||||||||||||||||||||||||||||||||||||||||||||||||||||||||||||||||||||||||||||||||||||||||||||||||||||||||||||||||||||||||||||||||||||||||||||||||||||||||||||||||||||||||||||||||||||||||||||||||||||||||||||||||||
Suggested CitationBernard, D. M., Selden, T. M., Fang, Z. Influenza Vaccination Prevalence Among Adults with Increased Risk of Severe COVID-19.Research Findings #48. May 2021. Agency for Healthcare Research and Quality, Rockville, MD. https://meps.ahrq.gov/data_files/publications/rf48/rf48.pdf |
|||||||||||||||||||||||||||||||||||||||||||||||||||||||||||||||||||||||||||||||||||||||||||||||||||||||||||||||||||||||||||||||||||||||||||||||||||||||||||||||||||||||||||||||||||||||||||||||||||||||||||||||||||||||||||||||||||||||||||||||||||||||||||||||||||||||||||||||||||||||||||||||||||||||||||||||||||||||||||||||||||||||||||||||||||||||||||||||||||||||||||||||||||||||||||||||||||||||||||||||||||||||||||||||||||||||||||||||||||||||||||||||||||||||||||||||||||||||||||||||||||||||||||||||||||||||||||||||||||||||||||||||||
ᵃ Indicates reference category. |
|||||||||||||||||||||||||||||||||||||||||||||||||||||||||||||||||||||||||||||||||||||||||||||||||||||||||||||||||||||||||||||||||||||||||||||||||||||||||||||||||||||||||||||||||||||||||||||||||||||||||||||||||||||||||||||||||||||||||||||||||||||||||||||||||||||||||||||||||||||||||||||||||||||||||||||||||||||||||||||||||||||||||||||||||||||||||||||||||||||||||||||||||||||||||||||||||||||||||||||||||||||||||||||||||||||||||||||||||||||||||||||||||||||||||||||||||||||||||||||||||||||||||||||||||||||||||||||||||||||||||||||||||
 | |||||||||||||||||||||||||||||||||||||||||||||||||||||||||||||||||||||||||||||||||||||||||||||||||||||||||||||||||||||||||||||||||||||||||||||||||||||||||||||||||||||||||||||||||||||||||||||||||||||||||||||||||||||||||||||||||||||||||||||||||||||||||||||||||||||||||||||||||||||||||||||||||||||||||||||||||||||||||||||||||||||||||||||||||||||||||||||||||||||||||||||||||||||||||||||||||||||||||||||||||||||||||||||||||||||||||||||||||||||||||||||||||||||||||||||||||||||||||||||||||||||||||||||||||||||||||||||||||||||||||||||||||
|
|||||||||||||||||||||||||||||||||||||||||||||||||||||||||||||||||||||||||||||||||||||||||||||||||||||||||||||||||||||||||||||||||||||||||||||||||||||||||||||||||||||||||||||||||||||||||||||||||||||||||||||||||||||||||||||||||||||||||||||||||||||||||||||||||||||||||||||||||||||||||||||||||||||||||||||||||||||||||||||||||||||||||||||||||||||||||||||||||||||||||||||||||||||||||||||||||||||||||||||||||||||||||||||||||||||||||||||||||||||||||||||||||||||||||||||||||||||||||||||||||||||||||||||||||||||||||||||||||||||||||||||||||
 | |||||||||||||||||||||||||||||||||||||||||||||||||||||||||||||||||||||||||||||||||||||||||||||||||||||||||||||||||||||||||||||||||||||||||||||||||||||||||||||||||||||||||||||||||||||||||||||||||||||||||||||||||||||||||||||||||||||||||||||||||||||||||||||||||||||||||||||||||||||||||||||||||||||||||||||||||||||||||||||||||||||||||||||||||||||||||||||||||||||||||||||||||||||||||||||||||||||||||||||||||||||||||||||||||||||||||||||||||||||||||||||||||||||||||||||||||||||||||||||||||||||||||||||||||||||||||||||||||||||||||||||||||
|
| ||||||||||||||||||||||||||||||||||||||||||||||||||||||||||||||||||||||||||||||||||||||||||||||||||||||||||||||||||||||||||||||||||||||||||||||||||||||||||||||||||||||||||||||||||||||||||||||||||||||||||||||||||||||||||||||||||||||||||||||||||||||||||||||||||||||||||||||||||||||||||||||||||||||||||||||||||||||||||||||||||||||||||||||||||||||||||||||||||||||||||||||||||||||||||||||||||||||||||||||||||||||||||||||||||||||||||||||||||||||||||||||||||||||||||||||||||||||||||||||||||||||||||||||||||||||||||||||||||||||||||||||||