Research Findings
#5: Characteristics of Nursing Home Residents, 1996
Nancy A. Krauss, M.S., and Barbara M. Altman,
Ph.D. Agency for Health Care Policy and Research
Introduction
Although people residing in nursing homes
represent a small proportion of both the elderly population
and the general population with disabilities, they are an
important part of the long-term health care system. Nursing
homes primarily exist to serve members of these populations
who have severe medical and disability problems that require
nursing home care. A lack of financial resources or family
caregivers also contributes to the need for these institutions
(Congressional Budget Office, 1991).
This report, based on the 1996 Nursing
Home Component (NHC) of the Medical Expenditure Panel Survey
(MEPS) from the Agency for Health Care Policy and Research,
presents a profile of the residents of nursing homes in the
United States on January 1, 1996. Nursing homes which are
part of larger facilities that also provide independent living
and/or personal care units are included in the sample. However,
this report describes only nursing home residents, not persons
who are residents in personal care homes, assisted living
facilities, or other types of facilities that provide long-term
care.
The age distribution, race, marital status,
and other sociodemographic characteristics of nursing home
residents, along with the physical and functional characteristics
associated with their need for nursing care, are described.
The nationally representative estimates reported here are
based only on a sample of current residents. (Current residents
are sampled residents living in the sampled nursing home on
January 1, 1996, the beginning of the data collection reference
period.) Although data for the whole year were subsequently
collected for these residents, along with data on a second
sample of new admissions in 1996, the estimates in this report
represent current residents in nursing homes as of January
1, 1996. The technical appendix presents details concerning
sample selection, data collection, questionnaire items, data
editing, and statistical procedures for deriving estimates.
Definitions of terms used in this report are also included.
^top
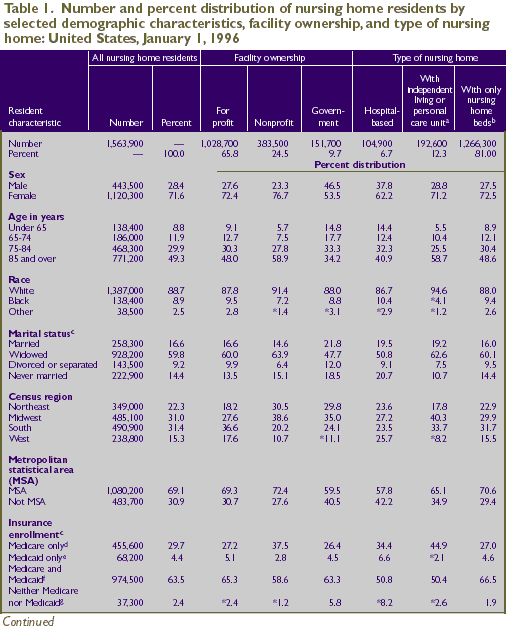
In 1996, there were approximately 1.56 million
nursing home residents in the United States (Table 1). The
majority were in private for-profit facilities (65.8 percent).
Another quarter (24.5 percent) were in private nonprofit facilities,
and the remaining 9.7 percent resided in government-owned
and operated facilities. (Government facilities include city,
county, State, Department of Veterans Affairs, and other Federal
facilities.) Most residents (81.0 percent) lived in facilities
that contained only nursing home beds. However, 12.3 percent
resided in facilities that also had independent living or
personal care beds, such as continuing care retirement communities
(CCRCs).
An examination of the demographic characteristics
of nursing home residents revealed the following:
- Women composed more than two-thirds (71.6
percent) of the total nursing home population and outnumbered
men in all facility types. However, women represented a
lower proportion of residents in government facilities (53.5
percent) than in for-profit (72.4 percent) and nonprofit
(76.7 percent) facilities.
- Approximately half of all current residents
(49.3 percent) were age 85 and over. Nonprofit nursing homes
had a larger proportion of persons age 85 and over (58.9
percent) than either for-profit (48.0 percent) or government
facilities (34.2 percent). Nursing homes with independent
living or personal care beds had larger proportions of residents
age 85 and over (58.7 percent) than did hospital-based nursing
homes (40.9 percent) or nursing homes with only nursing
home beds (48.6 percent).
- Less than a tenth (8.8 percent) of current
nursing home residents were under age 65. A larger proportion
of residents in government facilities (14.8 percent) than
in for-profit (9.1 percent) or nonprofit (5.7 percent) facilities
were under age 65. Hospital-based facilities had a larger
proportion of residents under age 65 (14.4 percent) than
did facilities with independent living or personal care
beds (5.5 percent) or facilities with only nursing home
beds (8.9 percent).
- The majority (88.7 percent) of nursing
home residents were white, 8.9 percent were black, and the
remainder were of other races. Facilities with independent
living or personal care beds had a smaller proportion of
black residents (4.1 percent) than either hospital-based
facilities or nursing homes with only nursing home beds
(10.4 percent and 9.4 percent, respectively).
- Only 16.6 percent of residents were married.
The remaining residents were widowed (59.8 percent), divorced
or separated (9.2 percent), or never married (14.4 percent).
- The smallest percentage of the nursing
home population was found in the West (15.3 percent). In
both the South and Midwest, the nursing home population
was approximately twice the size of that in the West (490,900
and 485,100, respectively, compared with 238,800).
- The largest proportion of residents in
for-profit facilities was in the South. Residents in facilities
with independent living or personal care beds were most
likely to be in the Midwest and least likely to be in the
West.
- Overall, two-thirds of the nursing home
population were in nursing homes in metropolitan areas (69.1
percent). However, the population in hospital-based facilities
was more evenly distributed, with three-fifths (57.8 percent)
in metropolitan areas and two-fifths (42.2 percent) in nonmetropolitan
areas.
^top
The insurance
data found in Table 1 indicate the insurance programs in
which residents were enrolled but
do not reflect the insurance source paying for nursing home
care. (Additional nursing home data, including data on source
of payment, are made available in the MEPS section of the
AHRQ Web site—http://www.ahrq.gov—on an ongoing
basis.) Most nursing home residents (93.2 percent) were enrolled
in Medicare, and approximately two-thirds (67.9 percent) were
enrolled in Medicaid. More than half of residents in all types
of facilities were enrolled in both Medicare and Medicaid.
Only 2.4 percent were enrolled in neither of these public
insurance programs. Persons in hospital-based facilities were
less likely than residents in other types of facilities to
be enrolled in a public insurance program.
^top
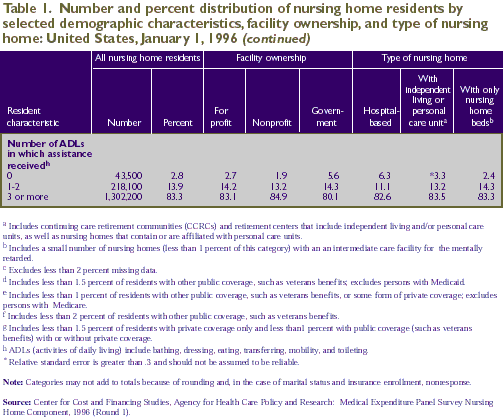
More than four-fifths (83.3 percent) of
nursing home residents received help with three or more activities
of daily living (ADLs), including bathing, dressing, toileting,
transferring from a bed or chair, feeding, and mobility (Table
1). However, a small proportion (2.8 percent) did not receive
assistance with any of these activities. Residents of hospital-based
facilities were less likely to receive assistance with ADLs
than residents in facilities with nursing home beds only.
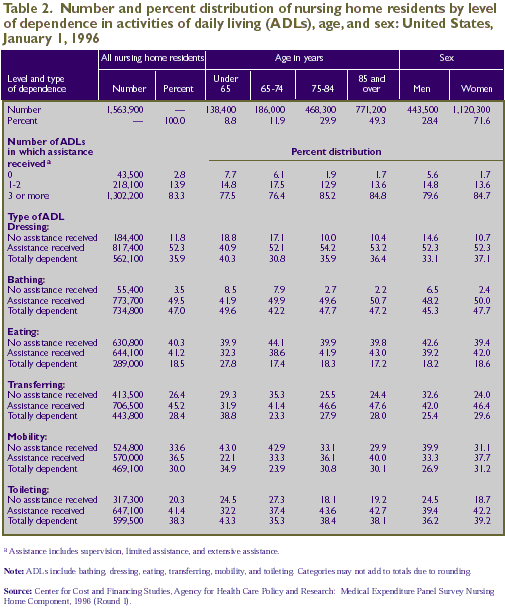
When nursing home residents did receive assistance, bathing
and dressing were the most common tasks with which they received
help (96.5 percent and 88.2 percent, respectively, as shown
in Table 2).
Data presented in Table 2 describe the
various levels of assistance received by men and women of
various ages. Findings include the following:
- Residents under age 75 were more likely
than older residents to have no ADL limitations and were
less likely to have three or more ADL limitations. Only
1.9 percent of residents ages 75-84 and 1.7 percent of residents
age 85 and over were without ADL limitations.
- Women were more likely than men to have
problems with mobility around the facility. Women also were
more likely than men to be totally dependent when transferring
(29.6 percent compared with 25.4 percent) and dressing (37.1
percent compared with 33.1 percent).
- Women nursing home residents were more
likely than men to receive help with three or more ADLs
(84.7 percent and 79.6 percent, respectively).
- Two-thirds of residents had problems
with mobility such that they received assistance getting
around the facility (36.5 percent) or were totally dependent
on others for movement within the facility (30.0 percent).
- Residents under age 65 were as likely
as residents age 75 and over to be totally dependent in
bathing, dressing, and mobility and more likely to be totally
dependent in eating and transferring.
^top
A number of factors may contribute to the
decision to place a patient in a nursing home. These are described
in some detail in the following paragraphs.
Toileting and Incontinence
Research has shown that once incontinence
occurs in an elderly person who already displays other limitations,
it is often difficult to maintain that person in the home
setting (Coward, Horne, and Peek, 1995). Table 2 indicates
that 79.7 percent of nursing home residents required assistance
with toileting needs. Assistance includes, but is not limited
to, help with transferring on and off the toilet, reminders
to use the bathroom, or help with bathroom hygiene. The residents
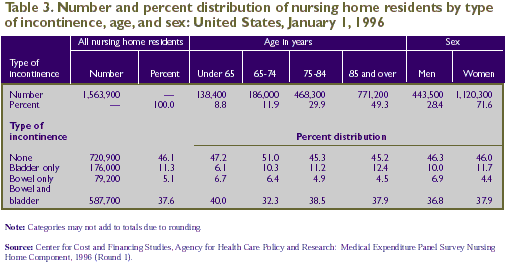
who were most dependent were those who could not control their
bowel or bladder functions at all. As shown in Table 3, more
than half of nursing home residents (54.0 percent) were incontinent.
This includes those who were bowel incontinent only (5.1 percent),
bladder incontinent only (11.3 percent), and both bowel and
bladder incontinent (37.6 percent).
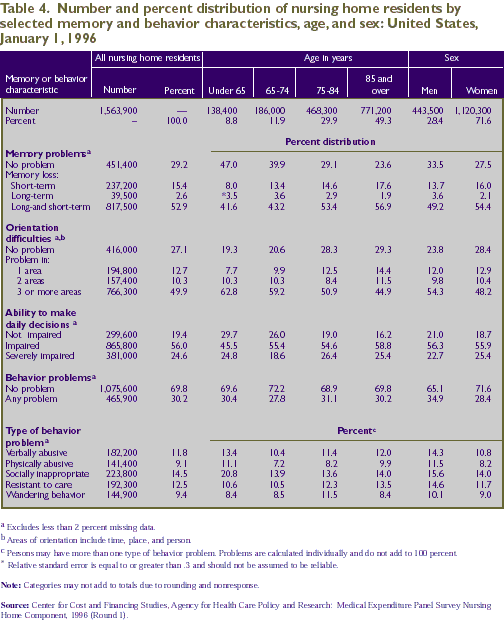
Memory and Orientation Problems
Memory loss is another important reason
that individuals are placed in nursing homes. Forgetfulness
and disorientation can be dangerous problems that require
24-hour supervision to provide for the individual's safety
and well-being. Nearly three-quarters (70.8 percent) of nursing
home residents had some form of loss in either short-term
memory, long-term memory, or both (Table 4). About the same
proportion had problems with orientation, such as knowing
where they were, what season of the year it was, or the identity
of staff members. Specific demographic characteristics associated
with these problems include the following:
- Persons over age 75 were significantly
more likely than younger nursing home residents to exhibit
problems with memory loss: 47.0 percent of residents under
age 65 and 39.9 percent ages 65-74 had no problems with
memory loss, compared with only 29.1 percent of residents
ages 75-84 and 23.6 percent of those age 85 and over.
- Nursing home residents under age 65 were
less likely than persons age 75 and over to have both short-
and long-term memory loss (41.6 percent, compared with 53.4
percent for persons 75-84 and 56.9 percent for persons 85
and over). However, they were more likely than persons age
75 and over to have problems with orientation in three or
more areas (62.8 percent, compared with 50.9 percent for
persons 75-84 and 44.9 percent for persons 85 and over).
- Men were less likely than women to have
any memory loss (33.5 percent compared with 27.5 percent),
but they were more likely than women to have a problem with
orientation in three or more areas (54.3 percent compared
with 48.2 percent).
In addition to problems
with memory loss and orientation to their surroundings, many
nursing home residents
(80.6 percent) exhibited problems making daily decisions.
While there were no significant gender differences in daily
decision making, persons ages 65-74 were less likely to be
severely impaired than persons age 75 and over.
Behavior Problems
Behavior problems
existed among nursing home residents, but they were not
as common as the cognitive
problems discussed above (Table 4). Almost a third (30.2 percent)
of nursing home residents exhibited at least one form of inappropriate
or dangerous behavior— verbally or physically abusive
behavior, socially inappropriate behavior, wandering, or resistance
to care. Overall, there were no significant differences among
age groups in behavior problems, but male residents were more
likely than female residents to have a behavior problem (34.9
percent compared with 28.4 percent).
The most frequently occurring behavior
problem was socially inappropriate behavior, such as making
disruptive sounds, inappropriate sexual behavior or disrobing
in public, smearing or throwing food or feces, and hoarding.
Some form of socially inappropriate behavior was exhibited
by 14.5 percent of the nursing home population. In comparison,
12.5 percent of residents exhibited resistance to care, 11.8
percent were verbally abusive, and 9.1 percent were physically
abusive.
As shown in Table 4, there were negligible
differences by age and gender in the overall occurrence of
behavior problems. However, specific problems were associated
more with one age or gender than another, including the following:
- Men were somewhat more likely than women
to exhibit both verbally abusive behavior (14.3 percent
compared with10.8 percent) and physically abusive behavior
(11.5 percent compared with 8.2 percent). Men also were
more likely than women to resist care (14.6 percent compared
with 11.7 percent).
- A fifth (20.8 percent) of residents under
age 65 exhibited socially inappropriate behavior, compared
with approximately 14 percent of older residents (13.9 percent
for ages 65-74, 13.6 percent for ages 75-84, and 14.0 percent
for age 85 and over).
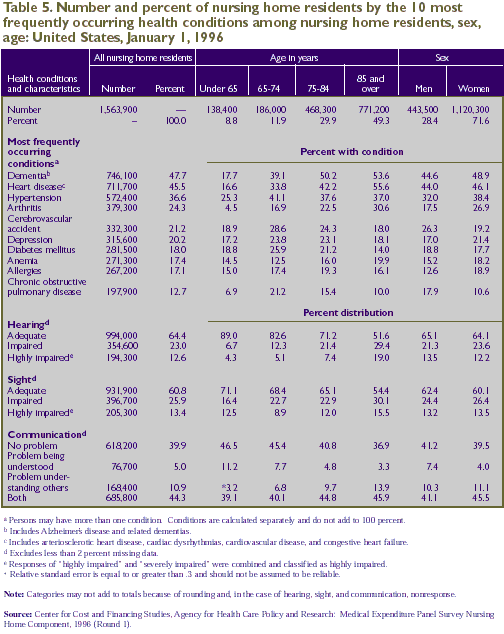
Health Conditions
Health conditions are active diagnoses
that have a relationship to current ADL status, cognitive status,
mood and behavior status, medical treatments, nurse monitoring,
or risk of death. The most frequently occurring conditions among
nursing home residents were dementias, various forms of heart
disease, hypertension, arthritis, and cerebrovascular accidents.
The data shown in Table 5 are based on the health conditions
recorded in the Minimum Data Set (MDS), a mandated record system
required for all federally certified nursing homes regardless
of the resident's payer.1 Other frequently occurring conditions
among this population were depression, diabetes, anemia, allergies,
and chronic obstructive pulmonary disease.
1 these preliminary estimates are based on the initial Round
1 data from only the MDS collected during the first 3 to 4 months
of the survey year. They are subject to adjustment when all
condition data for the full year are collected, coded, and edited.
Although these conditions were the 10 most prevalent conditions
recorded in the MDS among all residents of nursing homes on
January 1, 1996, the prevalence of these conditions varied by
age and gender. Figure 1 shows that persons under age 65 were
significantly less likely to have dementia (17.7 percent), heart
disease (16.6 percent), hypertension (25.3 percent), and arthritis
(4.5 percent) than were persons 65 and over.
Younger nursing home residents also were more heterogeneous
than those 65 and over with regard to health conditions. The
overwhelming majority (90.2 percent) of residents age 65 and
over had at least one of the five most prevalent conditions
for that age group, while only 64.8 percent of persons under
age 65 had one or more of the five most prevalent conditions
observed in that age group (Figure 2).
Gender differences in the prevalence of disease among nursing
home residents were also evident (Table 5). Women were more
likely than men to have dementia (48.9 percent compared with
44.6 percent), hypertension (38.4 percent compared with 32.0
percent), and arthritis (26.9 percent compared with 17.5 percent).
Women and men were equally likely to have some form of heart
disease, but women were less likely than men to have had a cerebrovascular
accident (19.2 percent compared with 26.3 percent) or to have
chronic obstructive pulmonary disease (10.6 percent compared
with 17.9 percent).
Other health conditions correlated with age include the following: - Close to half of all nursing home residents
(47.7 percent) had some form of dementia; more than half
of those age 85 and over had dementia (53.6 percent).
- Problems with heart disease increased
as the age of the nursing home population increased, steadily
rising from 16.6 percent of residents under age 65 to 55.6
percent of residents age 85 and over. There were no significant
differences between male and female residents.
Sensory and Communication Problems
More than a tenth (12.6 percent) of the
nursing home population had highly impaired hearing and more
than a tenth (13.4 percent) had highly impaired sight (Table
5). Persons age 85 and over were much more likely than younger
nursing home residents to have high levels of hearing impairment.
The prevalence of impaired sight varied less by age. There
were no significant differences between men and women in the
proportion with high levels of hearing or sight impairment.
Communication—understanding and being
understood—was a more common problem for nursing home
residents. More than half (60.1 percent) had some communication
problem, and 44.3 percent had difficulty with both being understood
and understanding others. Generally, the effects of age or
gender on communication problems were modest, although nursing
home residents under age 65 were less likely than those age
85 and over to have problems both understanding and being
understood or problems only in understanding.
^top
In 1996, nursing home residents were highly
dependent on assistance in performing ADLs. Most exhibited
memory loss, or orientation or decision making problems that
could make independent living dangerous. Behavior problems
were present in a smaller proportion of residents than cognitive
problems. However, communication problems occurred in more
than half of the population and could be an impediment to
proper care.
The types of medical conditions experienced
by residents varied by gender and age. Overall, nursing home
residents under age 65 had fewer of the most frequently occurring
conditions than older residents, but the younger residents
were either as dependent or more dependent on assistance with
ADLs. They were less likely to have both short- and long-term
memory problems than residents over age 65. Residents under
age 65 also were more likely than residents age 75 and over
to have severe problems with decision making and orientation.
Current nursing home residents, regardless of age or gender,
have serious problems with ADLs, continence, and behavior.
^top
Tables
^top
^top
^top
^top
^top
Figures

^top

^top
Agency for Health Care Policy and Research.
Round 1, facility-level public use file codebook. In: Medical
Expenditure Panel Survey (MEPS) NHC-001: Round 1 Sampled Facility
and Person Characteristics, March 1997 [CD-ROM]. Rockville
(MD), 1997. AHRQ Pub. No. 97-DP21.
American Hospital Association. American
Hospital Association guide to the health care field, 1996-97
edition. Chicago (IL); 1996.
Bethel J, Broene P, Sommers JP. Sample
design of the 1996 Medical Expenditure Panel Survey Nursing
Home Component. Rockville (MD): Agency for Health Care Policy
and Research; 1998. MEPS Methodology Report No. 4. AHRQ
Pub. No. 98-0042.
Congressional Budget Office (US). Policy
choices for long-term care. Washington; 1991.
Coward RT, Horne C, Peek CW. Predicting
nursing home admissions among incontinent older adults: a
comparison of residential differences across six years. The
Gerontologist 1995;35(6):732-43.
Potter DEB. Design and methods of the
1996 Medical Expenditure Panel Survey Nursing Home Component.
Rockville (MD): Agency for Health Care Policy and Research;
1998. MEPS Methodology Report No. 3. AHRQ Pub. No.
98-0041.
Shah BV, Barnwell
BG, Bieler GS. SUDAAN user's manual: software for the statistical
analysis of correlated
data. Research Triangle Park (NC): Research Triangle Institute;
1995. U.S. Bureau of the Census. Statistical
abstract of the United States: 1996 (116th edition). Washington;
1996.
^top
Data Sources and
Methods of Estimation
The data in this report were obtained from
a nationally representative sample of nursing homes from the
Nursing Home Component (NHC) of the 1996 Medical Expenditure
Panel Survey (MEPS). The sampling frame was derived from the
updated 1991 National Health Provider Inventory. The NHC was
primarily designed to provide unbiased national and regional
estimates for the population in nursing homes, as well as
estimates of these facilities and a range of their characteristics.
The sample was selected using a two-stage
stratified probability design, with facility selection in
the first stage. The second stage of selection consisted of
a sample of residents as of January 1, 1996, and a rolling
sample of persons admitted during the year (Bethel, Broene,
and Sommers, 1998). Of the 1,123 eligible nursing homes sampled
in the NHC, 85 percent responded. Estimates in this report
are based on these 952 eligible responding facilities. To
bring the sample size in line with the original design of
approximately 800 facilities by the end of Round 3, the facility
sample was subsampled at the end of Round 1. A total of 127
facilities were randomly deselected.
The MEPS NHC data analyzed here were collected
in person during the first of three rounds of data collection.
A computer-assisted personal interview (CAPI) system was used
for data collection. The Round 1 interview took place during
the period March-June 1996. The entire three-round data collection
effort took place over a 1-1/2 year period, with the reference
period being January 1, 1996, to December 31, 1996 (Potter,
1998).
The facility
questionnaire was designed to elicit information on the
complex structure of institutions
that provide residential care or treatment. Some nursing homes
or units exist within larger establishments. In such cases,
the entity that appeared on the sampling frame might be the
larger facility, the nursing home or unit within the larger
facility, or only one of several nursing units within the
larger facility. Therefore, the NHC's Round 1 facility questionnaire
was designed to identify the larger facility, each eligible
nursing home or unit within the larger establishment, and
other nonhospital residential parts. Because of this, the
point of reference for a specific question may be the sampled
nursing home or unit (hereafter referred to as "nursing
home"), a larger facility, another nonhospital residential
part of a larger facility, one or several nursing homes within
a larger facility, or a smaller subunit of the eligible nursing
home (Agency for Health Care Policy and Research, 1997).
Data on the sampled nursing homes were
obtained using a facility questionnaire administered through
CAPI to facility administrators or designated staff. Estimates
provided are preliminary and are subject to revision as more
information from other parts of the NHC becomes available.
Data in data files released to the public
have, in some instances, been masked to preserve the confidentiality
of responding nursing homes. As a result, estimates made using
the public use version of the data may differ slightly from
the estimates presented in this report.
Facility
Eligibility
Only nursing homes were eligible for inclusion
in the MEPS NHC. To be included as a nursing home, a facility
must have at least three beds and meet one of the following
criteria:
- It must have a facility or distinct portion
of a facility certified as a Medicare skilled nursing facility
(SNF).
- It must have a facility or distinct portion
of a facility certified as a Medicaid nursing facility (NF).
- It must have a facility or distinct portion
of a facility that is licensed as a nursing home by the
State health department or by some other State or Federal
agency and that provides onsite supervision by a registered
nurse or licensed practical nurse 24 hours a day, 7 days
a week (Bethel, Broene, and Sommers, 1998).
By this definition, all SNF- or NF-certified
units of licensed hospitals are eligible for the sample, as
are all Department of Veterans Affairs (VA) long-term care
nursing units. In such cases, and in the case of retirement
communities with nursing facilities, only the long-term care
nursing units(s) of the facility were eligible for inclusion
in the sample. If a facility also contained a long-term care
unit that provided assistance only with activities of daily
living (e.g., a personal care unit) or provided nursing care
at a level below that required to be classified as a nursing
facility, that unit was excluded from the sample (Potter,
1998).
Current-Residents
Sample
To allow a chance of selection for all persons
in this universe, two samples of persons were selected within
each cooperating sampled facility: (1) a cross-sectional sample
of persons who were residents on January 1, 1996 (referred
to as current residents) and (2) a sample of persons admitted
to the nursing home at any time during 1996, with no prior
admissions to an eligible nursing home during 1996 (referred
to as first admissions). This report is limited to data collected
during Round 1, so estimates are for current residents only.
For details on first-admissions sampling, refer to Bethel,
Broene, and Sommers (1998).
The interviewer in each sampled facility
compiled a list of current residents as of January 1, 1996.
Within each facility, a systematic random sample of four current
residents was drawn using the CAPI system.
The overall response rate for the current-residents
sample was 84 percent (.85 facility response rate X .99 current
response rate). To be considered a respondent, the sampled
resident had to have 75 percent of the baseline health status
items complete, and age, sex, and race had to be reported.
Forty-four eligible current residents did not meet this requirement,
and 17 sampled persons were ineligible.
Nursing Home Residents
Nursing home residents included only persons
residing in licensed parts of sampled nursing homes. Residents
of unlicensed parts of sampled facilities were excluded.
Ownership
Respondents reported the ownership type
that best described their facility (or larger part of the
facility, in situations where the sampled nursing home was
part of a larger facility), as follows:
- For-profit (i.e., individual, partnership,
or corporation).
- Private nonprofit (e.g., religious group,
nonprofit corporation).
- One of four
types of public ownership—city/county
government, State government, VA, or other Federal agency.
Respondents
also reported whether their facility was part of a chain
or group of nursing facilities
operating under common management. Three facilities whose
ownership type originally was reported as "other specify" were
recoded based on the 1996 American Hospital Association Guide
to Hospitals (American Hospital Association, 1996).
Facility Type
This variable, constructed from data from
the facility questionnaire, defines the facility's organizational
structure as one of three types:
- Hospital-based nursing home. This
indicates that the sampled nursing home was part of a hospital
or was a hospital-based Medicare SNF.
- Nursing home with independent living
or personal care unit. This category includes continuing
care retirement communities (CCRCs) and retirement centers
that have independent living and/or personal care units,
as well as nursing homes that contain personal care units.
Non-hospital-based nursing homes with a separate unit
in which personal care assistance is provided also are
included.
- Nursing home with only nursing home
beds. This category includes a small number of nursing
homes (less than 1 percent) with an intermediate care
unit for the mentally retarded (ICF-MR).
The order of
priority for coding facility type followed the sequence
listed above. Eleven facilities
initially classified as "other nursing hometype" were
recoded to the latter two categories on further review.
Census Region
Sampled nursing
homes or units were classified in one of four regions—Northeast, Midwest, South, and
West—based on their geographic location according to
the MEPS NHC sampling frame. These regions are defined by
the U.S. Bureau of the Census.
Facility Location
A metropolitan statistical area (MSA) was
defined as including (1) at least one city with 50,000 or
more inhabitants or (2) a Census Bureau-defined urbanized
area of at least 50,000 inhabitants and a total metropolitan
population of at least 100,000 (75,000 in New England) (U.S.
Bureau of the Census, 1996).
Insurance Enrollment
Main insurance enrollment
was aggregated into four mutually exclusive groups: Medicare
only, Medicaid
only, both Medicare and Medicaid, and neither Medicare nor
Medicaid. Persons covered by Medicare, Medicaid, or both may
also have had other insurance coverage, such as private insurance
or veterans benefits. Persons with neither Medicare nor Medicaid
coverage included 1.3 percent of sampled persons with private
coverage only, .7 percent of sampled persons with veterans
benefits (some of whom also had private insurance), and .4
percent of sampled persons for whom no insurance coverage
was identified. These data reflect insurance coverage only.
The actual source of payment for nursing home stays will not
be available until the release of full-year nursing home data
for 1996.
Activities of Daily Living (ADLs)
Respondents were
asked to indicate whether the sampled resident received
assistance with personal care
activities commonly known as activities of daily living. Six
activities were included in the summary ADL measure in Table
1: dressing, bathing, eating, transferring from a bed or chair,
mobility, and toileting. Of those sampled, 32 persons (less
than 1 percent of the total) were comatose and initially had
all ADLs classified as "inapplicable." These cases,
along with all cases for whom it was indicated that the "activity
did not occur" (less than 2 percent of the total), were
reclassified as "totally dependent." Persons with
missing data (not more than .5 percent of the total sample
of any ADL) were assumed to have no difficulty with activities
and were reclassified as "no assistance received." For
Table 2, persons functioning independently were classified
as "no assistance received" and persons who required
supervision or limited or extensive assistance were classified
as "assistance received."
Marital Status
Facility respondents were asked if, on January
1, 1996, the sampled person was married, widowed, divorced,
separated, or never married.
Race
Respondents were
asked if the race of each resident was best described as
American Indian, Alaska Native,
Asian or Pacific Islander, black, white, or other. Estimates
of race were collapsed into three categories: white, black,
and other. Less than .5 percent of residents initially classified
as "other" were reclassified as white. The other
race categories are not shown separately due to small sample
size.
Memory Problems
Respondents were
asked two questions about the sample resident's memory:
whether the resident had a short-term
memory problem and whether the resident had a long-term memory
problem. Responses were limited to "yes" or "no." Approximately
1.2 percent missing data (not included in Table 4) existed
for each item.
Orientation Difficulties
To assess orientation
to time, place, and person, respondents were asked whether
the sample resident
was able to recall the current season, location of own room,
staff names/faces, or that he or she was in a nursing home.
The summary variable in Table 4 indicates the number of items
with which the resident had difficulty. Missing data, which
were not included in the table, did not exceed 1.2 percent
for any item.
Ability to Make Daily Decisions
Respondents reported
the sample resident's ability to make daily decisions. Residents
reported to be
independent were classified as "no impairment";
those with modified independence and moderately impaired were
classified as "some impairment"; and those who were
severely impaired was classified as "severe impairment." Missing
data (less than 1.2 percent) were not included in Table 4.
Behavior Problems
Respondents were
asked how often the sample resident exhibited the following
problems: verbally abusive
behavior, physically abusive behavior, wandering, resistance
to care, or disruptive behavior. The summary variable indicates
the presence of one or more of these behaviors. No individual
behavior problem had more than 1.8 percent missing data. Missing
data were not included in Table 4. For both the summary measures
and measures of individual behavior problems, responses indicating
that the resident had a problem "less than daily" and "daily
or more frequently" were both classified as having a
behavior problem.
Communication
Respondents reported
how well the sample resident was able to understand others
and whether he or she
could be understood by others. Positive responses for "understood" and "usually
understood" were classified as no problem; "sometimes
understood" and "rarely/never understood" were
classified as having a problem. Understanding others was classified
in a similar manner. Responses for both variables were collapsed
into four mutually exclusive categories: no problem, problem
being understood, problem understanding others, or both. Missing
data (less than 1 percent across both variables) were not
included in Table 5.
Health Conditions
Conditions are
active diagnoses that have a relationship to current ADL
status, cognitive status, mood
and behavior status, medical treatments, nurse monitoring,
or risk of death. The health conditions listed in Table 5
were collected from the sample resident's Minimum Data Set
(MDS). The MDS is a uniform series of questions assessing
the nursing home resident's physical and mental status and
is required by law for anyone entering a federally assisted
nursing home. If a valid MDS was not available, conditions
were collected from the resident's medical record. Condition
estimates are preliminary and will change when full-year data
are edited. Data in this report do not include conditions
listed as "other specify," nor do they include conditions
identified from other medical records if the resident had
a valid MDS. However, these data will be included in the full-year
file.
Hearing and Vision
Respondents reported
sample residents' ability to hear and see using four categories
ranging from adequate
to severely impaired. "Minimal difficulty" was classified
as "impaired," and "highly" and "severely" impaired
were combined and classified as "highly impaired." Missing
data (less than 2 percent for both items) were not included
in Table 5.
Incontinence Data on bladder
and bowel control were collected from the MDS and refer
to continence in the last 14 days.
Residents were classified as incontinent if the response indicated
that they were incontinent or frequently incontinent. Residents
reported to be continent, usually continent, or occasionally
incontinent were classified as having no incontinence. Responses
for bladder and bowel control were collapsed into four mutually
exclusive categories: no incontinence, bladder incontinence
only, bowel incontinence only, and both bladder and bowel
incontinence. Of the sample, 32 persons (less than 1 percent
of the total) were comatose and initially classified as "inapplicable." These
cases were reclassified as incontinent. Persons with missing
data ("don't know") were assumed to have no difficulty
with bowel and/or bladder control and were reclassified as
continent; these persons represented less than .5 percent
of the total sample for any item.
Reliability and
Standard Error Estimates
Since the statistics presented in this report
are based on a sample, they may differ somewhat from the figures
that would have been obtained if a complete census had been
taken. This potential difference between sample results and
a complete count is the sampling error of the estimate.
The chance that an estimate from the sample
would differ from the value for a complete census by less
than one standard error is about 68 out of 100.
The chance that the difference between
the sample estimate and a complete census would be less than
twice the standard error is about 95 out of 100.
Tests of statistical significance were
used to determine whether differences between estimates exist
at specified levels of confidence or whether they simply occurred
by chance. Differences were tested using Z-scores having asymptotic
normal properties, based on the rounded figures at the .05
level of significance.
Estimates for sample sizes of less than
50 do not meet standards of reliability or precision and are
not reported. In addition, estimates with a relative standard
error greater than 30 percent are marked with an asterisk.
Such estimates cannot be assumed to be reliable.
Rounding
Estimates presented in the tables have been
rounded to the nearest .1 percent. Population estimates have
been rounded to the nearest hundred. The rounded estimates,
including those underlying the standard errors, will not always
add to 100 percent or the full total.
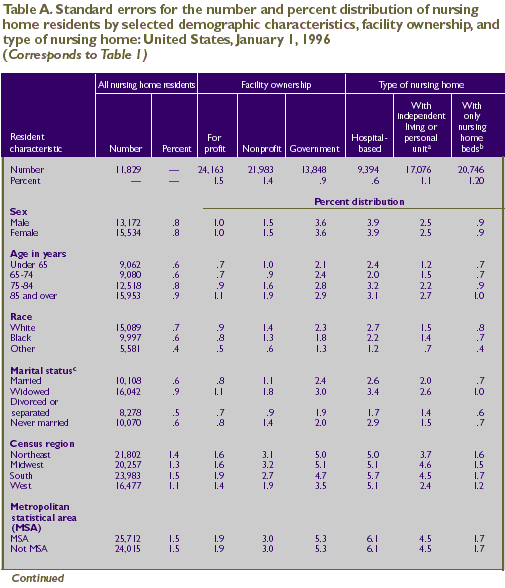
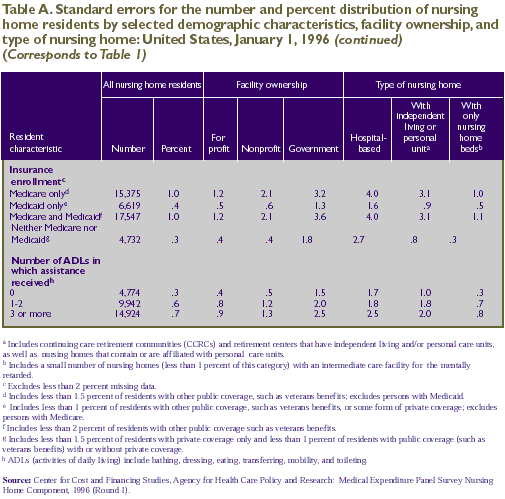
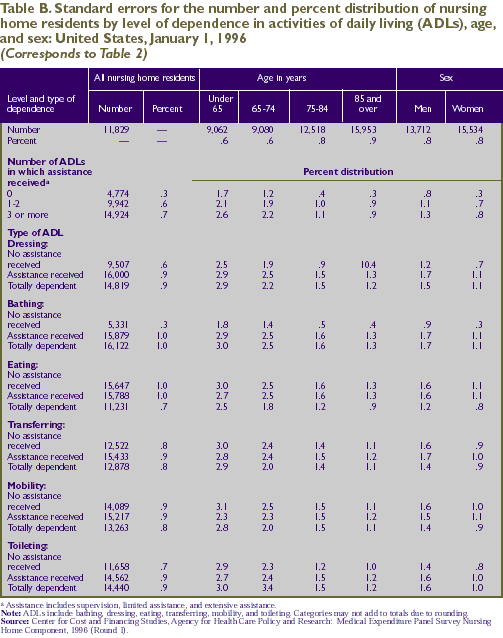
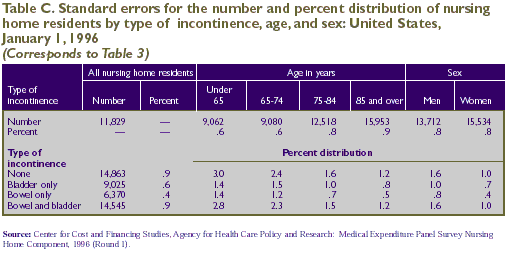
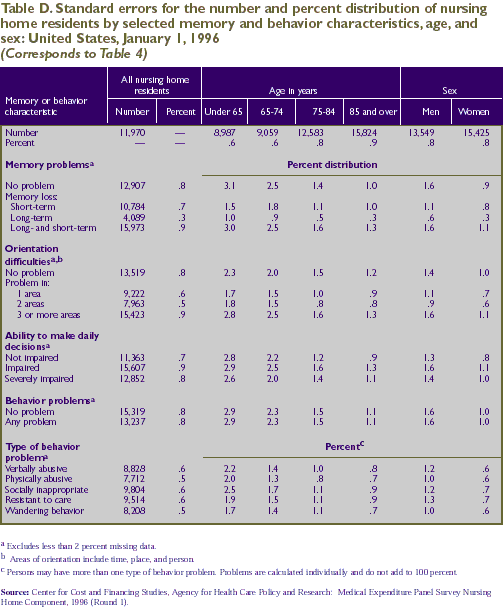
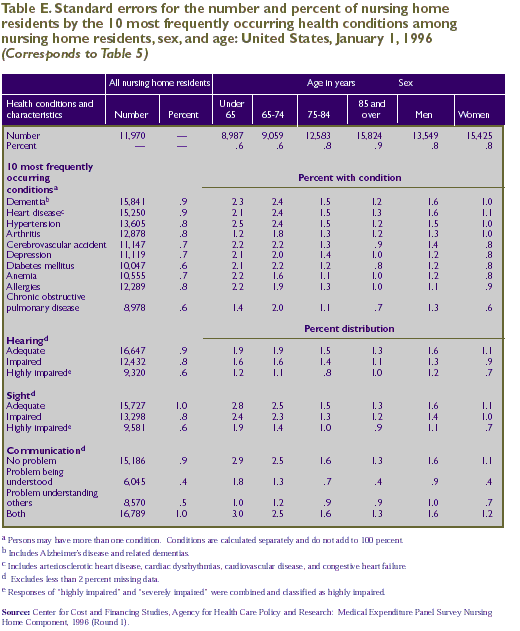
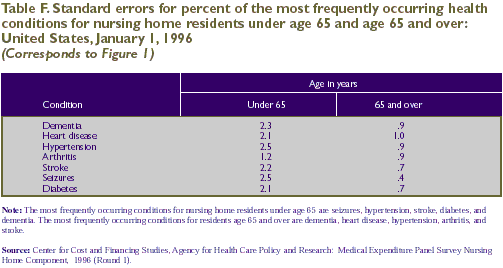
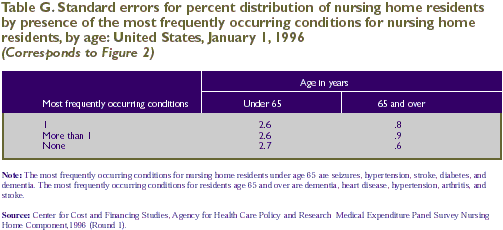
Standard Errors
The standard errors in this report are based
on estimates of standard errors derived using the Taylor series
linearization method to account for the complex survey design.
The standard error estimates were computed using SUDAAN (Shah,
Barnwell, and Bieler, 1995). The direct estimates of the standard
errors for the estimates in Tables 1-5 in the text are provided
in Tables A-E, respectively.
For example, the estimate for male nursing
home residents of 28.4 percent (Table 1) has an estimated
standard error of .8 percent (Table A). The estimate for white
nursing home residents of 1,387,000 (Table 1) has an estimated
standard error of 15,089 residents (Table A).
^top
^top
^top
^top
^top
^top
^top
Suggested Citation: Research Findings #5: Characteristics of Nursing Home Residents, 1996. December 2004. Agency for Healthcare Research and Quality, Rockville, MD. http://www.meps.ahrq.gov/data_files/publications/rf5/rf5.shtml |
|
