
|
|
|
Font Size:
|
||||
|
|
|
|
||||
Combined Prevalence of Chronic Conditions or Obesity for Adults in 2022
Research Findings #52 | August 2025 | Zhengyi Fang, MS, and Rebecca Ahrnsbrak, MPS
Highlights
- The combined prevalence for adults of chronic conditions or obesity was 77.2 percent in 2022.
- The combined prevalence increased with age from adults aged 18-22 (52.2%) to adults aged 80 and older (99.0%).
- Women aged 18-64 (75.1%) had higher combined prevalence than men aged 18-64 (67.6%).
- Adults aged 18-64 who were covered by any private insurance (72.7%) or public insurance only (74.4%), had higher combined prevalence than adults aged 18-64 without health insurance for the entire year (53.4%).
- Adults living in the West (72.4%) had lower combined prevalence than other regions (77.2%-79.2%). Adults not living in MSAs (85.2%) had higher combined prevalence than those living in MSAs (76.0%).
Abstract
Chronic conditions and obesity affect the health and well-being of many Americans. This Research Findings uses 2022 Medical Expenditure Panel Survey Household Component data to produce nationally representative prevalence estimates of having either chronic conditions or obesity for adults in the U.S. civilian noninstitutionalized population. The combined prevalence of having either chronic conditions or obesity for adults is examined by age, sex, health insurance, poverty, region, and Metropolitan Statistical Area (MSA).
Introduction
Both chronic conditions and obesity have affected the health and well-being of Americans for years, and they continue to burden a large portion of the U.S. population. About 60 percent of adults had at least one chronic condition in 2014.1 The Centers for Disease Control and Prevention (CDC) reported that the prevalence of obesity for adults was 40.3 percent in 2021-2023.2
In 2013, the American Medical Association (AMA) decided to recognize obesity as a chronic condition. However, the general public and researchers have been slow to define obesity as a medical condition.
Using Medical Expenditure Panel Survey (MEPS) Household Component data, this Research Findings presents the combined prevalence of having either chronic conditions or obesity for adults by age, sex, health insurance, poverty, region, and Metropolitan Statistical Area (MSA) in 2022.
All differences between estimates discussed in the text are statistically significant at the 0.05 level.
Findings
Overall (figure 1)
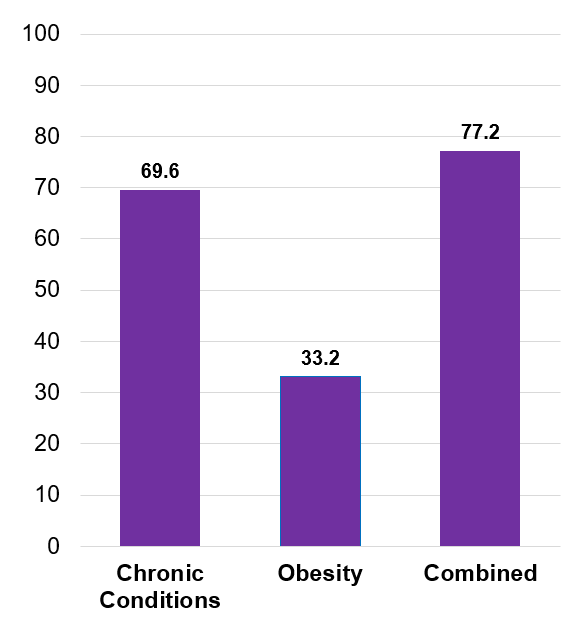
Among adults, 69.6 percent had at least one chronic condition, 33.2 percent had obesity, and 77.2 percent had either chronic conditions or obesity.
Age (figure 2)
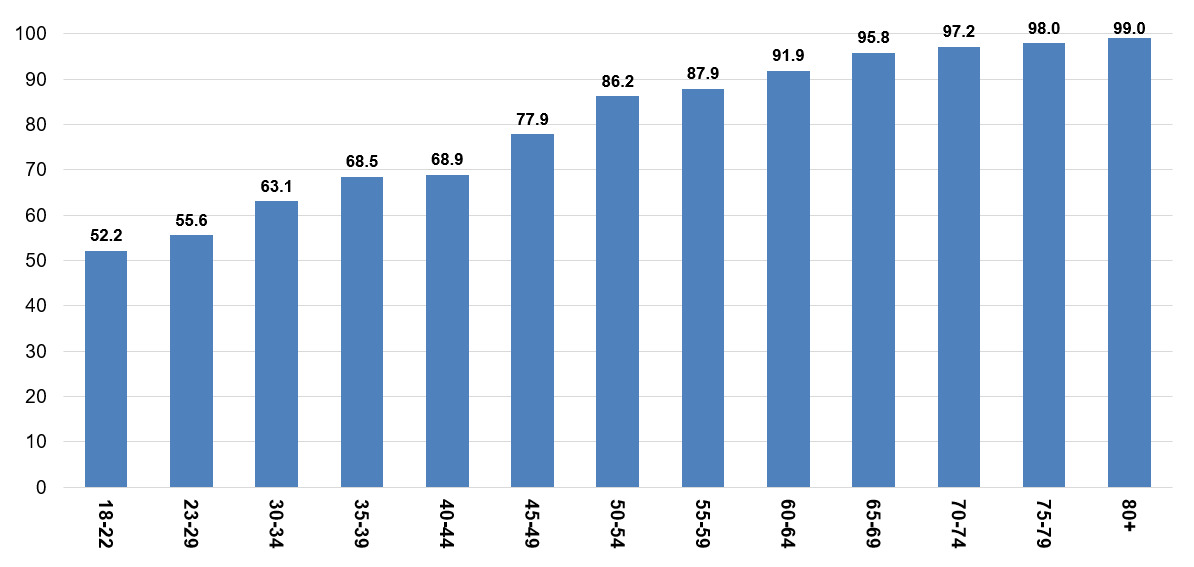
The combined prevalence of chronic conditions or obesity increased dramatically with age for adults, ranging from 52.2 percent of adults aged 18-22 to 99.0 percent of adults aged 80 or older.
Sex (figure 3)
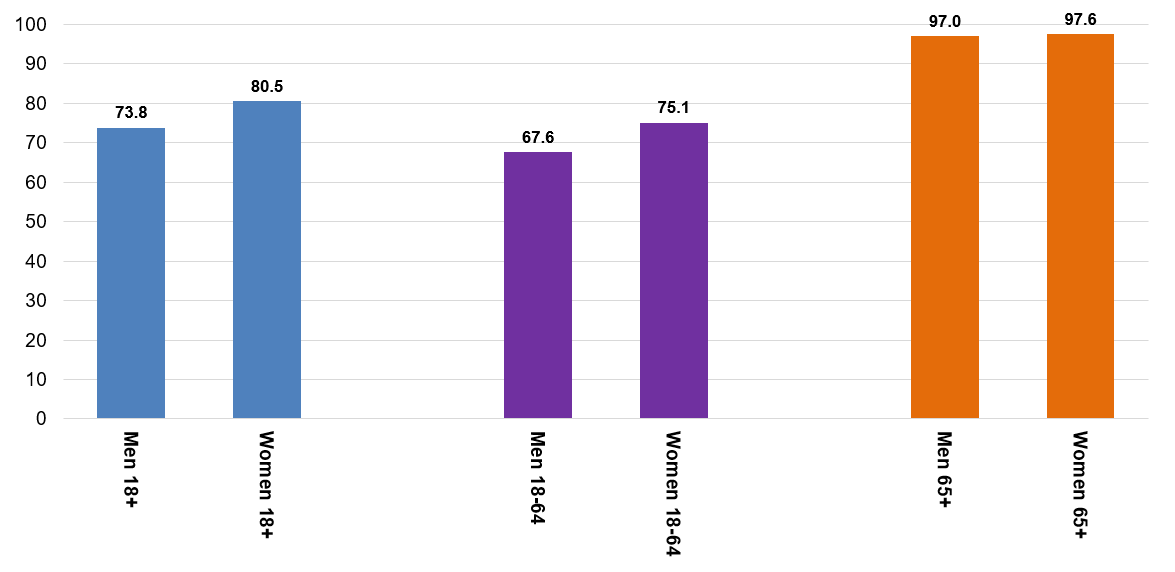
Women aged 18-64 (75.1%) had higher combined prevalence than men aged 18-64 (67.6%). No statistically significant difference was found between elderly men and elderly women.
Health Insurance (figure 4)
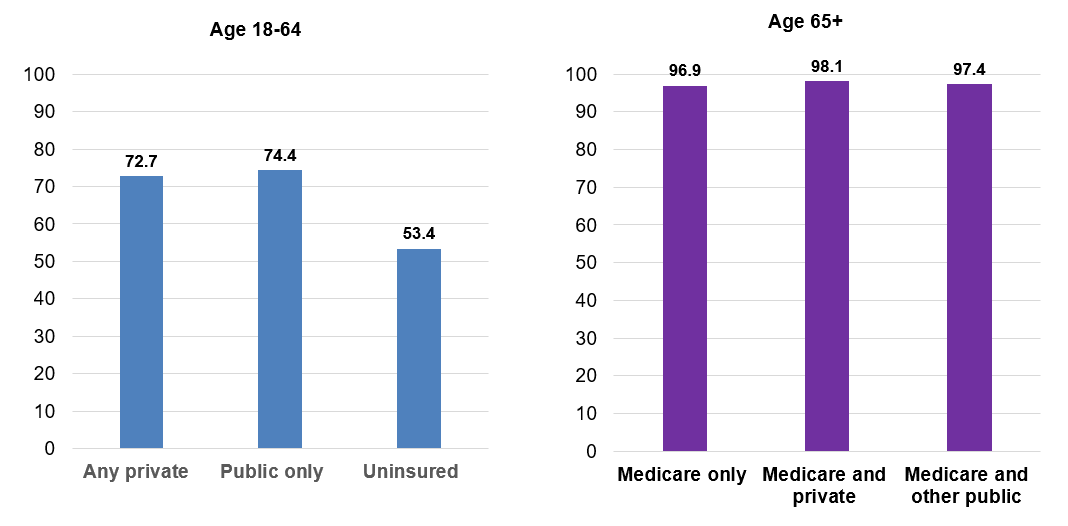
Non-elderly adults who were covered by any private insurance (72.7%) or public insurance only (74.4%), had higher combined prevalence than non-elderly adults without health insurance for the entire year (53.4%).
Poverty (figure 5)
No statistically significant differences for combined prevalence were found by poverty status.
Region and MSA (figure 6)
Adults living in the West (72.4%) had lower prevalence of chronic conditions or obesity than those living in other regions. There were no statistically significant differences among those living in the Northeast, Midwest, and South. Adults not living in an MSA (85.2%) had higher combined prevalence than people living in an MSA (76.0%).
Data Source
This Research Findings uses data from the 2022 MEPS Full-Year Consolidated File (HC-243), Medical Conditions File (HC-241), Condition-Event Link File (HC-239I), Office-Based Medical Provider Visits File (HC-239G), Outpatient Visits File (HC-239F), Emergency Room Visits File (HC-239E), Prescribed Medicines File (HC-239A), Hospital Inpatient Stays File (HC-239D), Home Health File (HC-239H), non-public version of conditions data with fully specified ICD-10 codes, and Healthcare Cost and Utilization Project (HCUP) Chronic Condition Indicator Refined (CCIR) file.3
Definitions
Study Population
Since Body Mass Index (ADBMI42) for adults was calculated for each person based on self-reported height and weight in the MEPS Self-Administered Questionnaire (SAQ), only adults with a positive SAQ weight (SAQWT22F) are included in this study. SAQWT22F was used to calculate the weighted, nationally representative, estimates for civilian, noninstitutionalized adults.
Chronic Conditions
Treated chronic conditions, diagnosed chronic conditions, serious vision problems (DFSEE42=1), and serious hearing problems (DFHEAR42=1) were used to define chronic conditions.
Treated chronic conditions: MEPS HC household respondents reported conditions that led to or were discovered during medical events (e.g., office visit, prescription drug purchase, etc.), and reported conditions were coded into International Classification of Diseases, 10th Revision, Clinical Modification (ICD-10-CM) codes. Chronic conditions were identified using the fully specified ICD-10 codes and the HCUP Chronic Condition Indicator Refined tool.
Diagnosed chronic conditions were determined using the following Priority Conditions:
- High blood pressure (BPMLDX=1)
- Heart diseases (CHDDX=1 or ANGIDX=1 or MIDX=1 or OHRTDX=1)
- Stroke (STRKDX=1)
- Emphysema (EMPHDX=1)
- High cholesterol (CHOLDX=1)
- Cancer (CANCERDX=1)
- Arthritis (ARTHDX=1)
- Chronic bronchitis (CHBRON31=1)
- Diabetes (DSDIA53=1)
- Asthma (ASTHDX=1 and (ASSTIL31=1 or ASATAK31=1))
Obesity
In the 2022 full-year consolidated data, 6 percent of adults with positive SAQ weights have missing BMI values. Missing BMI values were statistically imputed with predicted values from two regressions. The first regression was run for adults who had valid BMI categorical values in the 2018, 2020, and 2021 NHIS data (which can be linked to the 2022 MEPS data) and used the following independent variables: NHIS BMI category, age group, race/ethnicity, weight management advice (ADWTAD42), treatment of hypertension (CCSR=CIR007 or CIR008), and any moderate exercise per week (ADDAYEXER42). The second regression was run for adults who did not have valid NHIS BMI categorical values and used the following independent variables: age group, race/ethnicity, weight management advice (ADWTAD42), treatment of hypertension (CCSR=CIR007 or CIR008), and any moderate exercise per week (ADDAYEXER42). Adults were classified as having obesity if they had a BMI of 30 or higher.
Age
The age variable is based on the sample person's age at round 4/2 (AGE42X), the round in which the SAQ was fielded. Adults were defined as anyone aged 18 or older.
Sex
Sex has two values: male or female. Sex was initially determined in the previous National Health Interview Survey (NHIS). Sex was verified, corrected, and/or collected for the first time during the MEPS interview.
Health Insurance
For adults aged 18 to 64, health insurance was defined as any private insurance if the sampled person was reported to have any private health insurance coverage (including TRICARE/CHAMPVA) at any point during the year regardless of whether they also had other types of health insurance. Public only was assigned if the only sources of health insurance coverage reported for a sampled member during the year were public sources. Public sources include Medicare, Medicaid, Veteran's Administration (VA), the State Children's Health Insurance Program (SCHIP), and other public hospital/physician coverage. The Indian Health Service is not included as a public source of coverage in this classification. Uninsured refers to sample members who had no reported form of health insurance coverage for the entire year. For elderly adults aged 65 or older, Medicare only was assigned if the sampled person's only source of health insurance coverage for the entire year was Medicare. Medicare and private was assigned if they were covered by both Medicare and private insurance (including TRICARE/CHAMPVA) at any point during the year. Medicare and other public are for those who were covered by Medicare and other public insurance (including Medicaid/SCHIP or other public coverage but excluding TRICARE/CHAMPVA) at any point during the year.
Poverty
Each sample member was classified according to the total annual income of their family. Possible sources of income included annual earnings from wages, salaries, bonuses, tips, and commissions; business and farm gains and losses; unemployment and Workers' Compensation; interest and dividends; alimony, child support, and other private cash transfers; private pensions, individual retirement account withdrawals, Social Security benefits, and Department of Veterans Affairs payments; Supplemental Security Income and cash welfare payments from public assistance, and aid to families with dependent children; gains or losses from estates, trusts, partnerships, S corporations, rent, and royalties; and a small amount of "other" income. Poverty status is the ratio of family income to the corresponding federal poverty thresholds, which control for family size and the age of the head of the family. Categories are defined as follows:
- Poor: Household income below 100 percent of the federal poverty line
- Near poor or low income: 100 percent to less than 200 percent of the poverty line
- Middle income: 200 percent to less than 400 percent of the poverty line
- High income: Greater than or equal to 400 percent of the poverty line
Region
Each MEPS household was classified, based on state of residence at round 4/2, as belonging to one of four regions as defined by the U.S. Census Bureau:
Northeast: Connecticut, Maine, Massachusetts, New Hampshire, New Jersey, New York, Pennsylvania, Rhode Island, and Vermont;
Midwest: Indiana, Illinois, Iowa, Kansas, Michigan, Minnesota, Missouri, Nebraska, North Dakota, Ohio, South Dakota, and Wisconsin;
South: Alabama, Arkansas, Delaware, District of Columbia, Florida, Georgia, Kentucky, Louisiana, Maryland, Mississippi, North Carolina, Oklahoma, South Carolina, Tennessee, Texas, Virginia, and West Virginia; or
West: Alaska, Arizona, California, Colorado, Hawaii, Idaho, Montana, Nevada, New Mexico, Oregon, Utah, Washington, and Wyoming.
Metropolitan Statistical Area (MSA)
The MSA variable was based on the location of the household at round 4/2 and reflects the most recent delineations of MSAs established by the Office of Management and Budget (OMB). An MSA contains a core urban area with a population of 50,000 or more. All counties that are not part of an MSA are considered rural.
About MEPS-HC
The MEPS-HC collects nationally representative data on healthcare use, expenditures, sources of payment, and insurance coverage for the U.S. civilian noninstitutionalized population. The MEPS-HC is cosponsored by the Agency for Healthcare Research and Quality (AHRQ) and the National Center for Health Statistics (NCHS). More information about the MEPS-HC can be found at https://meps.ahrq.gov/. For a detailed description of the MEPS-HC survey design, sample design, and methods used to minimize sources of non-sampling error, see the following publications:
Cohen, J. Design and Methods of the Medical Expenditure Panel Survey Household Component. MEPS Methodology Report No. 1. AHCPR Pub. No. 97-0026. 1997. Agency for Health Care Policy and Research (AHCPR), Rockville, MD. https://meps.ahrq.gov/data_files/publications/mr1/mr1.pdf
Cohen S. Sample Design of the 1996 Medical Expenditure Panel Survey Household Component. MEPS Methodology Report No. 2. AHCPR Pub. No. 97-0027. 1997. Agency for Health Care Policy and Research, Rockville, MD. https://meps.ahrq.gov/data_files/publications/mr2/mr2.pdf
References
1 Buttorff C, Ruder T, Bauman M. Multiple Chronic Conditions in the United States. Rand Corp.; 2017. https://www.rand.org/content/dam/rand/pubs/tools/TL200/TL221/RAND_TL221.pdf
2 Emmerich S, Fryar C, Stierman B, Ogden C. Obesity and Severe Obesity Prevalence in Adults: United States, August 2021-August 2023. NCHS Data Brief No. 508, September 2024. https://www.cdc.gov/nchs/products/databriefs/db508.htm
3 Chronic Condition Indicator Refined (CCIR) for ICD-10-CM. Healthcare Cost and Utilization Project (HCUP). https://hcup-us.ahrq.gov/toolssoftware/chronic_icd10/chronic_icd10.jsp
Suggested Citation
Fang, Z. and Ahrnsbrak, R. Combined Prevalence of Chronic Conditions or Obesity for Adults in 2022. Research Findings #52. AHRQ Publication No. 25-0064. August 2025. Agency for Healthcare Research and Quality, Rockville, MD. https://meps.ahrq.gov/data_files/publications/rf52/rf52.pdf
AHRQ welcomes questions and comments from readers of this publication who are interested in obtaining more information about access, cost, use, financing, and quality of healthcare in the United States. We also invite you to tell us how you are using this Research Finding and other MEPS data and tools and to share suggestions on how MEPS products might be enhanced to further meet your needs. Please email MEPSProjectDirector@ahrq.hhs.govor send a letter to the address below:
Samuel H. Zuvekas, PhD, Acting Director
Center for Financing, Access and Cost Trends
Agency for
Healthcare Research and Quality
5600 Fishers Lane, Mailstop 07W41A
Rockville, MD 20857
Figures
Figure 1. Combined Prevalence (%) of Chronic Conditions or Obesity for Adults, 2022
| Prevalence (%) | |
|---|---|
| Chronic Conditions | 69.6 |
| Obesity | 33.2 |
| Combined | 77.2 |
Source: Agency for Healthcare Research and Quality, Medical Expenditure Panel Survey, Household Component, 2022
Figure 2. Combined Prevalence (%) of Chronic Conditions or Obesity for Adults by Age, 2022
| Age Group | Prevalence (%) |
|---|---|
| 18-22 | 52.2 |
| 23-29 | 55.6 |
| 30-34 | 63.1 |
| 35-39 | 68.5 |
| 40-44 | 68.9 |
| 45-49 | 77.9 |
| 50-54 | 86.2 |
| 55-59 | 87.9 |
| 60-64 | 91.9 |
| 65-69 | 95.8 |
| 70-74 | 97.2 |
| 75-79 | 98.0 |
| 80+ | 99.0 |
Source: Agency for Healthcare Research and Quality, Medical Expenditure Panel Survey, Household Component, 2022
Figure 3. Combined Prevalence (%) of Chronic Conditions or Obesity for Adults by Sex and Age, 2022
| Sex | Ages 18+ | Ages 18-64 | Prevalence (%) |
|---|---|---|---|
| Men | 73.8 | 67.6 | 97.0 |
| Women | 80.5 | 75.1 | 97.6 |
Source: Agency for Healthcare Research and Quality, Medical Expenditure Panel Survey, Household Component, 2022
Figure 4. Combined Prevalence (%) of Chronic Conditions or Obesity for Adults by Health Insurance, 2022
| Health Insurance | Age Group | Prevalence (%) |
|---|---|---|
| Any private | 18-64 | 72.7 |
| Public only | 18-64 | 74.4 |
| Uninsured | 18-64 | 53.4 |
| Medicare only | 65+ | 96.9 |
| Medicare and private | 65+ | 98.1 |
| Medicare and other public | 65+ | 97.4 |
Source: Agency for Healthcare Research and Quality, Medical Expenditure Panel Survey, Household Component, 2022
Figure 5. Combined Prevalence (%) of Chronic Conditions or Obesity for Adults by Poverty Status, 2022
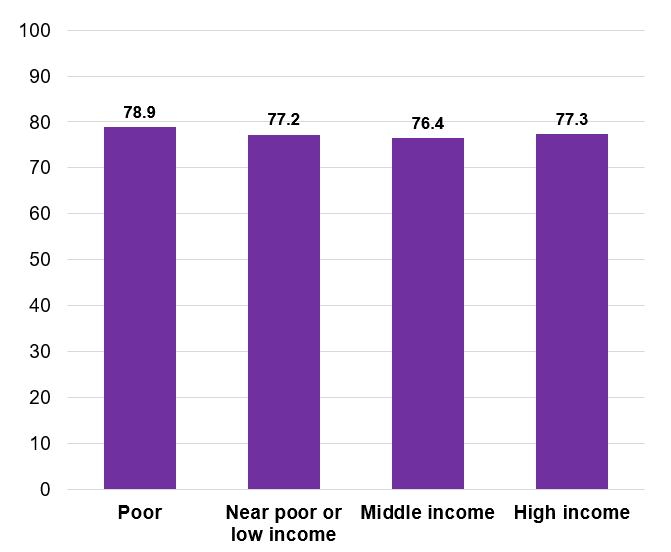
| Poverty Status | Prevalence (%) |
|---|---|
| Poor | 78.9 |
| Near poor or low income | 77.2 |
| Middle income | 76.4 |
| High income | 77.3 |
Source: Agency for Healthcare Research and Quality, Medical Expenditure Panel Survey, Household Component, 2022
Figure 6. Combined Prevalence (%) of Chronic Conditions or Obesity for Adults by Region and MSA, 2022
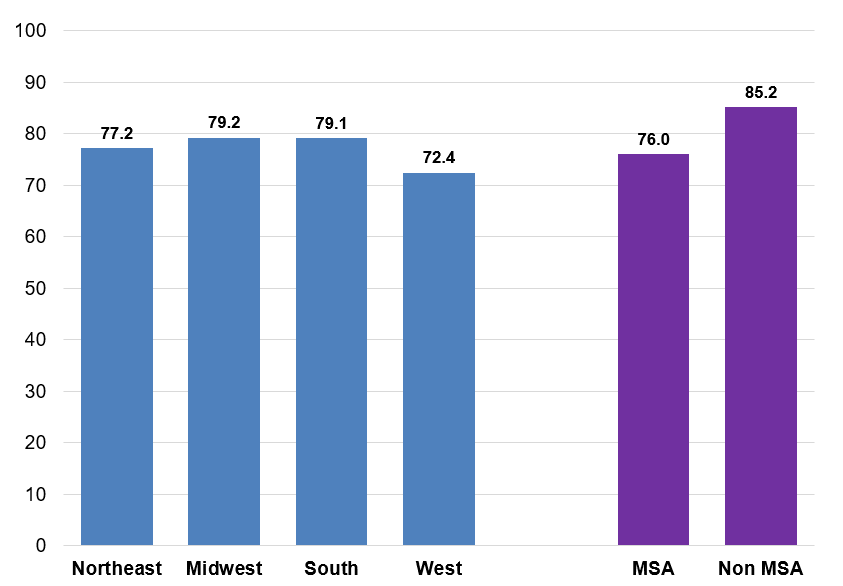
| Region / MSA | Prevalence (%) |
|---|---|
| Northeast | 77.2 |
| Midwest | 79.2 |
| South | 79.1 |
| West | 72.4 |
| MSA | 76.0 |
| Non MSA | 85.2 |
Source: Agency for Healthcare Research and Quality, Medical Expenditure Panel Survey, Household Component, 2022
AHRQ Pub. No. 25-0064
August 2025