Research Findings
#6: Special Care Units in Nursing Homes - Selected Characteristics,
1996
Marc Freiman, PhD and Erwin Brown, Jr., BS
Introduction
Nursing homes in the United States are devoting
more resources to the treatment needs of special populations, primarily
through the formation of special care units. Several trends have
contributed to the creation of these units. The size of the nursing
home population has increased 1 to 2 percent annually from 1987
to 1996, and today's nursing home population is more functionally
and cognitively disabled and requires more skilled and/or specialized
care than ever before (Spillman, Krauss, and Altman, 1997). Shorter
lengths of stay in hospitals also have resulted in a greater need
for skilled and rehabilitative care following hospitalization.
Home health care has partially addressed this need, but there continues
to be a subset of individuals who need sophisticated, labor-intensive,
24-hour skilled supervision. In addition, increasing public awareness
of Alzheimer's disease and related dementias has created interest
in programs that provide services tailored to the needs of people
with these conditions.
This report is based on the 1996 Medical Expenditure
Panel Survey (MEPS) Nursing Home Component (NHC), conducted by
the Agency for Health Care Research and Qualtiy (AHRQ). It provides
estimates of the number and distribution of nursing homes by type
of facility, type of ownership and chain affiliation, certification
status, facility size, and geographic distribution. The nursing
home characteristics presented in this report are derived from
information provided by facility administrators and designated
staff in sampled nursing homes.
The 1996 MEPS NHC is a national, yearlong panel
survey of nursing homes and their residents. MEPS is the third
in a series of AHRQ-sponsored surveys to collect information on
the health care use and spending of the American public. The first
survey was the 1977 National Medical Care Expenditure Survey (NMCES),
and the second was the 1987 National Medical Expenditure Survey
(NMES). NMES was the first national expenditure survey to contain
an institutional component designed explicitly to collect detailed
medical expenditure information on people in long-term care facilities
(Potter, 1998).
^top
Defining Special
Care Units
Special care programs span a continuum, from
individualized treatment of people with special needs through formal
programs where specialized providers care for people with special
needs. These programs may also set aside specific portions of a
nursing facility for people with special needs or form distinct
units specifically designated and staffed for people with specific
needs. For example, the range of possibilities with regard to the
treatment of Alzheimer's disease and related dementias is explored
in the survey results reported in Leon, Chang-Kuo, and Alvarez
(forthcoming). In this Research Findings, "special
care" refers to units established for any special population,
not just units designated for Alzheimer's disease and related dementias.
The MEPS NHC gathered
data on "formal" special
care units as part of an effort to delineate the structure of the
nursing facility and any larger facility of which it might be a
part. Specifically, the survey interviewer asked:
"We're interested in learning about any
special care units within [the nursing home]—units with a
specified number of beds identified and dedicated for residents
with specific needs or diagnoses. Does [the nursing home] have
any special care units, such as those listed on this card?"
The respondent was then shown a card listing
the following types of special care units and asked which type(s)
of units the facility contained:
- Alzheimer's and related dementias.
- AIDS/HIV.
- Dialysis.
- Children with disabilities.
- Brain injury (traumatic or acquired).
- Hospice.
- Huntington's disease.
- Rehabilitation.
- Ventilator/pulmonary.
- Some other kind of unit.
If "some other kind of unit" was chosen,
the respondent was asked for specifics, and the responses were
coded into existing or new categories. Respondents also were asked
for the number of beds in each type of unit they identified. Because
there appears to be no clear and generally accepted distinction
in the nursing home industry between rehabilitation and subacute
care units, facilities that reported "some other kind of unit" as "subacute" had
their units grouped in the rehabilitation category. If a facility
reported more than one unit in a category, the beds in these units
were summed and the facility was counted as having only one unit
in that category.
A subsequent question
asked, "Does [the
special care unit] have direct patient care staff dedicated to
it?" In 96 percent of the cases, the response was "yes" (data
not shown). This information provides further support for the perspective
that the special care treatment analyzed here is furnished in formal
distinct units.
^top
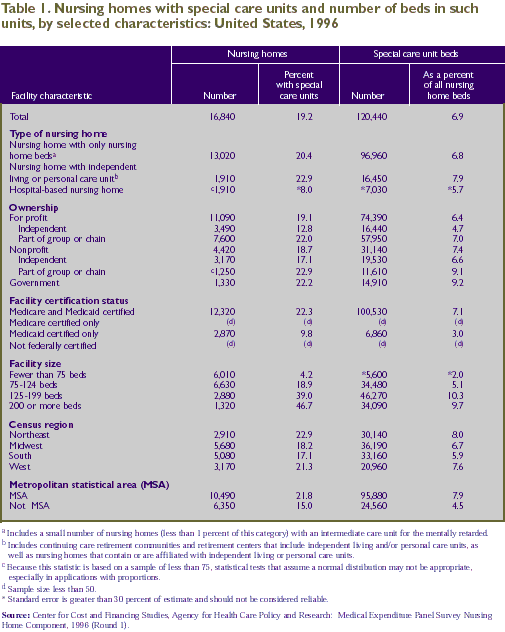
As shown in Table 1, 19.2 percent of all nursing
facilities had at least one distinct special care unit. These special
care units contained 120,440 beds, or 6.9 percent of all nursing
home beds.
Hospital-based nursing homes were less likely
than other facility types to have special care units (8.0 percent
versus 20.4 percent of nursing homes with only nursing beds and
22.9 percent of nursing homes with independent living and/or personal
care beds).
Almost two-thirds (65.9 percent) of nursing
homes operate for profit, and nearly 20 percent (19.1 percent)
of those facilities contain special care units. Among for-profit
facilities, special care units were more likely to be found in
nursing homes that were part of a group or chain (22.0 percent)
than in independent facilities (12.8 percent). Indeed, almost half
(48.1 percent) of all beds in special care units were found in
for-profit facilities that were part of a group or chain (derived
from Table 1). There also was a clear correlation between the number
of nursing beds in the facility and the probability that it contained
a special care unit. The percentage of nursing homes with a special
care unit increased from 4.2 percent of facilities with fewer than
75 beds to 46.7 percent of facilities with 200 or more beds.
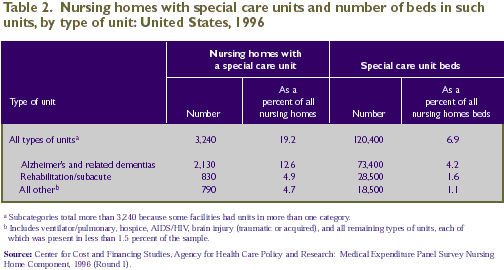
Table 2 provides
greater detail on the types of special care units. By far the
largest category of special care
units was for Alzheimer's disease and related dementias; these
units constituted two-thirds (65.7 percent) of all special care
units found in our sample (data derived from Table 2). More than
a tenth (12.6 percent) of nursing homes—or 2,130 homes—had
an Alzheimer's unit, with the number of beds in these units totaling
73,400. In addition, 4.9 percent of nursing homes had a distinct
rehabilitation and/or subacute care unit, for a total of 28,500
beds. Finally, almost 800 facilities had some other kind of special
care unit or units; there were 18,500 beds in these units. Types
of units included in this "other" grouping were ventilator/pulmonary,
hospice, AIDS/HIV, and brain injury (traumatic or acquired) units.
Each of these types was present in less than 1.5 percent of the
sample, which precludes separate reliable estimation of these categories.
Nursing Homes With Special Care Units
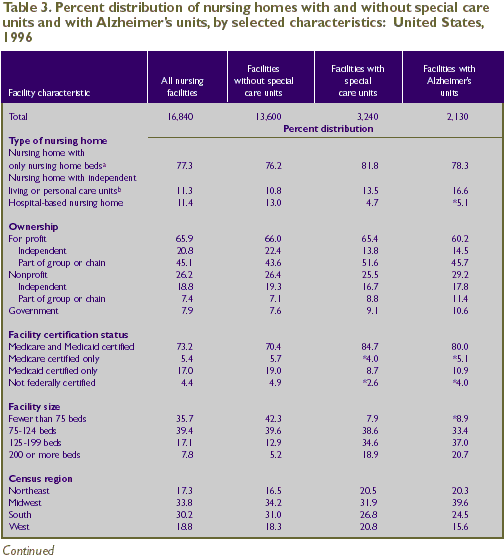
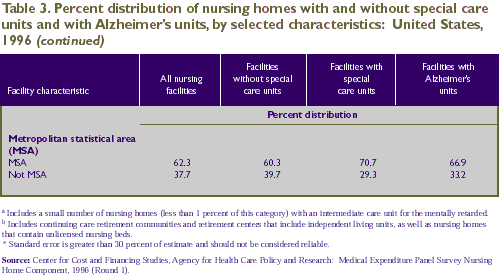
Table 3 presents characteristics of facilities
with special care units, and with Alzheimer's units specifically,
compared to nursing homes without any special care units. Only
4.7 percent of nursing homes with special care units and 5.1 percent
of nursing homes with Alzheimer's units were hospital based, compared
with 13.0 percent of facilities without any type of special care
unit.
There was little difference in the distribution
of for-profit/nonprofit ownership among nursing homes without any
special care units, facilities with special care units, and those
with Alzheimer's units. However, among for-profit facilities, there
were differences between nursing homes that were part of a group
or chain and those that were independent. Only 13.8 percent of
nursing homes with special care units and 14.5 percent of those
with Alzheimer's units were independent for-profit homes, whereas
22.4 percent of facilities without special care units were independent
and for profit.
Nursing homes with any type of special care
unit, as well as those with Alzheimer's units specifically, were
more likely to be certified by both Medicare and Medicaid (84.7
percent and 80.0 percent, respectively) than facilities without
any special care unit (70.4 percent). Further, over half (53.5
percent) of nursing homes with special care units had 125 or more
total nursing beds, whereas only 18.1 percent of homes without
any special care units fell into this size range.
Alzheimer's Units
Because Alzheimer's units accounted for two-thirds
(65.7 percent) of all special care units, we can present greater
detail on the characteristics of such units. In 1996, the average
Alzheimer's unit had been in existence for a little more than 6
years (data not shown). According to Figure 1, 55.6 percent of
the units had been in operation for 5 years or less. Less than
a tenth (9.7 percent) of the units had been operating for 11 years
or more.
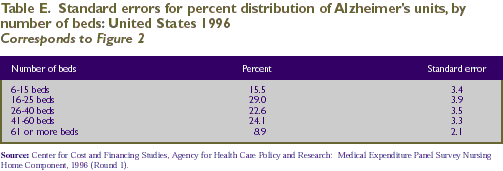
The average Alzheimer's unit contained 34 beds
(data not shown). Figure 2 shows that 46.7 percent of the units
had 26-60 beds. Less than a tenth (8.9 percent) of the units had
more than 60.
^top
Figures


^top
Tables
^top
Agency for Health Care Policy and Research. Round
1, facility-level public use file codebook. In: Medical Expenditure
Panel Survey (MEPS) NHC-001: Round 1 Sampled Facility and Person
Characteristics, March 1997 [CD-ROM]. Rockville (MD), 1997. AHRQ
Pub. No. 97-DP21.
Bethel J, Broene P, Sommers JP. Sample design
of the 1996 Medical Expenditure Panel Survey Nursing Home Component.
Rockville (MD): Agency for Health Care Policy and Research; 1998. MEPS
Methodology Report No. 4. AHRQ Pub. No. 98-0042.
Leon JL, Chang-Kuo C, Alvarez RJ. Trends in
special care: changes in SCU from 1991 to 1995. Journal of Mental
Health and Aging (forthcoming).
Potter, DEB. Design and methods of the 1996
Medical Expenditure Panel Survey Nursing Home Component. Rockville
(MD): Agency for Health Care Policy and Research; 1998. MEPS
Methodology Report No. 3. AHRQ Pub. No. 98-0041.
Shah BV, Barnwell BG, Bieler GS. SUDAAN user's
manual: software for the statistical analysis of correlated data.
Research Triangle Park (NC): Research Triangle Institute; 1995.
Spillman B, Krauss N, Altman B. A comparison
of nursing home resident characteristics: 1987 to 1996. Presented
at the annual meeting of the Gerontological Society of America;
1997. Cincinnati (OH).
U.S. Bureau of the Census. Statistical abstract
of the United States: 1996 (116th edition). Washington; 1996.
^top
Data Sources and Methods
of Estimation
The data in this report were obtained from a
nationally representative sample of nursing homes from the Nursing
Home Component (NHC) of the 1996 Medical Expenditure Panel Survey
(MEPS). The sampling frame was derived from the updated 1991 National
Health Provider Inventory. The NHC was primarily designed to provide
unbiased national and regional estimates for the population in
nursing homes, as well as estimates of these facilities and a range
of their characteristics.
The sample was selected using a two-stage stratified
probability design, with facility selection in the first stage.
The second stage of selection consisted of a sample of residents
as of January 1, 1996, and a rolling sample of persons admitted
during the year (Bethel, Broene, and Sommers, 1998). Of the 1,123
eligible nursing homes sampled in the NHC, 85 percent responded.
Estimates in this report are based on these 952 eligible responding
facilities. To bring the sample size in line with the original
design of approximately 800 facilities by the end of Round 3, the
facility sample was subsampled at the end of Round 1. A total of
127 facilities were randomly deselected.
The MEPS NHC data analyzed here were collected
in person during the first of three rounds of data collection.
A computer-assisted personal interview (CAPI) system was used for
data collection. The Round 1 interview took place during the period
March-June 1996. The entire three-round data collection effort
took place over a 1 1/2 year period, with the reference period
being January 1, 1996, to December 31, 1996 (Potter, 1998).
The facility questionnaire
was designed to elicit information on the complex structure of
institutions that
provide residential care or treatment. Some nursing homes or units
exist within larger establishments. In such cases, the entity that
appeared on the sampling frame might be the larger facility, the
nursing home or unit within the larger facility, or only one of
several nursing units within the larger facility. Therefore, the
NHC's Round 1 facility questionnaire was designed to identify the
larger facility, each eligible nursing home or unit within the
larger establishment, and other nonhospital residential parts.
Because of this, the point of reference for a specific question
may be the sampled nursing home or unit (hereafter referred to
as "nursing home"), a larger facility, another nonhospital
residential part of a larger facility, one or several nursing homes
within a larger facility, or a smaller subunit of the eligible
nursing home (Agency for Health Care Policy and Research, 1997).
Data on the sampled nursing homes were obtained
using a facility questionnaire administered through CAPI to facility
administrators or designated staff. Estimates provided are preliminary
and are subject to revision as more information from other parts
of the NHC becomes available.
Data in data files released
to the public have, in some instances, been masked to preserve
the confidentiality
of responding nursing homes. As a result, estimates made using
the public use version of the data may differ slightly from the
estimates presented in this report.
Facility Eligibility
Only nursing homes were eligible for inclusion
in the MEPS NHC. To be included as a nursing home, a facility must
have at least three beds and meet one of the following criteria:
- It must have a facility or distinct portion
of a facility certified as a Medicare skilled nursing facility
(SNF).
- It must have a facility or distinct portion
of a facility certified as a Medicaid nursing facility (NF).
- It must have a facility or distinct portion
of a facility that is licensed as a nursing home by the State
health department or by some other State or Federal agency and
that provides onsite supervision by a registered nurse or licensed
practical nurse 24 hours a day, 7 days a week (Bethel, Broene,
and Sommers, 1998).
By this definition, all
SNF- or NF-certified units of licensed hospitals are eligible for
the sample, as are
all Department of Veterans Affairs (VA) long-term care nursing
units. In such cases, and in the case of retirement communities
with nursing facilities, only the long-term care nursing units(s)
of the facility were eligible for inclusion in the sample. If a
facility also contained a long-term care unit that provided assistance
only with activities of daily living (e.g., a personal care unit)
or provided nursing care at a level below that required to be classified
as a nursing facility, that unit was excluded from the sample (Potter,
1998).
Facility Type
This variable, constructed from data from the
facility questionnaire, defines the facility's organizational structure
as one of three types:
- Hospital-based nursing home. This indicates
that the sampled nursing home was part of a hospital or was a
hospital-based Medicare SNF.
- Nursing home with independent living or personal
care unit. This category includes continuing care retirement
communities (CCRCs) and retirement centers that have independent
living and/or personal care units, as well as nursing homes that
contain personal care units. Non-hospital-based nursing homes
with a separate unit in which personal care assistance is provided
also are included.
- Nursing home with only nursing home beds.
This category includes a small number of nursing homes (less
than 1 percent) with an intermediate care unit for the mentally
retarded (ICF-MR).
The order of priority for coding facility type
followed the sequence listed above.
Ownership
Respondents reported the ownership type that
best described their facility (or larger part of the facility,
in situations where the sampled nursing home was part of a larger
facility), as follows:
- For profit (i.e., individual, partnership,
or corporation).
- Private nonprofit (e.g., religious group,
nonprofit corporation).One of four
types of public ownership—city/county
government, State government, VA, or other Federal agency.
Respondents also reported
whether their facility was part of a chain or group of nursing
facilities operating under
common management.
Facility Certification StatusRespondents were asked whether
any unit in their facility or part of the larger facility (in cases
where the sampled
nursing home was reported to be part of a larger facility) was
certified by Medicare as an SNF and/or Medicaid as an NF. For the
purpose of this report,facilities were assigned to mutually exclusive
categories based on their responses.
Facility SizeThe size of the sampled
nursing home was determined by the number of nursing beds regularly
maintained for residents.
Beds contained within the sampled nursing home but not licensed
for nursing care were excluded; 65 of the 952 nursing homes reported
having such unlicensed beds. There were 28,000 unlicensed beds
in addition to the 1,756,800 total weighted beds in the sample.
These unlicensed beds represented less than 2 percent of the beds
in the sampled nursing homes. If the sampled nursing home was part
of a larger facility, only the licensed nursing home beds were
included.
Census Region
Sampled nursing homes
or units were classified in one of four regions—Northeast, Midwest, South, and West—based
on their
geographic location according
to the MEPS NHC sampling frame. These regions are defined by the
U.S. Bureau of the Census. Facility LocationA metropolitan statistical
area (MSA) is defined as including (1) at least one city with 50,000
or more inhabitants
or (2) a Census Bureau-defined urbanized area of at least 50,000
inhabitants and a total metropolitan population of at least 100,000
(75,000 in New England) (U.S.Bureau of the Census, 1996).
MSA data were missing for 14 facilities; an
MSA/non-MSA determination was made after a review of the county's
population density according to the 1990 census.
Reliability and
Standard Error Estimates
Since the statistics presented in this report
are based on a sample, they may differ somewhat from the figures
that would have been obtained if a complete census had been taken.
This potential difference between sample results and a complete
count is the sampling error of the estimate.
The chance that an estimate from the sample
would differ from the value for a complete census by less than
one standard error is about 68 out of 100. The chance that the
difference between the sample estimate and a complete census would
be less than twice the standard error is about 95 out of 100.
Tests of statistical significance were used
to determine whether differences between estimates exist at specified
levels of confidence or whether they simply occurred by chance.
Differences were tested using Z-scores having asymptotic normal
properties, based on the rounded figures at the 0.05 level of significance.
Estimates for sample sizes of less than 50
do not meet standards of reliability or precision and are not reported.
In addition, estimates with a relative standard error greater than
30 percent are marked with an asterisk. Such estimates cannot be
assumed to be reliable.
Rounding
Estimates of percentages presented in the tables
have been rounded to the nearest 0.1 percent. The rounded estimates,
including those underlying the standard errors, will not always
add to 100 percent or the full total. To avoid conveying a false
sense of precision, estimates of the number of nursing homes and/or
units have been rounded to the nearest ten, and estimates of the
number of beds have been rounded to the nearest hundred.
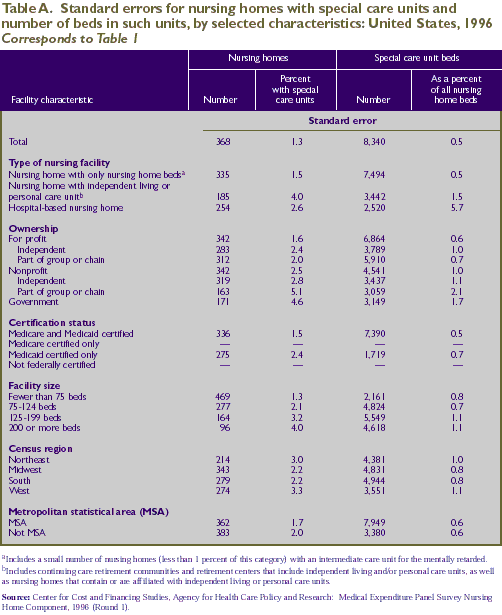
The standard errors in this report are based
on estimates of standard errors derived using the Taylor series
linearization method to account for the complex survey design.
The standard error estimates were computed using SUDAAN (Shah,
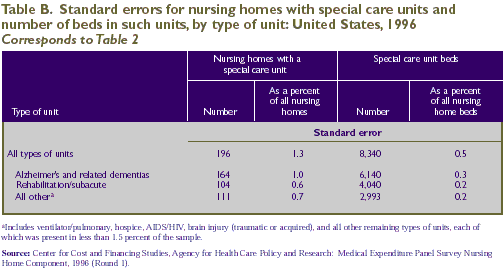
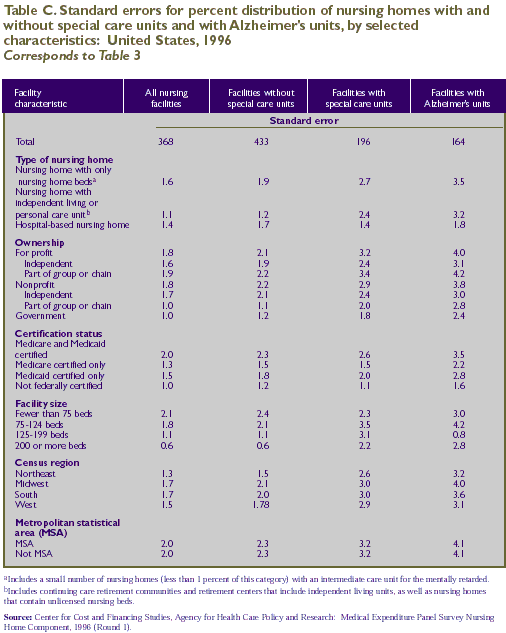
Barnwell, and Bieler, 1995). The direct estimates of the standard
errors for the estimates in Tables 1-3 in the text are provided
in Tables A-C, respectively; the standard errors for Figures 1
and 2 are provided in Tables D and E, respectively.
For example, the estimate
of 120,440 beds in special care units (Table 1) has an estimated
standard error of
8,340 beds (Table A). The estimate that 65.4 percent of facilities
with special care units operate for profit (Table 3) has an estimated
standard error of 3.2 percent (Table C).

^top
Suggested
Citation: Research Findings #6: Special Care Units in Nursing Homes - Selected Characteristics, 1996. January 1999. Agency
for Healthcare Research and Quality, Rockville, MD. http://www.meps.ahrq.gov/data_files/publications/rf6/rf6.shtml
|
| 