|
|
Font Size:
|
||||
|
|
|
|
||||
STATISTICAL BRIEF #10:
Differentials in Employment-Related Health Insurance Coverage - 2000
Briefly Stated
- In the first half of 2000, 61.4 percent of U.S. workers (excluding the self-employed) held health insurance through their current main job.
- Nonunion workers employed by small establishments (those with less than 10 employees) in the agriculture, forestry, and fisheries industry group were less likely to have health insurance through their jobs than other workers.
- Managers and administrators making more than $21.00 per hour and employees working 35 or more hours per week were among those most likely to have job-related health insurance.
- With respect to ownership, a larger percent of government workers--both federal and state and local--had health insurance through their current main job than those employed in the private sector.
Introduction
Health insurance received through an employer is the source of that coverage for the majority of workers in the U.S. Data from the 2000 Medical Expenditure Panel Survey (MEPS), conducted by the Agency for Healthcare Research and Quality, show that 61.4 percent of workers obtained coverage through their current main job in the first half of the year. Yet the likelihood of having health insurance varies widely among workers based on the characteristics of their jobs. These characteristics include industry, occupation, employer size, union status, and others.
In addition to their current main job, workers have other possible sources of health insurance coverage. Some employees hold insurance through
- other employment,
- job-related insurance obtained through a family member's employment,
- private insurance purchased individually, or
- a public program, such as Medicaid.
Findings
Employees who belonged to a labor union were much more likely to be covered by health insurance through their current main job than nonunion workers were (data not shown). While 88.0 percent of union workers had such coverage, only 57.6 percent of nonunion workers did. Union workers make up about 13 percent of all workers.
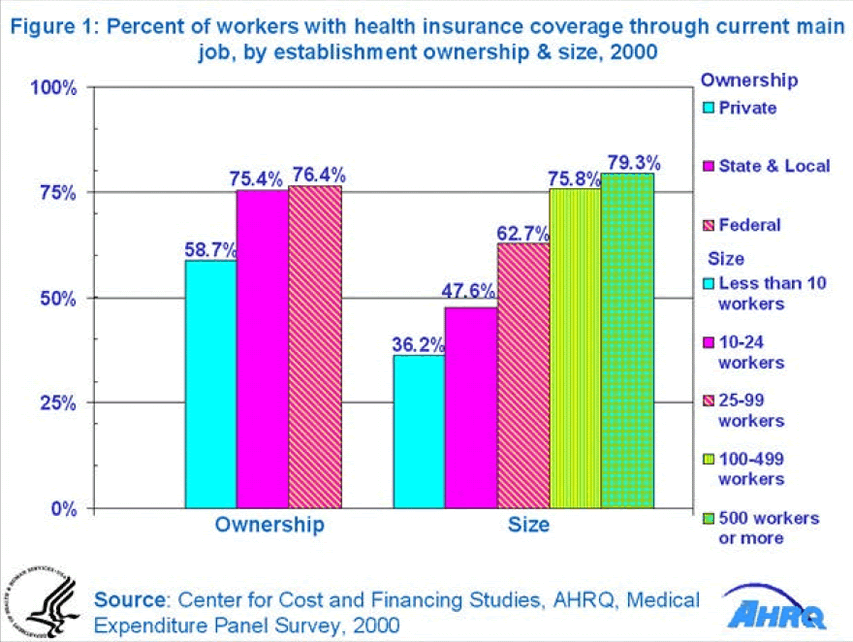
Federal government employees had a higher rate of health insurance coverage (76.4 percent) through their current main job than workers in private industry (58.7 percent) (figure 1). Federal workers exhibited coverage rates very similar to those of state and local government workers (75.4 percent).
Generally, the larger the size of an establishment, the greater the percentage of its workers who had health insurance through their current main job (figure 1). Establishments with 500 or more employees had the largest portion of workers with coverage (79.3 percent) of all size classes. In contrast, the comparable percent for the smallest size class, establishments with less than 10 workers, was 36.2 percent.
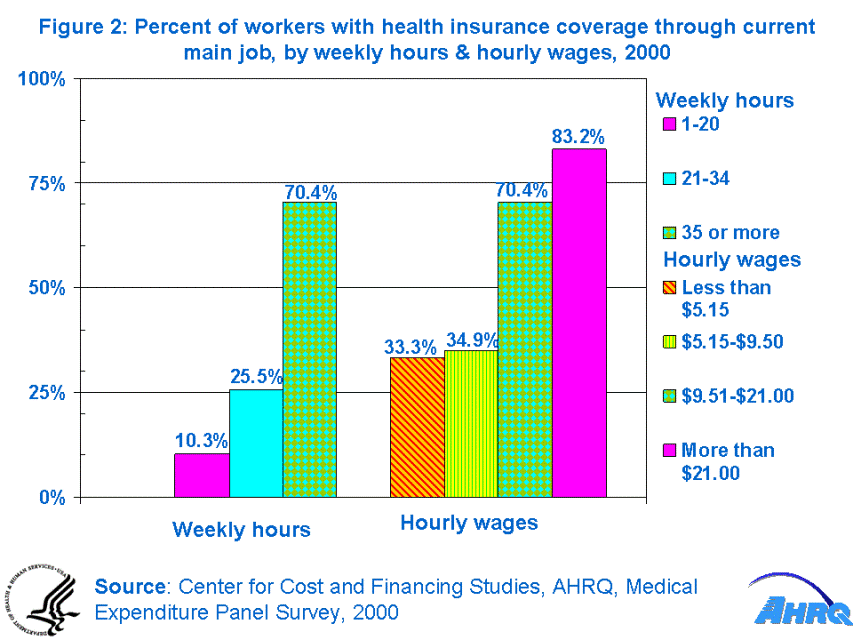
Higher hourly earnings were associated with a greater likelihood of workers having health insurance coverage through their current main job (figure 2). While only one-third of workers making less than minimum wage ($5.15 per hour) had insurance coverage in the first half of 2000, 83.2 percent of workers making more than $21.00 per hour had insurance. Coverage rates for other earnings categories fell in between those two levels.
Just as with earnings, as hours worked increased so did the percentage of workers with health insurance (figure 2). Those working 35 or more hours per week were almost seven times as likely to have insurance through their current main job as those working 20 hours or less were, 70.4 percent versus 10.3 percent.
The health insurance coverage rate for most industry groups was significantly different than the overall average of 61.4 percent. Public administration (81.2 percent) and manufacturing (77.0 percent) were among the industries with the highest coverage rates relative to the average (data not shown). In contrast, workers with current main jobs in personal services (30.7 percent) and agriculture, forestry, and fisheries (26.2 percent) were less likely, again relative to the average, to have health insurance.
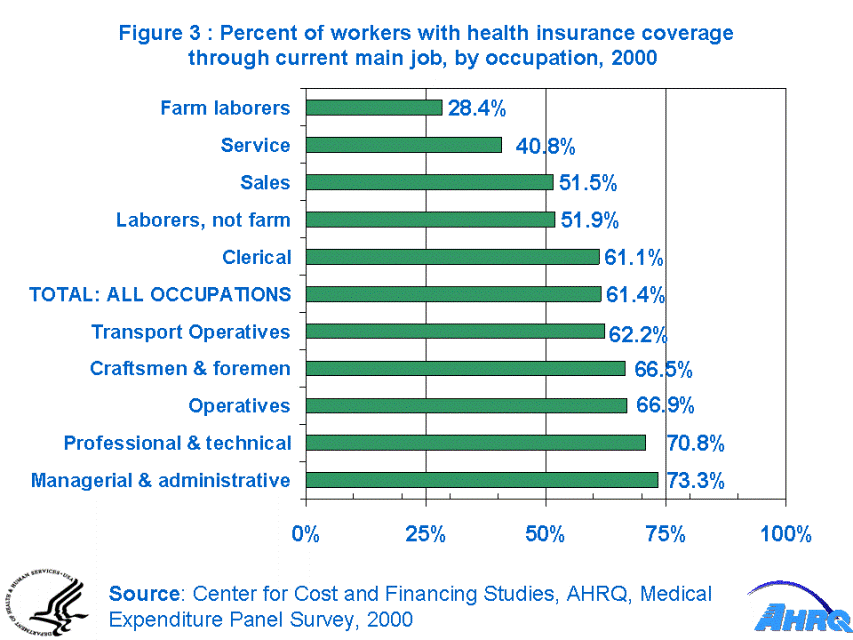
There was a wide range in the percent of workers with health insurance coverage through their current main job when they were classified by occupational group (figure 3). Persons in managerial and administrative jobs had the highest rate of coverage (73.3 percent). Farm laborers were the least likely to have health insurance (28.4 percent).
Definitions
This analysis of job-related health insurance coverage encompasses only persons who held a current main job at the time of their MEPS interview (or who had such a job to which to return) in the first half of 2000. For workers with only one job, that job is the current main job, by default. Any worker with multiple jobs at the interview date was asked to identify his or her current main job.
The discussion is limited to workers aged 18 to 64 in the reference period. Workers with a current main job through self-employment are excluded.
Workers without health insurance through their current main job fall into one of two broad groups--those not offered coverage by their employer and those offered coverage who chose not to take it. For further information on "offer" versus "take-up" rates, see the MEPS Highlight "Job-Based Health Insurance - 1987 and 1996."
The estimates in this analysis come from the 2000 MEPS Full Year Population Characteristics Public Use File (HC-039). The data set has 23,839 person-level survey participants and a pooled response rate for the two MEPS panels of 65.25 percent.
Employees whose insurance coverage status through their current main job is unknown (less than one percent) are counted as not having insurance. If data are not available to classify a worker within a particular characteristic (i.e., union status was unknown), then that worker is included in the total figure but not in the characteristics analysis. Certain categories that do not meet confidentiality and/or reliability criteria (i.e., farm owners within the occupation categories) are excluded from the comparisons.
Only differences that are statistically significant at the 0.05 level are discussed in the text.
 |
||||||||||||||||||||||||||||||||||||||||||||||||
|
||||||||||||||||||||||||||||||||||||||||||||||||
|
|
||||||||||||||||||||||||||||||||||||||||||||||||
 |
||||||||||||||||||||||||||||||||||||||||||||||||
|
||||||||||||||||||||||||||||||||||||||||||||||||
|
|
||||||||||||||||||||||||||||||||||||||||||||||||
 |
||||||||||||||||||||||||||||||||||||||||||||||||
|
||||||||||||||||||||||||||||||||||||||||||||||||
|
|
||||||||||||||||||||||||||||||||||||||||||||||||


