
|
|
|
Font Size:
|
||||
|
|
|
|
||||
STATISTICAL BRIEF #110:
The Top Five Therapeutic Classes of Outpatient Prescription Drugs Ranked by Total Expenses for Adults Age 18 and Older in the U.S. Civilian Noninstitutionalized Population, 2003
Highlights
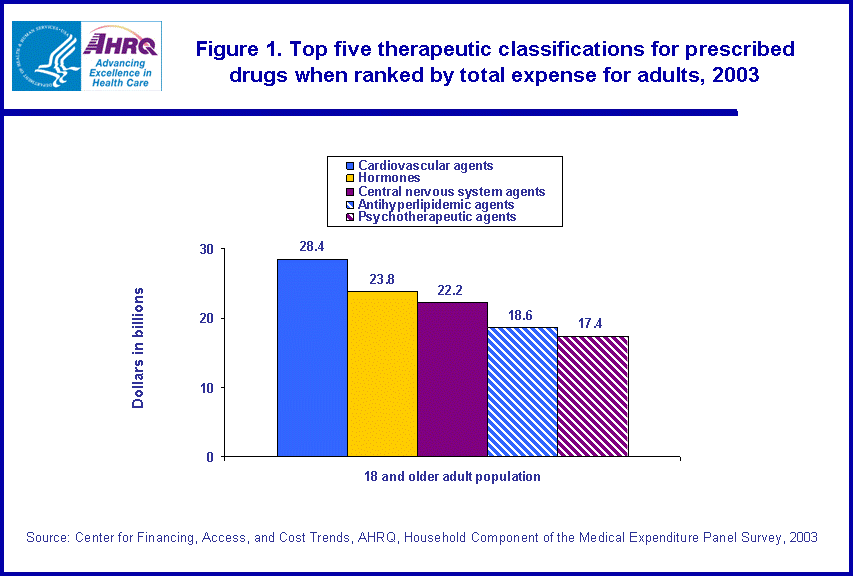
- In 2003, the top five therapeutic classes for adults when ranked by total expenses for prescription drugs were cardiovascular agents ($28.4 billion), hormones ($23.8 billion), central nervous system agents ($22.2 billion), antihyperlipidemic agents (18.6 billion), and psychotherapeutic agents ($17.4 billion).
- Expenditures on the top five therapeutic classes when ranked by total expenses totaled $110.4 billion and represented two-thirds (66.0 percent) of total expenditures spent on prescription drugs by the adult population ($167.2 billion).
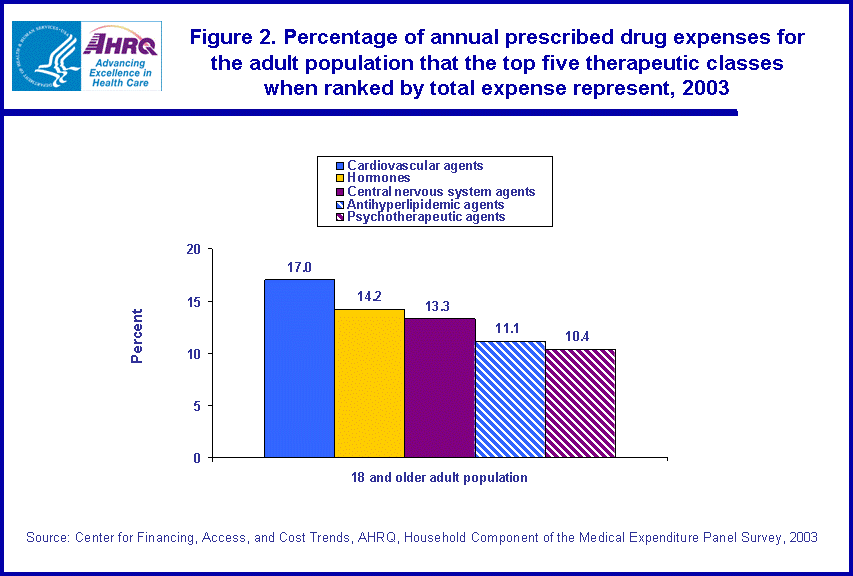
- During 2003, cardiovascular agent prescription medicine expenses accounted for 17.0 percent of total prescription drug expenses by adults.
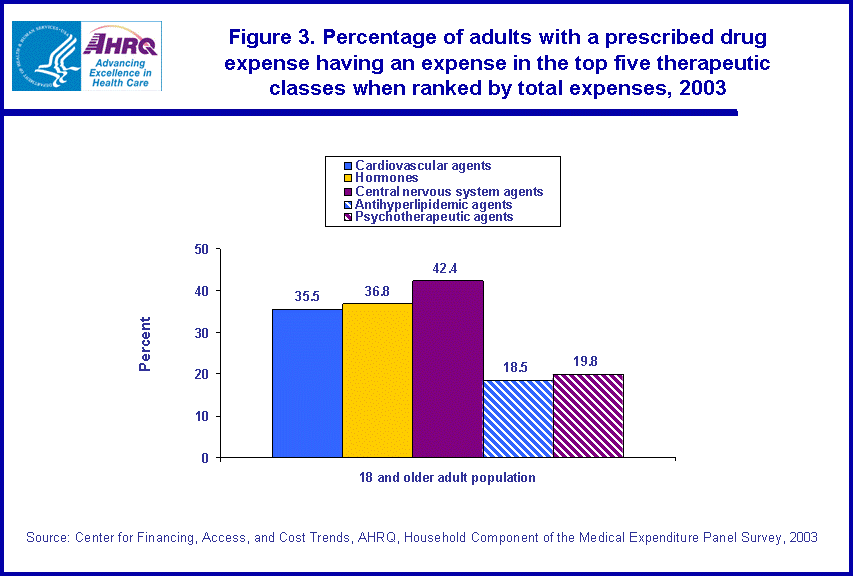
- Over 40 percent (42.4 percent) of the adult population with a prescribed drug expense in 2003 purchased a central nervous system agent, which was higher than the percentage for the remaining top four therapeutic classes.
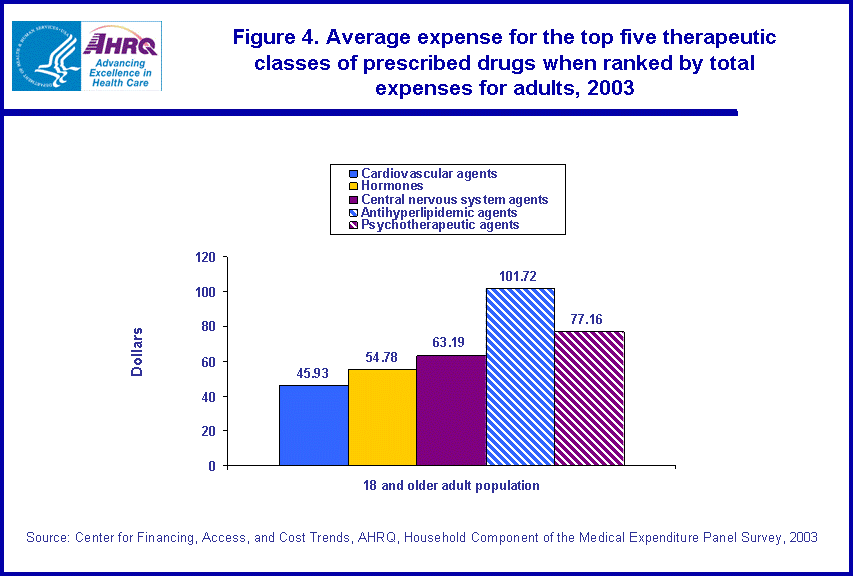
- Of the top five therapeutic classes for adults, antihyperlipidemic agents had the highest average expense ($101.72), which was more than double the average expense of the therapeutic class with the lowest average expense, cardiovascular agents ($45.93).
Introduction
This Statistical Brief provides a summary of the top five therapeutic classes of outpatient prescription drugs for adults age 18 and older when ranked by total expenses, as reported by households in the U.S. civilian noninstitutionalized population in calendar year 2003. The brief also provides estimates for the age 18 and older population on the percentage of annual prescribed drug expenses the top five therapeutic classes represent, the percentage of those with a prescribed drug expense having an expense in these classes of drugs, and the mean expenses in these classes of drugs.
The estimates in this brief are derived from the Household Component of the 2003 Medical Expenditure Panel Survey (MEPS-HC). Over-the-counter drugs and free samples are not included in these estimates. All results discussed are statistically significant at the 0.05 level.
Findings
In 2003, the top five therapeutic classes for prescribed drugs purchased by adults age 18 and older when ranked by annual expenses totaled $110.4 billion and represented 66.0 percent of the $167.2 billion total expenses by adults for prescription drugs (estimates not shown). Cardiovascular agents ranked first in terms of total expenses at $28.4 billion and were higher than total expenses spent on any of the remaining top four therapeutic classes: hormones ($23.8 billion), central nervous system agents ($22.2 billion), antihyperlipidemic agents ($18.6 billion), and psychotherapeutic agents (17.4 billion). Total annual expenses for hormones was higher than total expenses for antihyperlipidemic agents and psychotherapeutic agents, and total expenses for central nervous system agents was higher than total expenses on psychotherapeutic agents. (figure 1)
In 2003, annual expenses for cardiovascular agents represented 17.0 percent of total prescription drug expenses by the adult population, which was a higher percentage than each of the remaining four therapeutic classes in the top five represented. The 14.2 percent that hormones represented of total prescribed drugs purchased by adults in 2003 was higher than the percentages that antihyperlipidemic agents (11.1 percent) and psychotherapeutic agents (10.4 percent) represented. In addition, the 13.3 percent of total drug expenses by adults that central nervous system agents represented was higher than the percentages represented by antihyperlipidemic agents (11.1 percent) and psychotherapeutic agents (10.4 percent). (figure 2)
In 2003, for adults with a prescribed drug expense, central nervous system agents had the highest percentage of adults purchasing one (42.4 percent) as compared to the other four categories in the top five therapeutic classes of prescription drugs when ranked by total expenses. The percentage of adults purchasing a cardiovascular agent (35.5 percent) and the percentage purchasing a hormone (36.8 percent) were higher than the percentages of adults purchasing antihyperlipidemic agents (18.5 percent) and psychotherapeutic agents (19.8 percent). (figure 3)
Of the top five therapeutic classes when ranked by total expenses for adults in 2003, antihyperlipidemic agents had an average expense over $100 ($101.72), which was higher than the average expense for the remaining four classes: cardiovascular agents ($45.93), hormones ($54.78), central nervous system agents ($63.19), and psychotherapeutic agents ($77.16). The average expense for cardiovascular agents, $45.93, was less than the average expense for the other classes in the top five therapeutic classes. The average expense for psychotherapeutic agents ($77.16) was higher than the average expense for central nervous system agents ($63.19) and hormones ($54.78). Furthermore, the average expense for central nervous system agents was higher than the average expense for hormones. (figure 4)
Definitions/Methodology
Therapeutic classes were assigned to drugs using Multum Lexicon variables from Cerner Multum, Inc. For additional information on these and other Multum Lexicon variables, as well as the Multum Lexicon database itself, please refer to the following Web site: http://www.multum.com/Lexicon.htm.
About MEPS-HC
MEPS-HC is a nationally representative longitudinal survey that collects detailed information on health care utilization and expenditures, health insurance, and health status, as well as a wide variety of social, demographic, and economic characteristics for the civilian noninstitutionalized population. It is cosponsored by the Agency for Healthcare Research and Quality and the National Center for Health Statistics.
For more information about MEPS, call the MEPS information coordinator at AHRQ (301-427-1656) or visit the MEPS Web site at http://www.meps.ahrq.gov/.
References
For a detailed description of the MEPS survey design, sample design, and methods used to minimize sources of nonsampling error, see the following publications:
Cohen, J. Design and Methods of the Medical Expenditure Panel Survey Household Component. MEPS Methodology Report No. 1. AHCPR Pub. No. 97-0026. Rockville, Md.: Agency for Health Care Policy and Research, 1997.
Cohen, S. Sample Design of the 1996 Medical Expenditure Panel Survey Household Component. MEPS Methodology Report No. 2. AHCPR Pub. No. 97-0027. Rockville, Md.: Agency for Health Care Policy and Research, 1997.
Cohen, S. Design Strategies and Innovations in the Medical Expenditure Panel Survey. Medical Care, July 2003: 41(7) Supplement: III-5-III-12.
Suggested Citation
Stagnitti, M. N. The Top Five Therapeutic Classes of Outpatient Prescription Drugs Ranked by Total Expenses for Adults Age 18 and Older in the U.S. Civilian Noninstitutionalized Population, 2003. Statistical Brief #110. January 2006. Agency for Healthcare Research and Quality, Rockville, MD. http://meps.ahrq.gov/mepsweb/data_files/publications/st110/stat110.shtml
AHRQ welcomes questions and comments from readers of this publication who are interested in obtaining more information about access, cost, use, financing, and quality of health care in the United States. We also invite you to tell us how you are using this Statistical Brief and other MEPS data and tools and to share suggestions on how MEPS products might be enhanced to further meet your needs. Please e-mail us at mepspd@ahrq.gov or send a letter to the address below:
Steven B. Cohen, PhD, Director
Center for Financing, Access, and Cost Trends
Agency for Healthcare Research and Quality
540 Gaither Road
Rockville, MD 20850
 |
||||||||||||||||
|
||||||||||||||||
|
|
||||||||||||||||
 |
||||||||||||||||
|
||||||||||||||||
|
|
||||||||||||||||
 |
||||||||||||||||
|
||||||||||||||||
|
|
||||||||||||||||
 |
||||||||||||||||
|
||||||||||||||||
|
|
||||||||||||||||